Introduction
The two most important transitions of the plant's life cycle are reproduction (from plant to seed) and timing of seed germination or decay of seed dormancy (from seed to plant). Timing of seed germination is the earliest plant life-history attribute and sets the context for subsequent traits associated with fitness, thus influencing fecundity and survival (Donohue et al., Reference Donohue, de Casas, Burghardt, Kovach and Willis2010). In the seed-to-plant chronology, the environment of parental plants can exert a carry-over effect on the offspring beyond one generation (Kendall and Penfield, Reference Kendall and Penfield2012) and this is known as environmental pre-conditioning (Rowe, Reference Rowe1964). For example, seed germination variation is associated with cone-crop years in Picea glauca (Caron et al., Reference Caron, Wang and Schooley1993); germination strategy of Mediterranean pines follows a typical Mediterranean pattern, that is, early accomplishment of seed germination during rainy seasons facilitating seedling development during mild winters and following springs prior to harsh and water-stressed summers (Skordilis and Thanos, Reference Skordilis and Thanos1995), thus indicating an association between seed dormancy and provenance. Of those environmental factors conducive to facultative levels of seed dormancy, temperature is quite critical (Morley, Reference Morley1958; Koller, Reference Koller1962; Bewley et al., Reference Bewley, Bradford, Hilhorst and Nonogaki2012), which strongly mediates short photoperiods for dormancy response in woody species (Svendsen et al., Reference Svendsen, Wilen, Stevenson, Liu and Tanino2007; Granhus et al., Reference Granhus, Fløistad and Søgaard2009; Kalcsits et al., Reference Kalcsits, Silim and Tanino2009a). Moreover, growth cessation, bud set and dormancy are sequential and intricately connected processes in the annual cycle of plants and these processes can be accelerated by temperature in both coniferous and deciduous woody plant species (Kalcsits et al., Reference Kalcsits, Silim and Tanino2009a; Tanino et al., Reference Tanino, Kalcsits, Silim, Kendall and Gray2010).
One of the most important temperature parameters affecting life-history traits is heat sum (i.e. monthly or seasonal degree-hours/days above the 5°C threshold) (Van Dijk and Hautekèete, Reference Van Dijk and Hautekèete2007) and a model which emphasizes heat sum accumulation in combination with night length was developed, highlighting the role of temperature rather than photoperiod in favour of the growth of Pinus sylvestris, Picea abies and Betula pendula (Hänninen et al., Reference Hänninen, Häkkinen, Hari and Koski1990). Furthermore, influence of the circadian temperature is that the day temperature only affects the rate of dormancy development while the night temperature influences most other parameters, including the depth of seed dormancy (Kalcsits et al., Reference Kalcsits, Silim and Tanino2009b). In comparison with temperature, the ecological significance of the precipitation effect seems minor, as most conclusions on the positive correlation between water availability/air humidity and seed dormancy are mainly drawn from studies of annual plants under controlled conditions (Steadman et al., Reference Steadman, Ellery, Chapman, Moore and Turner2004; Hoyle et al., Reference Hoyle, Steadman, Daws and Adkins2008).
The complex mechanism controlling the coupling of dormancy variation to temperature has just begun to be unravelled. In Norway spruce (P. abies), environmental conditions such as temperature during reproduction can substantially affect progeny fitness (Johnsen et al., Reference Johnsen, Fossdal, Nagy, Molmann, Daehlen and Skrøppa2005; Kvaalen and Johnsen, Reference Kvaalen and Johnsen2008; Granhus et al., Reference Granhus, Fløistad and Søgaard2009). More notably, the temperature during post-meiotic megagametogenesis (embryogenesis) and seed maturation could shift the growth cycle programme of embryos and give rise to significant and long-lasting phenotypic changes in the progeny (Skrøppa et al., Reference Skrøppa, Kohmann, Johnsen, Steffenrem and Edvardsen2007). Besides epigenetic mechanism, genetic variation is also responsible for the timing of seed germination and its evolutionary consequences (Baskin and Baskin, Reference Baskin and Baskin1998; Donohue et al., Reference Donohue, de Casas, Burghardt, Kovach and Willis2010). The expression of the DOG1 gene, which governs seed dormancy variation in nature, is influenced by seed maturation temperature (Chiang et al., Reference Chiang, Bartsch, Barua, Nakabayashi, Debieu, Kronholm, Koornneef, Soppe, Donohue and de Meaux2011; Kendall et al., Reference Kendall, Hellwege, Marriot, Whalley, Graham and Penfield2011) and the expression of DORMANCY-ASSOCIATED MADS-BOX (DAM) genes, which are related to bud endodormancy, are also induced by temperature (Horvath et al., Reference Horvath, Sung, Kim, Chao and Anderson2010). In addition, germination phenology and dormancy induced by warm temperature are genetically associated at specific chromosomal regions, as candidate loci were identified in Arabidopsis using quantitative trait locus analysis (QTLs) (Huang et al., Reference Huang, Schmitt, Dorn, Griffith, Effgen, Takao, Koornneef and Donohue2010).
Seed dormancy variation is also mediated by the receptiveness to dormancy-breaking factors or germination triggers (Black et al., Reference Black, Bewley and Halmer2006). The most conspicuous environmental changes affecting perennials are those associated with seasonality (Bradshaw, Reference Bradshaw1965) with emphasis on temperature as the main cue for the timing of seed germination. Such environmental conditions can be described as germination niche, part of the larger regeneration niche (Grubb, Reference Grubb1977; Fenner and Thompson, Reference Fenner and Thompson2005). Moreover, phenotypic plasticity could operate on the expression of traits within particular environments and on the shape of the reaction norm (i.e. a set of phenotypes produced by a genotype over a range of environments) (Schlichting and Pigliucci, Reference Schlichting and Pigliucci1998; Pigliucci, Reference Pigliucci2001). By definition, phenotypic plasticity corresponds to the ability of an organism to react to an environmental input with a change in form, state, movement or rate of activity (West-Eberhard, Reference West-Eberhard2003). It is an inherent mechanism with environmental influence, as the products of certain genes responsible for phenotypic plasticity are constitutively sensitive to environmental cues, such as temperature and/or light (Pigliucci, Reference Pigliucci2001; Pigliucci and Murren, Reference Pigliucci and Murren2003). Relatively, molecular mechanisms underpinning phenotypic plasticity are particularly understood for plant phytochromes correlated with light regime and/or light spectral quality (Schmitt and Wulff, Reference Schmitt and Wulff1993; Andersson and Shaw, Reference Andersson and Shaw1994; Smith, Reference Smith1995).
In this study, we selected three conifer species representing the interior [lodgepole pine (Pinus contorta var. latifolia) and ‘interior’ spruce (Picea glauca (Moench) Voss × Picea engelmannii Parry ex. Engelm.)] and coastal [western hemlock (Tsuga heterophylla)] regions in British Columbia (BC), Canada, to test the hypothesis that patterns of timing of seed germination are correlated with environmental conditions during seed development. The influence of the phenotypic plasticity on seed germination timing was also characterized during seedling emergence. Seed treatments consisted of manipulated conditions [stratification (i.e. moist-chilling), thermo-priming (15 or 20°C) and their combinations] and non-manipulation (control) to retain natural seed dormancy. The environmental conditions applied in this experiment are intended to simulate natural germination ecology (i.e. moist-chilling during winter) and the possible increase in temperature and early arrival of spring anticipated under climate change (IPCC, Reference Solomon, Qin, Manning, Chen, Marquis, Averyt, Tignor and Miller2007). To our knowledge, timing of seed germination in association with climate parameters at seed development has not been studied in gymnosperms, and the results obtained from this study are expected to shed light on the future timing of seed germination under ongoing climate change.
Materials and methods
Seed material and climatic variables during seed maturation
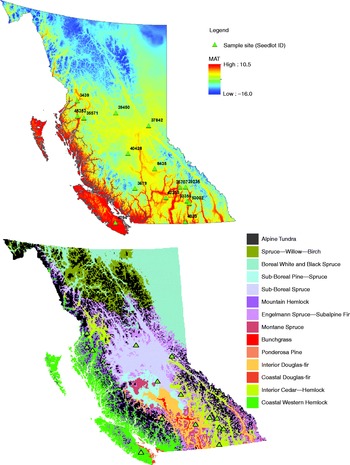
We used five seed lots for each of the three studied species (lodgepole pine, ‘interior’ spruce and western hemlock), and their geographic locations, ecosystem zones and attributes are provided in supplementary Table S1 and Fig. 1. Since the seeds used were stored at − 20°C under strictly controlled humidity and oxygen levels, we assumed that this storage condition did not affect either seed dormancy or timing of germination.
Locations of the 15 seed lots marked in ClimateBC map (above) and ecosystem zones in BC, Canada (below). Seed lot numbers: lodgepole pine, 3679, 4939, 8435, 40 428 and 42 255; ‘interior’ spruce, 33 356, 35 707, 37 842, 39 450 and 45 353; and western hemlock, 3439, 4094, 35 571, 39 235 and 53 002 (source: http://www.for.gov.bc.ca/hfd/library/documents/treebook/biogeo/biogeo.htm).

Monthly and seasonal cumulative heat sums and an additional 193 climate variables for each seed lot's habitat were estimated using ClimateWNA (the average climatic data for the period between 1961 and 1990) (Wang et al., Reference Wang, Hamann, Spittlehouse and Aitken2006, Reference Wang, Hamann, Spittlehouse and Murdock2012).
Germination assay
Each seed lot was represented by four replicates of 75 seeds each. All assays were conducted in a moisture-controlled germination chamber [moisture content (MC) ≈ 97%], using plastic transparent germination boxes (4.5 × 4.5 × 1.5 cm) containing cellulose wadding (Kimpack®) and filter paper saturated with 50 ml of distilled water. Replicates were randomly allocated on trays in the germination chamber with alternating temperatures of 30/20°C (light/dark) under an 8-h photoperiod provided by fluorescent illumination ( ≈ 13.5 μmol m− 2s− 1). Germination count was conducted over a 21-d period following standard International Seed Testing Association rules (i.e. recommended optimum germination conditions for the seed of a particular species) (ISTA, 1999). Germinants were counted daily throughout the germination test and germinated seeds were removed. Seeds were counted as germinated if the radicle emerged to four times the seed length. The numbers of empty and dead seeds were determined at the end by the cutting test, and the total number of seeds used in each replicate was adjusted accordingly.
The germination-manipulated environments consisted of 21-d stratification followed by 3-d thermo-priming at 20°C (E1), 21-d stratification followed by 3-d thermo-priming at 15°C (E2), stratification (E3), 3-d thermo-priming at 20°C (E4), 3-d thermo-priming at 15°C (E5) and no manipulation (control, E6).
Seed germination timing evaluation
Germination parameters were estimated from cumulative germination curves fitting a mathematical function known as the four-parameter Hill function (4-PHF) specifically developed to gauge germination timing and seed dormancy (El-Kassaby et al., Reference El-Kassaby, Moss, Kolotelo and Stoehr2008) as follows:
 $$ Y = Y _{0} + \frac { aX ^{ b }}{ c ^{ b } + X ^{ b }} $$
where Y is the cumulative germination percentage at time X,
 $$Y _{0} $$
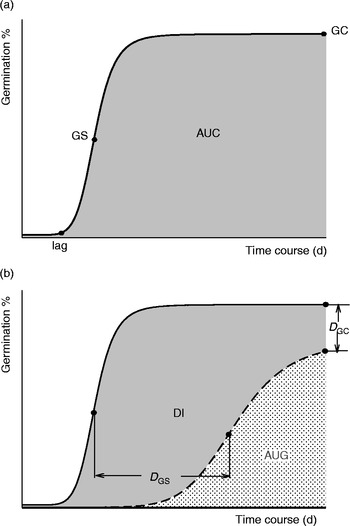
is the initial germination percentage tested immediately after seed release, a is the final germination percentage equivalent to germination capacity (GC), b is a mathematical parameter controlling the shape and steepness of the curve (the larger the b value, the steeper the rise toward a), and c is the time required to achieve 50% germination of the total germinated seeds, which denotes germination speed. We estimated the area under the germination curve (AUC) expressing the germination course, while the area between the non-manipulated and manipulated germination curves was used to quantify the degree of dormancy (dormancy index: DI) (Fig. 2). This mathematical function also allowed the estimation of time at maximum germination rate (TMGR), lag time before germination onset (lag) and the duration between lag and c (D
lag-50). Parameters c, TMGR, D
lag-50 and lag have the same unit (days) and b, c, TMGR and D
lag-50 are means to characterize germination speed (GS). Generally, c and TMGR are very close, but c is more straightforward and more widely used. As such, c is the most typical representation of germination speed and is used henceforth to represent GS. Comprehensively, three core germination terms, namely AUC, GS and GC, were used to characterize germination curves and gauge the timing of germination.
Schematic representation of the cumulative germination curve for parameters used to characterize the timing of seed germinating. AUC: area under the germination curve; DI (dormancy index): the area between germination curves of no treatment and any treatment; D GS: the difference in the germination speed of two treatments, where GS is expressed by the number of days to reach 50% of final germination between manipulated and control environments; D GC: the difference in the germination capacity (GC) or the final germination percentage; and lag: the lag time before germination onset.

Experimental design
A modified approach to testing the evolution of plasticity–resurrection was used, which allows for comparisons among plant genotypes from different environments, stored as seeds, and grown simultaneously under controlled conditions (Franks et al., Reference Franks, Avise, Bradshaw, Conner, Etterson, Mazer, Shaw and Weis2008, Reference Franks, Weber and Aitken2014). A nested-factorial experiment implemented in a completely randomized design was used following the additive linear model:
 $$ y _{ ijkl } = \mu + S _{ i } + C _{ j ( i )} + T _{ k } + ST _{ jk } + TC _{ kj ( i )} + \varepsilon _{ m ( ijk )} $$
where,
 $$\mu $$
is the overall mean,
 $$S _{ i } $$
is the effect of the ith species (i= 1–3, fixed effect),
 $$C _{ j ( i )} $$
is the effect of the jth seed lot nested within species (j= 1–3, random effect),
 $$T _{ k } $$
is the effect of the kth treatment (k= 1–6, fixed effect),
 $$ST _{ jk } $$
is the interaction between ith species and the kth treatment,
 $$TC _{ kj ( i )} $$
is the interaction between jth seed lot within the ith species and the kth treatment, and
 $$\varepsilon _{ m ( ijk )} $$
is the residual term (m= 1–4).
Stratification (moist-chilling) involved exposing the seed to moisture (MC ≈ 100%) under 2°C for 21 d prior to germination (ISTA, 1999), while thermo-priming involved exposing fully soaked seeds to moisture (MC = 100%) and relatively high temperature (15°C and 20°C) in darkness (Liu et al., Reference Liu, Kermode and El-Kassaby2013).
Statistical analyses
Multivariate and univariate analyses of germination timing
To examine how germination timing varied with different species and treatments (manipulated germination environments), the germination parameters were analysed individually (univariate analysis of variance: ANOVA) and collectively (multivariate: MANOVA), with the aid of the generalized linear model (GLM) procedure in SAS® (v. 9.3; SAS Institute Inc., Cary, North Carolina, USA) (Manly, Reference Manly2005; Tabachnick and Fidell, Reference Tabachnick and Fidell2012). A total of 17 out of 360 observations did not converge using the 4-PHF and were excluded from the analyses (El-Kassaby et al., Reference El-Kassaby, Moss, Kolotelo and Stoehr2008). To meet ANOVA and MANOVA assumptions (i.e. normal distribution), the logarithmic transformation was applied to all germination parameters. Statistical significance was set at P< 0.05 and the corrected alpha level for each significance test of ANOVA was 0.00 714 (0.05/7 tests).
Genotype×Environment (G×E) interaction
G × E analyses were conducted using the Additive Main Effect and Multiplicative Interaction (AMMI) (Gauch, Reference Gauch1992) and visualized using the genotype main effect and G × E interactions biplot (GGE biplot) (Yan and Kang, Reference Yan and Kang2003). The original untransformed data were used for this analysis. AMMI is a unified approach that fits the additive main effects of genotypes and environments by the usual analysis of variance and then describes the non-additive parts by principal component analysis (PCA) fitted to the AMMI model as follows:
 $$ Y _{g e } = \mu + \alpha _{ g } + \beta _{ e } + { \sum _{ n = 1}^{ N } }\, \lambda _{ n } Y _{g n } \delta _{ en } + \theta _{ ge } + \in _{ ger } $$
where,
 $$Y _{ ge } $$
is a specific seed lot's germination timing (genotype: g) in environment (non-manipulated or manipulated) e,
 $$\mu $$
is the grand mean,
 $$\alpha _{ g } $$
are the genotype mean deviations (genotype mean minus the grand mean),
 $$\beta _{ e } $$
are the environment mean deviations,
 $$\lambda _{ n } $$
is the eigenvalue of PCA axis n,
 $$Y _{ gn } $$
and
 $$\delta _{ en } $$
are the genotype and environment PCA scores for PCA axis n, N is the number of PCA axes retained in the model,
 $$\theta _{ ge } $$
is the residual, and
 $$\in _{ ger } $$
is the random error (the difference between the
 $$Y _{ ge } $$
mean and the single observation for replicate r).
In the ANOVA of a completely randomized block design for the G × E analysis, the following model was applied:
 $$ Y _{ ijkl } = \mu + G _{ i } + E _{ j } + GE _{ ij } + B _{ jk } + \varepsilon _{ ijk } $$
where, μ is the overall mean,
 $$G _{ j } $$
is the effect of the ith genotype,
 $$E _{ j } $$
is the effect of the jth environment,
 $$GE _{ ij } $$
is the interaction of ith genotype with the jth environment,
 $$B _{ jk } $$
is the effect of the kth replication in the jth environment, and
 $$\varepsilon _{ ijk } $$
is the random error.
To facilitate the interpretation of the AMMI analysis, the GGE biplot approach was applied, using GLM and interactive matrix language (IML) procedures in SAS (Yan, Reference Yan2001; Kang, Reference Kang2003; Yan and Tinker, Reference Yan and Tinker2006), which is constructed by plotting the first principal component scores of genotypes (seed lots) and the environments (non-manipulated or manipulated) against their respective scores for the second principal component. In the biplot, the angles between the environment or genotype vectors proximately correspond to the correlation coefficients among the environments or genotypes. The cosine of the angle between the two vectors approximates the correlation between them, and the length of the vectors is proportional to the standard deviation within respective environments or genotypes. Virtually, an ideal environment has the longest vector of all test environments (most discriminating and informative) and is closely located on the abscissa (most representative); while above-average performance of a genotype in an environment is shown by the angle between its vector and the environment's vector being less than 90°. If an environment line drawn from the graph origin (0, 0) cuts the line between the genotypes at a 90° angle, this indicates that the genotypes would have the same performance of the concerned trait(s) in that environment; alternatively, if an environment line is skewed to one side, this indicates that the closer genotype would give a better performance in that environment. To rank the genotypes as per their performance in an environment, a line is drawn passing through the biplot origin and that environment, and along it is the ranking of the genotypes' performance. The presence of close associations within a single mega-environment represents the same genotype information and could be streamlined to fewer test environments. In summary, the biplot could well reveal the performance of genotypes under different environments, and the most representative environment(s).
Canonical correlation analysis between timing of seed germination and ecological habitats
To test correlations between timing of seed germination and ecological habitats, canonical correlation analysis (CCA) was conducted, which deals with the relationship between two sets of variables or between two pairs of vectors. Parameters gauging ecological habitats (i.e. climate variables) were retrieved from ClimateWNA (see above). Due to the large amount of climate data, principal component analysis (PCA) was performed first, to retain only the most intrinsically correlated climate variables. By using appropriate cut-offs for principal components (PCs), the representative parameters were selected. The threshold for a significant test of canonical correlation is set at P< 0.05. Statistical analyses were conducted using SAS®.
Results
Phenotypic plasticity of timing of seed germination
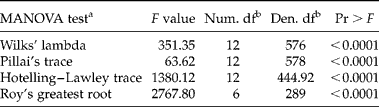
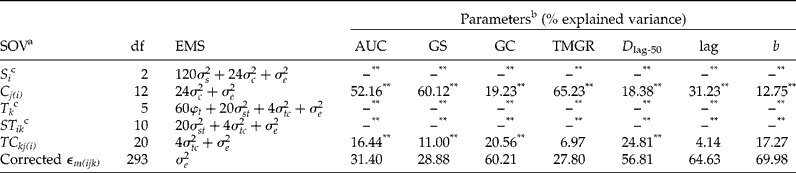
Phenotypic plasticity of seed germination timing was revealed by the multivariate and univariate statistical analyses (Tables 1 and 2). The four multivariate analyses revealed that environmental conditions exerted significant differences on germination timing (Table 1). The univariate analysis supported the multivariate results and all sources of variation (species, seed lots and treatments) were significant across the studied seven germination parameters (Table 2). With the exception of GC and b, species accounted for more than 70% of total variance for the remaining five germination parameters (AUC, GS, TMGR, D lag-50 and lag), suggesting that species have contrasting germination timing, as indicated by their varied responses to the different manipulations (treatments) (Table 2). It should be noted that the two interaction terms (ST and TC) were significant, indicating that species and seed lots within species showed a different response to the treatments applied, hence indicative of phenotypic plasticity (Table 2).
MANOVA for the seven germination parameters
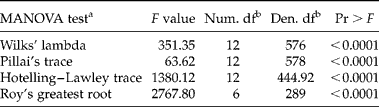
a The null hypothesis for the statistical tests is that the centroids of the seven germination variables are equal across the six environments.
b Num. df and Den. df represent numerator and denominator degrees of freedom, respectively.
Expected mean squares (EMS) and variance components for each germination parameter
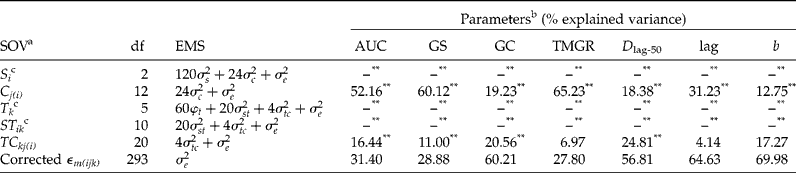
SOV, source of variance.
a S, species; C, seed lot/species; T, treatments; ST, species × treatments interaction; TC, seed lot/species × treatments interaction; ε, residual term.
b See text for explanation of germination parameters.
c S, T and ST: no variance components or percentage of total variation were estimated for the fixed effect.
** P< 0.05.
G×E analysis unravels the phenotypic plasticity of timing of seed germination
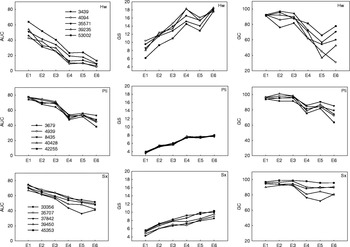
The significant interactions of species and seed lots within species with their corresponding environments were further investigated graphically to illustrate the phenotypic plasticity of timing of seed germination (Fig. 3 and supplementary Fig. S1). Compared with lodgepole pine (AUC: 38.34–77.96; GS: 3.59–8.01 and GC: 63.67–100.00) and ‘interior’ spruce (AUC: 36.19–74.64; GS: 4.23–10.31 and GC: 72.16–99.06), western hemlock (AUC: 5.00–63.79; GS: 6.16–18.51 and GC: 31.05–97.00) showed greater plasticity as quantified by the differences between the highest and lowest responses across germination environments (Fig. 3). Furthermore, compared with the non-manipulated environment (E6 in Fig. 3), thermo-priming at 15°C (E5) was detrimental to GC in western hemlock (seedlots 3439, 35 571, 39 235 and 53 002) and ‘interior’ spruce (seed lot 37 842); however, both AUC and GS showed corresponding improvement. This is presumably attributable to supra-optimal high temperature that gives rise to thermo-inhibition (Toh et al., Reference Toh, Imamura, Watanabe, Nakabayashi, Okamoto, Jikumaru, Hanada, Aso, Ishiyama, Tamura, Iuchi, Kobayashi, Yamaguchi, Kamiya, Nambara and Kawakami2008).
G × E interaction involving five seed sources for each of three conifer species – western hemlock (Hw), lodgepole pine (Pli) and ‘interior’ spruce (Sx) – and six manipulated environments (E1–E6, see text for description) measured by three germination parameters – area under the germination curve (AUC), germination speed (GS) and germination capacity (GC).

In pursuit of further analysis of the G × E interactions, the AMMI analysis of variance was performed, showing that the variations in germination parameters can be well explained by the data (R 2= 0.985, 0.878 and 0.992 for AUC, GS and GC, respectively) and that differences between genotypes (i.e. seed lots) accounted for a large portion of the total variation in SS (67, 60 and 31% for GC, AUC and GS, respectively) (Table 3). Moreover, the environment (treatments) captured between 25 and 37% of the total variation, leaving a small portion of the variation in the G × E interaction (3, 6 and 22% for AUC, GC and GS, respectively), indicating that G × E greatly influenced germination speed (GS). The sources of variation of replications in their environments and residual accounted for only 1.0, 0.8 and 12.2% for AUC, GC and GS, respectively, supporting the model's goodness of fit.
AMMI analysis of variance for timing of seed germination in three conifer species
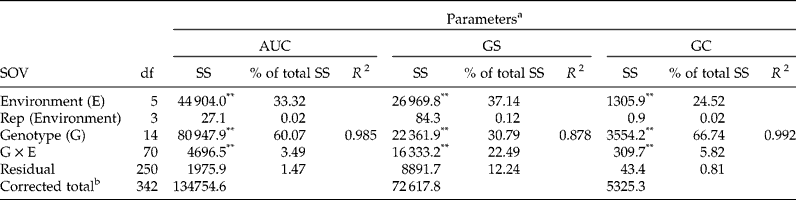
SOV, source of variance; SS, sum of squares.
a AUC, area under the germination curve; GS, germination speed; and GC, germination capacity.
b Due to 17 of a total 360 observations being meaningless using our method to converge.
** P< 0.05.
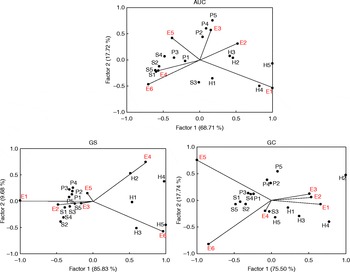
The GGE biplot of the AMMI analysis showed that Factor 1 (PC1) was dominantly more important than Factor 2 (PC2) for seed lot evaluation, as indicated by the 68.7 versus 17.7, 85.8 versus 9.6 and 75.5 versus 17.7% GGE variation explained by the two axes for AUC, GS and GC, respectively (Fig. 4). As such, the biplot explained 86.4, 95.5 and 93.2% of the total variation relative to genotype (i.e. seed lots) plus G × E for AUC, GS and GC, respectively, and thus the goodness of fit of the biplots was quite good across the three main germination parameters. Figure 4 also suggested that the manipulated environments could be partitioned into two clusters or mega-environments corresponding to E1, E2 and E3 (all include stratification) and E4, E5 and E6 (do not include stratification) based on the wide obtuse angles (i.e. strong negative correlation), implying a strong crossover effect (i.e. genotypes changed ranking from environment to environment). E1 (stratification + thermo-priming at 20°C) and E6 (non-manipulation) were the most discriminative as well as representative environments in their respective clusters (Fig. 4). The five genotypes of western hemlock had better AUC and GC performance (or improvement) than those of lodgepole pine and ‘interior’ spruce in E1, and GS in E6. By contrast, lodgepole pine and ‘interior’ spruce were superior to western hemlock in GS in E1 (Fig. 4). The genotype performance was intertwined among the three species in terms of AUC and GS in E6, and lodgepole pine and ‘interior’ spruce genotypes had similar performance in both E1 and E6 (Fig. 4).
The genotype main effect and G × E interactions (GGE) biplot for environment-centred analysis of timing of seed germination of three conifer species measured by three germination parameters (area under germination curve, AUC; germination speed, GS; and germination capacity, GC) (data not transformed). H1–H5, P1–P5 and S1–S5 represent five seed lots for western hemlock, lodgepole pine and ‘interior’ spruce, respectively.

When different genotypes show similar seedling emergence under the same manipulated germination environment, this is indicative of phenotypic plasticity of timing of seed germination. Based on the results of the GGE biplot (Fig. 4), different genotypes occupied the same position and this is attributable to phenotypic plasticity of timing of seed germination, genotypes and their interactions with germination environments. It is interesting to note that interior and coastal seed lots contributed dissimilarly to germination timing. Although different species were represented by seed lots originated from the same ecosystem zone (i.e. similar habitat) [33 356 (spruce), 4939 (pine) and 53 002 (hemlock); 35 707 (spruce) and 39 235 (hemlock); and 45 353 (spruce) and 35 571 (hemlock)], they produced contrasting germination timing behaviour (Table S1 and Fig. 1), indicating that species account for major differences, as supported by their high percentage of total germination variation (Table 2). These indicate that genetics plays an important role in phenotypic plasticity of germination timing, which is in line with the findings of Fernández-Pascual et al. (Reference Fernández-Pascual, Jiménez-Alfaro, Caujapé-Castells, Jaén-Molina and Díaz2013), and their genetic effects on the phenotypic plasticity between interior and coastal species were more pronounced than those within interior or coastal species. It is noteworthy to mention that western hemlock seed lots were sampled from its coastal and interior ranges (diversity of habitat) while lodgepole pine and ‘interior’ spruce were sampled from their respective predictable habitat.
Heat sums during seed maturation correlated with timing of seed germination
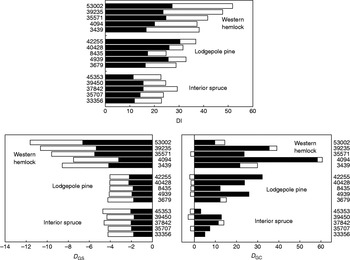
We selected three environments for subsequent analysis, E1 and E6 as representative of the two most discriminative environments (see above) and E3 (stratification) as it is the standard treatment for conifer seed utilization (ISTA, 1999) (Fig. 4). Dormancy index (DI) comparison among the studied three species indicated that ‘interior’ spruce benefited the least from stratification (Fig. 5, black column: difference between stratification and non-manipulated environments). However, the combined effect of stratification followed by thermo-priming at 20°C (black + white columns) was favourable for western hemlock, as it exhibited the greatest increase across its five seed lots, while lodgepole pine and ‘interior’ spruce displayed a similar increase that is not as substantial as that observed for western hemlock (Fig. 5). Difference of germination speed (D GS) mirrored DI results (Fig. 5), suggesting that temperature was a pivotal germination cue for western hemlock; however, thermo-priming was of little beneficial effect, though not detrimental, in heightening germination capacity (D GC) (Fig. 5).
Dormancy index (DI), difference of germination speed (D GS) and difference of germination capacity (D GC) of the 15 seed lots of the three studied species. Black columns represent the difference between non-manipulated (control) and stratification environments, and the entire horizontal column (black plus white) represents the difference between stratification followed by thermo-priming at 20°C and non-manipulated environments; and the white columns represent the improvement or decline observed after stratification followed by thermo-priming at 20°C. Data represent the average of four replicates of each environment.

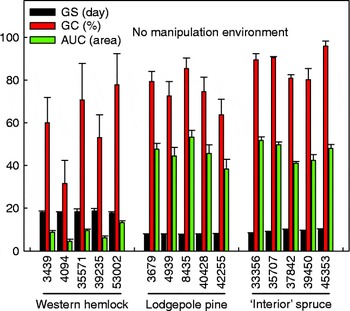
Overall, western hemlock had substantially lower AUC [8.43 ± 0.86 versus 45.84 ± 3.74 (lodgepole pine) and 46.55 ± 1.67 (‘interior’ spruce)] and GC [58.60 ± 17.85 versus 75.05 ± 6.13 (lodgepole pine) and 87.35 ± 2.55 (‘interior’ spruce)]; however, this trend was reversed for GS [18.13 ± 0.87 versus 7.84 ± 0.15 (lodgepole pine) and 9.45 ± 0.19 (‘interior’ spruce)], indicating poor but faster germination under the non-manipulated environment (Fig. 6).
Germination parameters (AUC, GS and GC) profiling for non-manipulated environment (control) across 15 western hemlock, lodgepole pine and ‘interior’ spruce seed lots. AUC, area under the germination curve; GS, germination speed; GC, germination capacity.

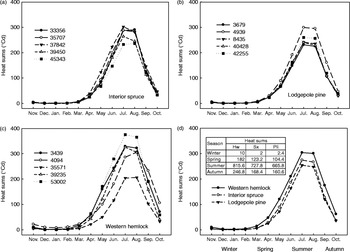
Since temperature was the main factor used to manipulate the germination environment, we estimated each seed lot's native environment heat sums (Fig. 7). Generally, heat sums of western hemlock were higher than ‘interior’ spruce followed by lodgepole pine, reflecting its habitat (low elevation) (Fig. 7d). This record was positively associated with the increment of DI and D GS when seeds were manipulated with thermo-priming after stratification (Fig. 5 and Fig. 7). Judging by individual seed lots, 53 002 and 35 571 had the highest and lowest heat sums in western hemlock, respectively, which corresponded to the highest and lowest increment in terms of DI and D GS when seeds underwent thermo-priming after stratification (Fig. 5 and Fig. 7). Lodgepole pine and ‘interior’ spruce had similar heat sums across seed lots, among which seed lot 37 842 had the highest heat sums from April to July (data not shown) and correspondingly had the highest increment of DI and D GS when seeds were given thermo-priming after stratification (Fig. 5 and Fig. 7).
Monthly cumulative heat sums for seed lots of ‘interior’ spruce (a), lodgepole pine (b) and western hemlock (c), and for the three species (d).

Timing of seed germination strongly correlated with habitat ecology during life-history transition
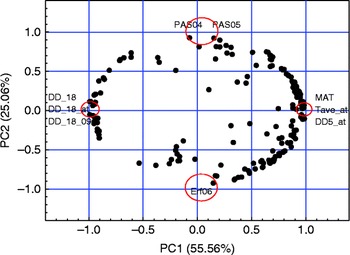
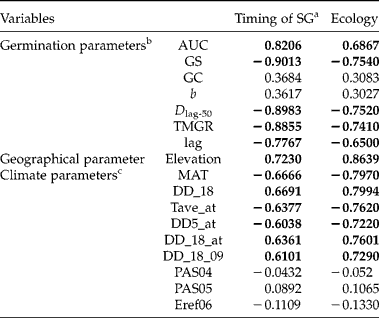
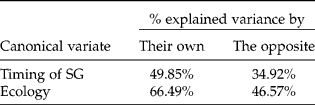
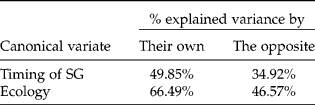
Since patterns of timing of seed germination were associated with heat sums during seed development, correlation analysis of germination timing and respective ecological habitat was performed. First, a PCA on 193 climatic variables showed that PC1 and PC2 accounted for 56 and 25% of the total variations, respectively, and were temperature- and precipitation-related components, respectively (Fig. 8). Using cut off ± 0.98 and ± 0.80 for PC1 and PC2, respectively, nine variables were selected; namely, MAT, DD_18, Tave_at, DD5_at, DD_18_at, DD_18_09, PAS04, PAS05 and Eref06 (see Table 4 for explanation of variables). In the canonical correlation analysis (CCA), only one (CCA1) out of the total of seven canonical variates was significant across all tests (not shown). The loadings and cross-loadings indicated that five out of seven variables regarding timing of seed germination (SG), namely AUC, GS, Dlag-50, TMGR and lag, were strongly correlated with their own canonical variates (i.e. timing of SG, >0.80 or < − 0.80) as well as with the opposite canonical variates (i.e. Ecology, >0.65 or < − 0.65) (Table 4). Likewise, the geographical variable (i.e. elevation) and all temperature-related variables were strongly or moderately correlated with their own canonical variates (i.e. Ecology, >0.70 or < − 0.70) and the opposite canonical variates (i.e. timing of SG, >0.60 or < − 0.60), respectively (Table 4). However, all the precipitation-related variables were neither correlated with their own canonical variates nor with the opposite canonical variates (range: − 0.2 to 0.2) (Table 4). Based on covariate matrices for the ‘timing of SG’ canonical variate, 49.85 and 34.92% of variance were explained by the canonical variates for the same group of variables and for the opposite group of variables, respectively; for the ‘Ecology’ canonical variate, 66.49 and 46.57% of variance were explained by the canonical variates for the same group of variables and for the opposite group of variables, respectively (Table 5). This suggested that timing of seed germination was strongly correlated with their habitat ecology.
Correlation circle of PCA based on climatic data estimated by ClimateWNA. Parameters in red circles represent emblematically the variables selected for canonical correlation analysis. See Table 4 for the full names of the abbreviated climate parameters.

Canonical correlation analysis between individual variables with their own and with the opposite set of variables
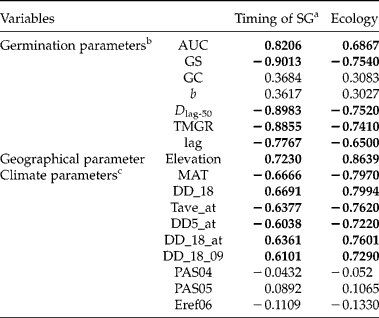
a Timing of SG denotes timing of seed germination.
b See text for the description each germination parameter.
c Climate parameters abbreviations: MAT, mean annual temperature (°C); DD_18, degree-days below 18°C (heating degree-days); Tave-at, autumn (Sep.–Nov.) mean temperature (°C); DD5_at, autumn degree-days above 5°C; DD_18_at, autumn degree-days below 18°C; DD_18_09, September degree-days below 18°C; PAS04, April precipitation as snow; PAS05, May precipitation as snow; and Eref06, June Hargreaves reference evaporation.
Percentage of variance explained by the canonical variates for the same group of variables and for the opposite group of variables
Discussion
All evolutionary change involves changes in development (Stearns and Hoekstra, Reference Stearns and Hoekstra2000), and development is intrinsically plastic such that the whole life process is possible (Behera and Nanjundiah, Reference Behera and Nanjundiah1995). Unlike other variables, timing is directional and completely asymmetrical: early events can influence later ones but not vice versa. Therefore, studying the timing of seed germination in combination with seed development is of apparent importance (Finch-Savage and Leubner-Metzger, Reference Finch-Savage and Leubner-Metzger2006; Bewley et al., Reference Bewley, Bradford, Hilhorst and Nonogaki2012). In the present study, we demonstrated a strong correlation between the timing of seed germination and seed developmental environment, particularly temperature-based climatic variables, such as heat sums. We also elucidated the phenotypic plasticity of timing of seed germination in five manipulated germination environments using two representative environmental regimes [i.e. non-manipulated (control) and manipulated through 21-d stratification at 2°C followed by 3-d thermo-priming at 20°C], gauged by three representative parameters (i.e. AUC, GS and GC). We therefore reinforced that the timing of seed germination is correlated with temperature-based environmental conditions during seed development, though affected by the phenotypic plasticity during seedling emergence.
Recent years have seen mounting interest in studying heritability and phenotypic plasticity with respect to the evolution of life-history traits, including seed dormancy (Schlichting and Pigliucci, Reference Schlichting and Pigliucci1998; Pigliucci and Murren, Reference Pigliucci and Murren2003; West-Eberhard, Reference West-Eberhard2003; de Jong, Reference de Jong2005). As early as the 1940s, Waddington proposed that an environmentally stimulated phenotype (i.e. plasticity) could eventually become converted into a fixed response to prevalent environmental conditions (assimilation) through continued selection (Waddington, Reference Waddington1942), which is currently termed ‘genetic assimilation’ (Pigliucci and Murren, Reference Pigliucci and Murren2003). Most organisms have evolved a certain degree of phenotypic plasticity of a variety of traits, which can lower the deleterious effects of novel environments, so that they exhibit greater stability with respect to components of fitness over a broad range of environments, and thus promote survival (West-Eberhard, Reference West-Eberhard2003; Bell, Reference Bell2008), as demonstrated in the classical study of Clausen and Hiesey (Reference Clausen and Hiesey1960) on Achillea. A history of phenotypic plasticity could increase the rate of adaptation in a new environment; however, the magnitude of this change hinges on the strength of selection in the original environment (Fierst, Reference Fierst2011).
Global and regional fluctuations in climate and ecology could produce a prolonged, though intermittent, evolutionary trend in an intermittently expressed correlated set of traits (West-Eberhard, Reference West-Eberhard2003). As a result, environmental fluctuations preclude optimal adaptation to any single environment (Meyers and Bull, Reference Meyers and Bull2002) and plastic genotype-by-environment interactions may result in a release of heritable variation in a novel environment (Hermisson and Wagner, Reference Hermisson and Wagner2004; Fierst, Reference Fierst2011), and may ultimately shape the response to selection in the new environment (Price et al., Reference Price, Qvarnstrom and Irwin2003). Empirical studies revealed a variety of mechanisms to cope with ecological uncertainties (Meyers and Bull, Reference Meyers and Bull2002). Bet-hedging, first proposed by Cohen (Reference Cohen1966) favoured a non-genetic probabilistic germination strategy. It explains delayed germination of seeds of an annual plant in a variable environment and, with seeds that germinate stochastically, a parent plant can be ‘assured’ that at least some of its progeny will survive (Bulmer, Reference Bulmer1994). Moreover, Bull (Reference Bull1987) raised the hypothesis that early germination is risky to survival, differentially among years, but early viable germinators have much higher fecundity than late germinators. Epigenetic regulation is thought to be evolutionarily useful for responding to fluctuating environments over a relatively short span (e.g. on the order of a single life cycle) (Jablonka and Lamb, Reference Jablonka and Lamb1998), and the dynamics of epigenetic regulation during phase transitions in yellow cedar (Cupressus nootkatensis) and Arabidopsis have been described (Müller et al., Reference Müller, Bouyer, Schnittger and Kermode2012). Possibly, epigenetic mechanisms underlie bet-hedging in the timing of seed germination.
Notwithstanding the importance of phenotypic plasticity and bet-hedging strategies in the face of variable and sometimes unpredictable conditions, many traits remain remarkably stable, which is termed ‘robustness’ (Waddington, Reference Waddington1957). The advantage of robustness is that it allows the individual to develop fundamental traits, independent of fluctuations in the environment (Debat and David, Reference Debat and David2001). Such robustness is based on the theory of canalization; i.e. the property of a developmental process, of being to some extent modifiable, but to some extent resistant to modification (Waddington, Reference Waddington1942, Reference Waddington1961). However, hidden genetic variance could be released due to a major mutation or environmental stress, regardless of whether the genotype is canalized or not (Hermisson and Wagner, Reference Hermisson and Wagner2004).
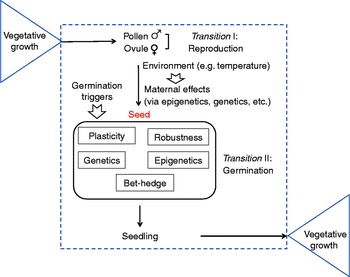
Taken together, we have summarized possible strategies involved in the transitions of a plant's life cycle (Fig. 9). After fertilization, seeds begin plant-to-seed transition. During the seed developmental phase, factors in the seeds' developmental environment, such as temperature, play a crucial role, as they can affect the imprinting or memory of gene expression via genetic and epigenetic mechanisms and determine subsequent life-history traits. In the seed-to-plant transition, seeds can germinate in response to appropriate germination triggers by executing the previously memorized mechanisms. Besides, other strategies, including phenotypic plasticity, bet-hedging and robustness, are also involved in this transition.
A proposed model explaining regulations via molecular mechanisms and environmental cues during transitions of a plant's life cycle.

Global warming deteriorates climatic influences on forest disturbances by altering the frequency, intensity, duration and timing of insect and pathogen outbreaks, exotic species, fire and drought (Dale et al., Reference Dale, Joyce, McNulty, Neilson, Ayres, Flannigan, Hanson, Irland, Lugo, Peterson, Simberloff, Swanson, Stocks and Wotton2001). Shifts in annual timing of life-history events are a common response of populations to climate change (Forrest and Miller-Rushing, Reference Forrest and Miller-Rushing2010; Visser et al., Reference Visser, Caro, van Oers, Schaper and Helm2010). The relative importance of temperature regulation of dormancy cycles is anticipated to increase profoundly with current climate change, and phenotypic plasticity is a primary means by which plants cope with global change scenarios (Matesanz et al., Reference Matesanz, Gianoli and Valladares2010; Nicotra et al., Reference Nicotra, Atkin, Bonser, Davidson, Finnegan, Mathesius, Poot, Purugganan, Richards, Valladares and van Kleunen2010). In the context of global climate change, trees could migrate, through seed and pollen dispersal, to more suitable habitats, and thus maintain their ‘bioclimatic envelopes’ (Kremer et al., Reference Kremer, Ronce, Robledo-Arnuncio, Guillaume, Bohrer, Nathan, Bridle, Gomulkiewicz, Klein, Ritland, Kuparinen, Gerber and Schueler2012). However, a single pollen grain only carries half the number of alleles compared with a seed, and only seeds can establish a new population in new habitat. On the other hand, documented wind-driven effective seed dispersal of forest trees is only confined to a few kilometres (around two orders of magnitude shorter than effective pollen dispersal) (Kremer et al., Reference Kremer, Ronce, Robledo-Arnuncio, Guillaume, Bohrer, Nathan, Bridle, Gomulkiewicz, Klein, Ritland, Kuparinen, Gerber and Schueler2012). Consequently, sessile and long-lived organisms, such as trees, are likely to confront climate change in their original habitats, and this challenge cannot be met by genetic changes (Bradshaw, Reference Bradshaw1965). Furthermore, genetic variation in germination phenology is clinal, associated with a climate gradient characterized by increasing temperature in summer and rainfall in winter (Montesinos-Navarro et al., Reference Montesinos-Navarro, Picó and Tonsor2012). With shortening of winter and increasing length of the growing season (Robeson, Reference Robeson2004; Schwartz et al., Reference Schwartz, Ahas and Aasa2006), seeds may remain partially dormant in spring and need an extended time to germinate. Depending on whether cold stratification is minimally met or exceeded at present, shorter winters may delay or advance germination, respectively (Walck et al., Reference Walck, Baskin and Baskin1997). In North America, the number of chilling days has remained sufficient for dormancy decay north of 40°N (BC latitude:north of 54°N) resulting in an advanced green-up with earlier springs (Zhang et al., Reference Zhang, Tarpley and Sullivan2007). This indicates that although seeds in their natural habitats remain ungerminated until spring, early spring warm-up accelerates germination, as shortened winters do not affect dormancy decay. Predictably, unimodal heat sum curves, as in Fig. 7, will shift to the left (i.e. reaching peaks earlier) and their shoulders will be wider, due to milder temperature in the future, and thus dormancy will tend to increase owing to the positive correlation of climatic variables (i.e. milder winter in the future) and dormancy variations we have explored. In addition, variation in the geographic distribution, climate conditions, habitat preferences and life cycle of species can affect the favourable period of seedling establishment (Vranckx and Vandelook, Reference Vranckx and Vandelook2012; Carta et al., Reference Carta, Probert, Moretti, Peruzzi and Bedini2014). Current warming in the north has proven to improve tree survival and growth, and increase sexual reproduction, pollen production and mature filled-seed production in disparate parts of the species' range (Rehfeldt et al., Reference Rehfeldt, Tchebakova, Parfenova, Wykoff, Kuzmina and Milyutin2002; Reich and Oleksyn, Reference Reich and Oleksyn2008; Alberto et al., Reference Alberto, Aitken, Alía, González-Martínez, Hänninen, Kremer, Lefèvre, Lenormand, Yeaman, Whetten and Savolainen2013). Investigation of phenological effects on ecosystem productivity across temperate forest types and between spring and autumn seasons also shows that an extended growing season can increase net productivity despite increased carbon loss at high temperatures (Richardson et al., Reference Richardson, Black, Ciais, Delbart, Friedl, Gobron, Hollinger, Kutsch, Longdoz, Luyssaert, Migliavacca, Montagnani, Munger, Moors, Piao, Rebmann, Reichstein, Saigusa, Tomelleri, Vargas and Varlagin2010). Taken together, the changing climate in the north will probably result in improved germination, growth and establishment.
The timing of germination and its evolution in the field involve many environmental and genetic facets, including complex environment cues. Our study highlighted that although the phenotypic plasticity influences timing of seed germination under manipulated germination conditions, seed germination timing remains highly associated with temperature-based environments during seed development in conifers. This study provided insight into the germination niche as the vulnerability of seed germination timing to seed developmental environments, and made possible the prediction of timing of seed germination based on the current climate change.
Supplementary material
To view supplementary material for this article, please visit http://dx.doi.org/10.1017/S0960258514000361
Acknowledgements
We are grateful to J. Crossa, G. Alvarado and J. Burgueño at CIMMYT (Centro Internacional de Mejoramiento de Maiz y Trigo) for generous help with AMMI and GGE analysis, to M. Dettlaff for seed counting, and to T.L. Wang for visualizing seed lot sites on the ClimateWNA map.
Financial support
This work was supported by the Johnson's Family Forest Biotechnology Endowment, the British Columbia Forest Investment Account Forest Genetics Conservation and Management Program, and the National Science and Engineering Research Council of Canada Discovery and Industrial Research Chair to Y.A.E.
Conflicts of interest
None.