I. INTRODUCTION
The outstanding properties of silicon carbide (SiC), such as wide band gap, excellent corrosion, and oxidation resistance, make it attractive as substrate material for electronic and optoelectronic semiconductor devicesReference Devaty and Choyke1–Reference Lin, Chen, Yang, Liu, Ba and Yang8 and also push it to the frontiers of science due to its potential for diluted magnetic semiconductors applications.Reference Pearton, Park, Abernathy, Overberg, Thaler, Kim, Ren, Zavada and Wilson9–Reference Lin, Chen, Liang, Jiang and Xie11 Owing to the scientists’ painstaking working all over the world, SiC bulk crystals have been successfully grown by modified Lely method (sublimation method) since this method was proposed first time in 1978.Reference Tairov and Tsvekov12 But how to improve the resistivity of high purity crystals still remains a key issue for the large diameter SiC bulk crystals. Generally, high purity high resistivity SiC crystals can be obtained in a growth system with a high vacuum background and a high purity sublimation source at high temperature. However, it is still hard to prepare high resistivity SiC crystals due to the limit of intrinsic growth system vacuum and system obturation extent and the normally existing impurity nitrogen adsorbed in the graphite crucible. This is not only a challenge for mechanical fabrication of growth system but also for vacuum equipments, such as mechanical pump and so on. Meanwhile, purity of the source materials also affects the quality of SiC crystals. Therefore, the growth process for satisfying the above-mentioned conditions and reducing nitrogen in the growth system should be maintained and improved.
In Ref. Reference Fanton, Li, Polyakov, Skowronski, Cavalero and Ray13, the authors suggested that the hydrogen should be added to the growth atmosphere to grow high purity SiC single crystals, which effectively reduced the nitrogen incorporation. But this technique may be costing and lightly risky. On the other hand, Ying et al.Reference Yang, Lin and Chen14 had reported the effect of growth gas flow rate on the defects density of SiC single crystals. But the effect of growth gas flow rate on the crystal resistivity was not reported recently. The results about the different gas flow rates on the crystal resistivity were presented in this paper for the first time. Several experiments were carried out, by adjusting the growth gas flow rate, to improve the resistivity of SiC crystals, which would be helpful to prepare high purity high resistivity SiC crystals. Then, a possible reason for explaining the obtained phenomena is put forward.
II. EXPERIMENTAL
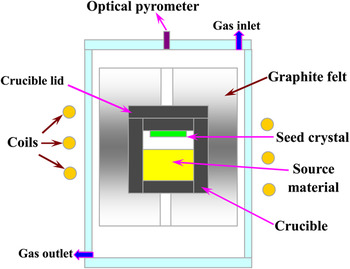
6H–SiC crystals were grown in an inductively heated sublimation growth reactor. The monitored growth temperature was 2100 °C in all growth runs as recorded by using an optical pyrometer above the crucible lid. Figure 1 shows the schematic representation of a sublimation growth system with crucible configuration. High purity argon (99.96%) was used as ambient gas and emitted into the growth chamber closed to the top of crucible. Due to the porous property of the graphite crucible, the injected protective gas might go through the crucible and mix with the growth gas species. The injected argon gas flow rate was controlled by a mass flow meter. To keep the growth pressure stable at ∼5 kPa, the frequency of the mechanical pump was moderately adjusted according to the needed argon gas flow rate. The gas flow rate inside the growth crucible is lower than that of outside. It should be noted that the main growth parameters, such as temperature and reactor pressure, were kept constant, but the flow rate of growth gas argon was adjustable during different growth runs. Namely, growth gas flow rate is in the range of 30–800 sccm (sccm means standard-state cubic centimeter per minute). Several SiC crystals, grown at different protective gas flow rates, were cut into slices perpendicularly to the growth direction using a single-wire diamond saw (WXD170). These transverse cuts were characterized by EC-80 type contactless resistance measurement machine (EC-80 type measurement system is based on an eddy current principle) and wafer mapping system, respectively. Meanwhile, x-ray photoelectron spectroscopy (XPS) was applied to these samples for qualitatively analyzing the content of the impurities, e.g., nitrogen, boron, etc. All the understudied samples were washed by RCA (Radio Corporation of America) cleaning process.
Schematic representation of a sublimation growth system with crucible configuration.

III. RESULTS AND DISCUSSION
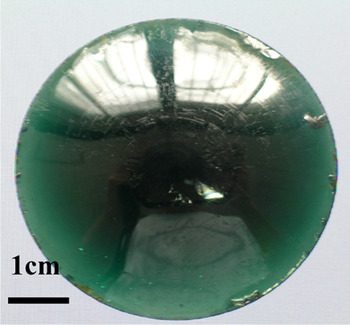
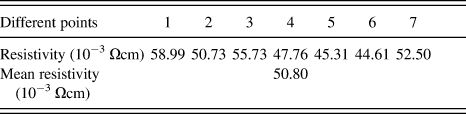
Figure 2 shows a SiC crystal growth front obtained at a growth gas flow rate of 30–40 sccm. One wafer of this SiC crystal was characterized by EC-80 type contactless resistance measurement machine. Resistivities of different areas on this wafer were shown in Table I.
SiC crystal growth fronts obtained at a gas flow rate of 30–40 sccm.

Resistivities of different areas on the wafer.
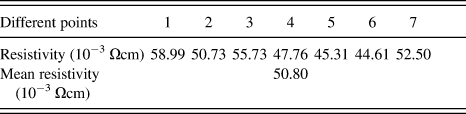
In Table I, it can be seen that the magnitude of the mean resistivity is only up to 10−2Ωcm. Meanwhile, this wafer possesses n-type conductivity, which was measured by hot and cold probes method (one probe is heated to needed temperature to offer enough current through the testing loop). It implies that the main impurity existing in SiC crystals, obtained in nominally undoped growth system under low growth gas flow rate, is nitrogen.
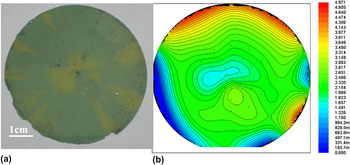
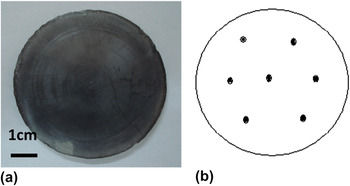
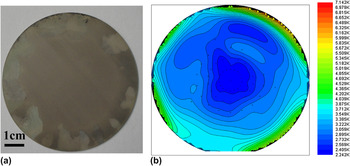
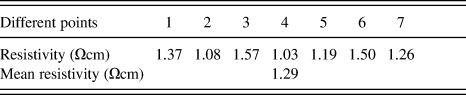
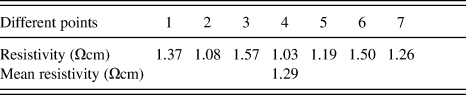
To reduce the content of nitrogen impurity in the crystal, the growth gas flow rate is increased to 200, 400, and 800 sccm, respectively. Figure 3 is the image of a wafer grown at a gas flow rate of 200 sccm and its corresponding sheet resistance mapping. Its test reports are listed in Table II. Figures 4 and 5 are the photos of unintentionally doped SiC wafers grown at a gas flow rate of 400 and 800 sccm, respectively. Their corresponding test reports are shown in Tables III and IV, respectively. It should be noted that the wafer shown in Fig. 4 was sliced from an ingot close to the seed crystal, which seemed opaque due to some graphite sticking to the backside.
(a) Transverse cut of a crystal obtained at a gas flow rate of 200 sccm and (b) corresponding sheet resistance mapping.

(a) Image of a SiC wafer obtained at a growth gas flow rate of 400 sccm and (b) testing points.

(a) Transverse cut of a crystal obtained at a gas flow rate of 800 sccm and (b) corresponding sheet resistance mapping.

Results measured by contactless sheet resistance measurement machine.

Resistivities of different areas on the wafer.
Test reports obtained by contactless sheet resistance measurement machine.

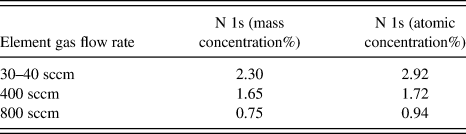
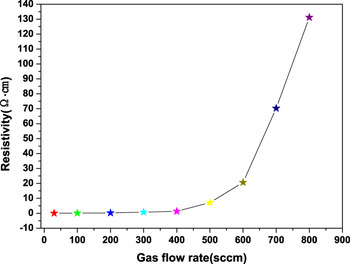
From the above-mentioned testing results, it can be seen that the mean resistivity of these wafers is 0.1, 1.29, and 128.5 Ωcm, respectively, at a gas flow rate of 200, 400, and 800 sccm. The corresponding XPS testing results are shown in Table V. The content of nitrogen in these crystals is declining with increasing gas flow rate in the range of 30–800 sccm. In other word, high gas flow rate will reduce the main impurity nitrogen incorporation into crystal lattice.
The content of N in the crystals obtained at different gas flow rates.
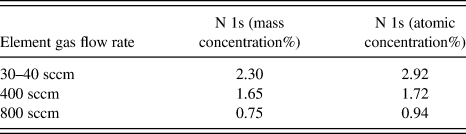
Figure 6 shows the resistivity of unintentionally doped SiC crystals varies with gas flow rate in the range of 30–800 sccm. It can be seen that crystal resistivity will get higher and higher with increasing growth gas flow rate under certain growth conditions. Of course, crystal growth rate should be large enough to prepare thick ingot so that it could be cut into several slices. But if the growth gas flow rate is too high (>2000 sccm), the crystal growth rate will be decreased considerably due to the Si component losing during the crystal growth process and hence reduces crystal ingot length within a certain growth run.
Effect of growth gas flow rate on crystal resistivity.

A possible and natural reason for improving crystal resistivity by increasing growth gas flow rate is that higher argon gas flow rate can purge off atmospheric nitrogen at some extent. So, the higher growth gas flow rate is the lower crystal resistivity is in the n-type conductive crystal. But this explanation may only be suitable for the nominally undoped SiC crystals grown at a low gas flow rate, not for the high gas flow rate.
In SiC crystals grown by physical vapor transport, the absolute nitrogen concentration and the amount of its variation along the growth axis are determined by the changes in the effective C/Si ratio via the well-known site competition effect.Reference Larkin, Neudeck, Powell and Matus15 Meanwhile, it is revealing that the impurity atoms have lower formation energies on a carbon site than on a silicon site in 4H–SiC for nitrogen, oxygen, and sulfur regardless of the crystal growth conditions.Reference Miyata, Higashiguchi and Hayafuji16 Therefore, nitrogen substitutes on a carbon site more easily than a silicon site.
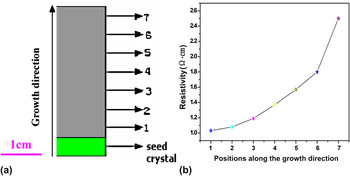
At the initial growth stage, the growth atmosphere is Si-rich. As growth proceeding, the ambient becomes more C-rich, which suppresses nitrogen incorporating into the C sites.Reference Li, Polyakov, Skowronski, Sanchez, Loboda, Fanton, Bogart and Gamble17 This phenomenon can be proved by our experiment. Figure 7 is the schematic illustration of a longitudinal slice grown by nominally undoped technique at a constant gas flow rate. We can find that resistivity of this sample is increasing as the testing point distancing from the seed crystal, which indicates that the nitrogen concentration becomes lower as the growth progresses. Namely, the C-rich ambient suppresses nitrogen incorporation into carbon site.
Schematic illustration of a longitudinal slice (a) testing points and (b) corresponding resistivity.

In the present work, nitrogen in the growth system is suppressed by the protective gas argon at a low gas flow rate (≤800 sccm). Therefore, we can image that the gas flow rate becomes higher, the higher resistivity the crystals get. As the gas flow rate gets higher (∼800 sccm), the mass of the growth chamber (including crucible and reaction source) will get lighter after a single growth run. It can be considered that Si component in the gas species may go through the graphite crucible due to its porosity. It also indicates that the growth atmosphere becomes more C-rich at the initial stage when comparing with a low gas flow rate mode. This initial ambient more easily suppresses nitrogen incorporation into carbon site. Therefore, a higher resistivity SiC crystal can be grown at a higher gas flow rate. On the other hand, the gas flow rate should not be too high to avoid Si component losing too much and hence prepare long enough SiC ingots. Generally, higher gas flow rate mode for increasing resistivity is very helpful to grow high purity high resistivity SiC ingots.
IV. CONCLUSIONS
Due to the limit of intrinsic growth system vacuum and system closed extent, it is difficult to prepare high purity high resistivity SiC substrate; a technique of controlling gas flow rate for decreasing the nitrogen impurity in the SiC crystal was presented. The experimental results showed that high growth gas flow rate could affect SiC crystal resistivity remarkably. And the SiC crystal resistivity would get higher and higher with increasing growth gas flow rate. This is caused by the nitrogen impurity content decreasing with the increase of gas flow rate. This phenomenon can be explained by the well-known site competition effect. We conclude that Si component in the gas species may more easily go through the graphite crucible at the initial stage to make the growth ambient C-rich when the gas flow rate is higher than 800 sccm and hence suppress nitrogen incorporation into carbon site to increase crystal resistivity. This result is very helpful to grow high purity high resistivity SiC ingots.
ACKNOWLEDGMENT
This work is financially supported by the National Natural Science Foundation of China (Grant No. 51177134) and the Xi’an Applied Materials Innovation Fund (Grant No. XA-AM-201013).