I. INTRODUCTION
The determination of amorphous content by powder X-ray diffraction (XRD) is an increasingly important requirement of the technique with the advent of nanotechnology and the growing application of the method for the characterisation of non-traditional materials such as pharmaceuticals (Hancock and Zografi, Reference Hancock and Zografi1997; Bates et al., Reference Bates, Zografi, Engers, Morris, Crowley and Newman2006). Other areas where knowledge of the amorphous content of materials is desirable include the cement industry (Whitfield and Mitchell, Reference Whitfield and Mitchell2003; Walenta and Füllmann, Reference Walenta and Füllmann2004) and environmental mineralogy (Hudson-Edwards, Reference Hudson-Edwards2003; Jamieson, Reference Jamieson2011). The distinction between crystalline, fine grained, and amorphous states is blurry, and the potential for amorphous content in samples that may previously have been considered crystalline is now recognised.
The measurement of amorphous content in mixtures of phases with severe absorption contrast is highly complex and frequently trivialised by simplistic application of methods that are unsuitable to the task at hand. Methods such as FULLPAT use standard libraries to address this complexity but are reliant on the existence of suitable, pure, standard materials that are not always easily obtained (Chipera and Bish, Reference Chipera and Bish2002). By far the most popular method of quantitative phase analysis (QPA) using X-ray powder diffraction is the Rietveld method (Rietveld, Reference Rietveld1969; Hill and Howard, Reference Hill and Howard1987; Bish and Howard, Reference Bish and Howard1988; Madsen et al., Reference Madsen, Scarlett, Cranswick and Lwin2001; Scarlett et al., Reference Scarlett, Madsen, Cranswick, Lwin, Groleau, Stephenson, Aylmore and Agron-Olshina2002). This method returns relative phase abundances of the predominantly crystalline phases included in the overall model. The issue of amorphous content must be addressed by subsequent calculation based on parameters determined in the Rietveld refinement or by the development of a suitable model of the amorphous phase that may be included in the refinement.
The study reported here considers four and five phase mixtures where the component phases have been chosen in order to produce a significant microabsorption problem. A range of methods for determination of amorphous concentration have been applied based on traditional laboratory XRD data. It follows on from previous work by the authors, which conducted a similar study under more ideal sample conditions (Madsen et al., Reference Madsen, Scarlett and Kern2011). That study examined the basic modes of action of each of the methods and compared their accuracy. A similar approach has been taken here but with the intention of highlighting the limitations of the techniques for use with more difficult samples.
II. EXPERIMENTAL
A. Samples and data collection
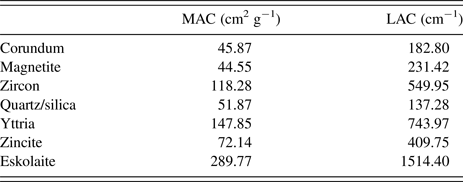
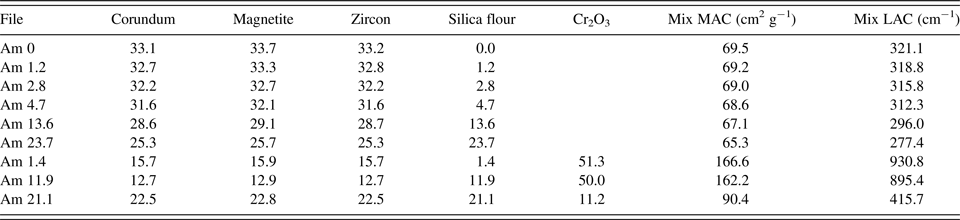
The sample suite consisted of mixtures of four or five phases selected with the intention of creating strong microabsorption. The basic sample comprised corundum (α-Al2O3), magnetite (Fe3O4), and zircon (ZrSiO4). It was prepared from the same materials as those used for sample 4 from the IUCr powder diffraction round robin on QPA (Scarlett et al., Reference Scarlett, Madsen, Cranswick, Lwin, Groleau, Stephenson, Aylmore and Agron-Olshina2002). The corundum was commercially available Baikalox Alumina Polishing Powder, standard C, 1.0 µm and was estimated to be ~99% crystalline. Despite the fine grain size of the powder for polishing purposes, its actual particle size was determined by laser sizing (Malvern Mastersizer) to be of the order of 28 µm. The magnetite and zircon were natural materials with approximate particle sizes of 36.2 and 21.1 µm, respectively. The purity of these minerals had been established by XRF in the course of sample preparation for the QPA round robin. The samples were hand mixed then micronised in ethanol in a McCrone Microniser (3.5–4 g sample, 4 min g−1), centrifuged to allow removal of the ethanol and dried at 60 °C. This was followed by gentle hand mixing in a mortar and pestle in order to break up any agglomerates and to ensure homogeneity. Various amounts of amorphous silica flour (Ajax precipitated silica, particle size ~30.4 µm) were added to these samples by hand mixing in a mortar and pestle. A fourth crystalline phase, eskolaite (Cr2O3) was included in three of the samples to further increase the microabsorption effect. This material is part of the NIST Standard Reference Material set 674a and has a particle size distribution centred at around 1 µm with a maximum size of 5 µm. The mass and linear absorption coefficients (LACs) of the individual phases are given in Table I and the phase proportions and absorption coefficients of the mixtures in Table II for CoKα radiation.
Mass (MAC) and linear absorption coefficients (LAC) of the sample components.

Phase proportions (%) and absorption coefficients (Co Kα) of the mixtures.

Several standard materials were also used for instrument calibration and as calibration standards for the various amorphous determination methods. These were high purity quartz (acid washed sand, SiO2) micronised for 5 min g−1; yttria (Aldrich Y2O3, calcined at 1200 °C for 16 days), corundum (Al2O3 supplied for the 2015 international round robin for XRD analysis of iron ore materials), and zincite (BDH Analar ZnO).
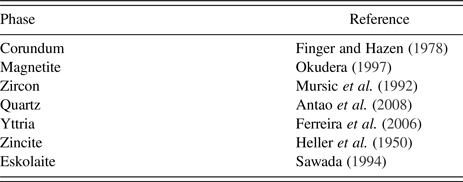
The samples were back pressed into PANalytical holders for flat plate presentation. During data collection, they were rotated at 60 rpm to improve particle statistics. Diffraction data were collected from 5 to 140° 2θ using a PANalytical MPD instrument fitted with a cobalt long-fine-focus X-ray tube operated at 40 kV and 40 mA. The incident beam path was defined using 0.04 radian Soller slits, and a 0.5° fixed divergence slit. The diffracted beam path incorporated a 4.6 mm anti-scatter slit and a graphite monochromator. The monochromator was included in order to eliminate unwanted wavelengths that would increase the background of the pattern via fluorescence, whilst avoiding the artefacts associated with use of a β-filter. An X'Celerator detector was used in scanning line (1D) mode with an active length of 2.122° 2θ. Data were collected with a nominal step size of 0.03° 2θ (~4 h per scan). QPA was carried out via the Rietveld method (Rietveld, Reference Rietveld1969; Hill and Howard, Reference Hill and Howard1987) using the software, TOPAS V5 (Bruker AXS, 2013). The references to the crystal structure models used for these analyses are given in Table III.
Crystal structure references.

B. Data analysis
Determination of amorphous content using the Rietveld method depends on normalising the measured relative proportions of the crystalline phases, including a model for the amorphous phase directly or partitioning the modelled intensity into crystalline and amorphous components. Normalising the relative proportions is based on the measurement of either an internal or external standard (Klug and Alexander, Reference Klug and Alexander1974; O'Connor and Raven, Reference O'Connor and Raven1988). A model for the amorphous phase may be developed, calibrated, and included using the Partial or No Known Crystal Structure (PONKCS) method (Scarlett and Madsen, Reference Scarlett and Madsen2006) and apportioning of the intensity into crystalline and amorphous components (Riello, Reference Riello, Mittemeijer and Scardi2004) is now implemented directly in software packages such as TOPAS as a measure of the “degree of crystallinity” (DoC).
Each sample in this suite was modelled using the crystal structures given in Table III and one of the three different models for the amorphous component. The most restrictive of the amorphous models was the PONKCS phase described below. The peak positions, shapes, and intensities derived for that were then used as the starting points for two other peaks models. One of these constrained the shape parameters to those refined for the PONKCS model but allowed peak positions and intensities to refine. The other allowed all peak parameters to refine independently. The last model is a commonly used approach for unknown samples where amorphous features are apparent in the background of a pattern but there is no means of determining their origin.
Assessment of the accuracy of each determination has been made on the basis of either the bias (measured – weighed) or the relative bias (bias/weighed).
1. Internal standard method
The internal standard method is the most commonly used method for amorphous determination via XRD (Scarlett et al., Reference Scarlett, Madsen, Cranswick, Lwin, Groleau, Stephenson, Aylmore and Agron-Olshina2002). It involves adding a known amount of a standard material of known composition to an unknown sample. The relative proportions of the phase mix are determined during the Rietveld refinement according to the algorithm of (Hill and Howard, Reference Hill and Howard1987) given in Eq. (1) where W α , the measured weight per cent of phase α; S α , the Rietveld scale factor for phase α; S j , the Rietveld scale factor for phase j; ZM, the mass of the unit cell contents; V, the volume of the unit cell; and n, the number of phases in the analysis.
 $$W_\alpha =100 \times \displaystyle{{S_\alpha ({\rm ZMV})_\alpha} \over {\mathop \sum \nolimits_{\,j = 1}^n S_j ({\rm ZMV})_j}}. $$
These may then be normalised to the “correct” or “absolute” values by scaling them according to the measured value of the standard as shown in Eq. (2) where Corr(W α ), the corrected weight per cent; STDknown, the weighed concentration of the standard in the sample; and STDmeasured, the analysed concentration derived from Eq. (1).
 $${\rm Corr}(W_\alpha ) = W_\alpha \displaystyle{{{\rm STD}_{{\rm known}}} \over {{\rm STD}_{{\rm measured}}}}. $$
The amount of amorphous material (W amorphous) can then be found by difference [Eq. (3)]
 $$W_{{\rm amorphous}} = 100 - \mathop \sum \limits_{\,j = 1}^n {\rm Corr(}W_j {\rm )}{\rm.} $$
In the samples considered here, each crystalline phase has been considered to be an “internal standard” for the purpose of an individual amorphous determination. This has allowed the comparison of internal standards of varying mass absorption coefficients (MACs) within identical refinements.
2. External standard method
The external standard method is similar to the internal in that it relies on scaling the measured weight percentages and calculating the amorphous content by difference. In this case though the scaling factor, or calibration constant (K), is determined by the separate measurement of an external standard under identical instrument conditions to the unknown sample (O'Connor and Raven, Reference O'Connor and Raven1988). The value of K is dependent on the instrumental and data collection conditions. Its derivation takes into consideration the MAC of the standard (and subsequently that of the unknown samples) and is shown in Eq. (4) where μ* m, the MAC of the entire sample, and K, the calibration constant used to scale the relative phase proportions.
 $$K = \displaystyle{{S_\alpha ({\rm ZMV})_\alpha \mu _{\rm m}^*} \over {W_\alpha}}. $$
Equation (4) can be rearranged and applied to the individual phases of the unknown samples to obtain “absolute” values of W α . It should be noted that this scaling factor applies to the sample as a whole and the relative proportions of the phases remain the same as those calculated directly by the Rietveld method.
Several different external standards have been considered here: corundum, yttria, zincite, and amorphous silica flour in order to cover a range of absorption contrasts between standards and samples.
3. DoC method
The DoC method is applied via Rietveld analysis but does not need the use of crystal structures or calibration constants. It relies on the partitioning of the pattern intensity into crystalline or non-crystalline components. If crystal structures are used, their area is ascribed to the crystalline proportion of the sample. Individual peaks included in the model may be assigned to either the crystalline or amorphous fraction. The DoC is determined as the ratio of the crystalline area to the total area measured [Eq. (5)]. The amorphous content is then once again obtained by difference between this value and 100%.
 $${\rm DOC} =100 \times \displaystyle{{{\rm Crystalline}\;{\rm area}} \over {{\rm Crystalline\;} \;{\rm area + amorphous\;} \;{\rm area}}}.$$
4. PONKCS method
The PONKCS method differs from the other methods in that it is based around the development of a phase model for the amorphous component, which may then be included in the overall Rietveld model and quantified along with the crystal structure models. A model of this nature that must be generated empirically from peak fitting lacks the constants related to the volume of the unit cell (V) and the mass of its contents (ZM). It is reliant upon having a sample that contains a known amount of the amorphous or unknown phase in sufficient quantity for the derivation of these constants (ZMVamorph). A peaks model is refined to fit the amorphous component in this sample and then constrained such that it may be scaled as a whole with a single refinable parameter equivalent to the Rietveld scale factor. This sample is mixed in a known proportion with a standard material and the constant “ZMVamorph” derived via Eq. (6) where W amorph and W STD are the known weight percentages of the amorphous and standard phases; S amorph and S STD are the refined scale factors of the amorphous and standard phases.
 $$({\rm ZMV})_{{\rm amorph}} = \displaystyle{{W_{{\rm amorph}}} \over {W_{{\rm STD}}}} \displaystyle{{S_{{\rm STD}}} \over {S_{{\rm amorph}}}} ({\rm ZMV})_{{\rm STD}}. $$
The PONKCS phase used here was developed by modelling the pure silica flour with ten Pseudo-Voigt peaks constrained to have the same width and shape parameters (Figure 1). Note that a simple two-parameter Chebyshev polynomial background function was used to minimise correlation between the background and the broad peaks of the amorphous silica. This silica model was then constrained to the refined values of peak position, shape, and relative intensity and given a single scale factor. It was then used in the analysis of a known mixture containing 55.0 wt% quartz and 45.0 wt% silica. The refined scale factors from this analysis were used accordingly to determine ZMVamorph according to Eq. (6). The final value used for this study was based on the measurement of three replicates of the quartz–silica mixture.
(Colour online) Output from peak fitting of the silica flour showing the component peaks of the PONKCS model.

III. RESULTS AND DISCUSSION
In order to assess the accuracy of amorphous determination in samples suffering from microabsorption, it is necessary to define the issue clearly. Microabsorption is the greatest obstacle to accurate QPA via XRD. It is frequently ignored in routine analysis although its impact is well known. The only commonly used correction is the Brindley method (Brindley, Reference Brindley1945), which has been shown to be inappropriate for most powder samples. It is, however, widely applied with no physical meaning and no means of assessing its effect.
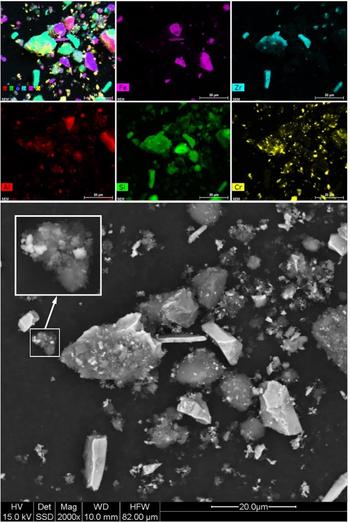
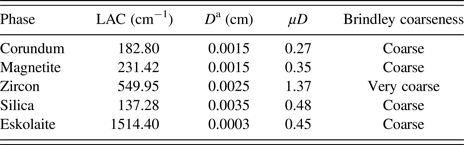
Figure 2 shows a backscattered electron image of Am 21.1 and the corresponding elemental maps showing the distribution of the phases. It can be clearly seen that despite micronizing and subsequent mixing, there is still a broad range of particle sizes including some very large grains. Note that particle sizing via a more direct approach such as Malvern laser sizing was not possible here given the volume of the samples and the variable agglomeration that occurs during mixing and which affects the interaction of the sample with the X-ray beam. The Brindley method assumes that all particles in a particular phase are of a uniform size which is clearly unrealistic. It also grades powders according to the product of their LAC and their diameter in cm (μD). Powders where μD < 0.01 are considered fine with negligible absorption, 0.01 < μD < 0.1 are medium, 0.1 < μD < 1 are coarse, and μD > 1 very coarse. The method is described as being suitable for medium powders and possibly of some benefit for coarse powders at the lower end of the range. Table IV shows a very approximate grading of the powders used here.
(Colour online) Backscattered electron image (bottom) of sample Am 21.1 along with WDS maps showing its elemental distribution.

Determination of approximate coarseness of individual phase components.

a D is an approximation of the largest dimension visible in Figure 2.
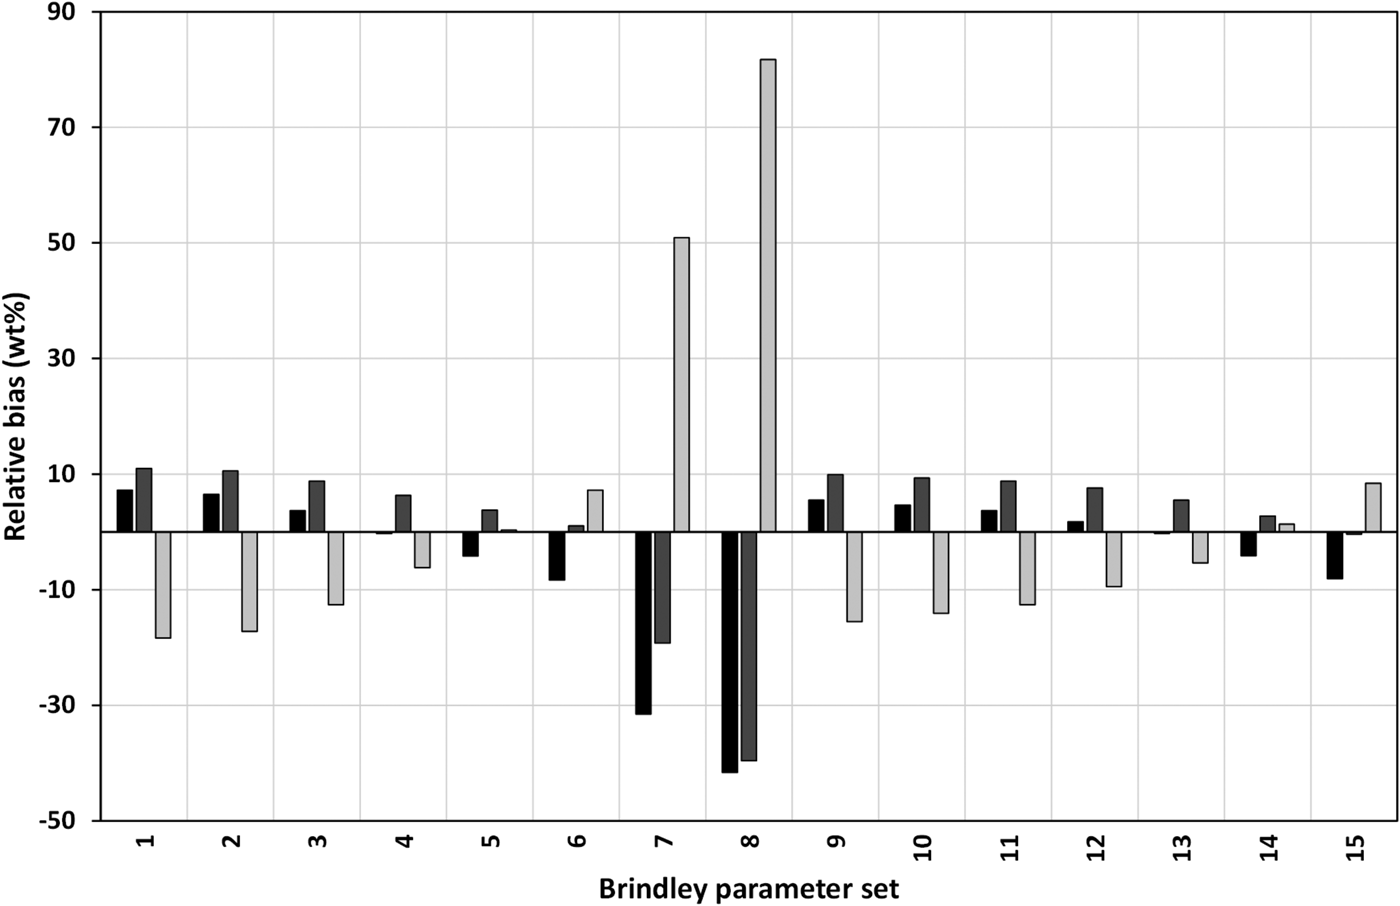
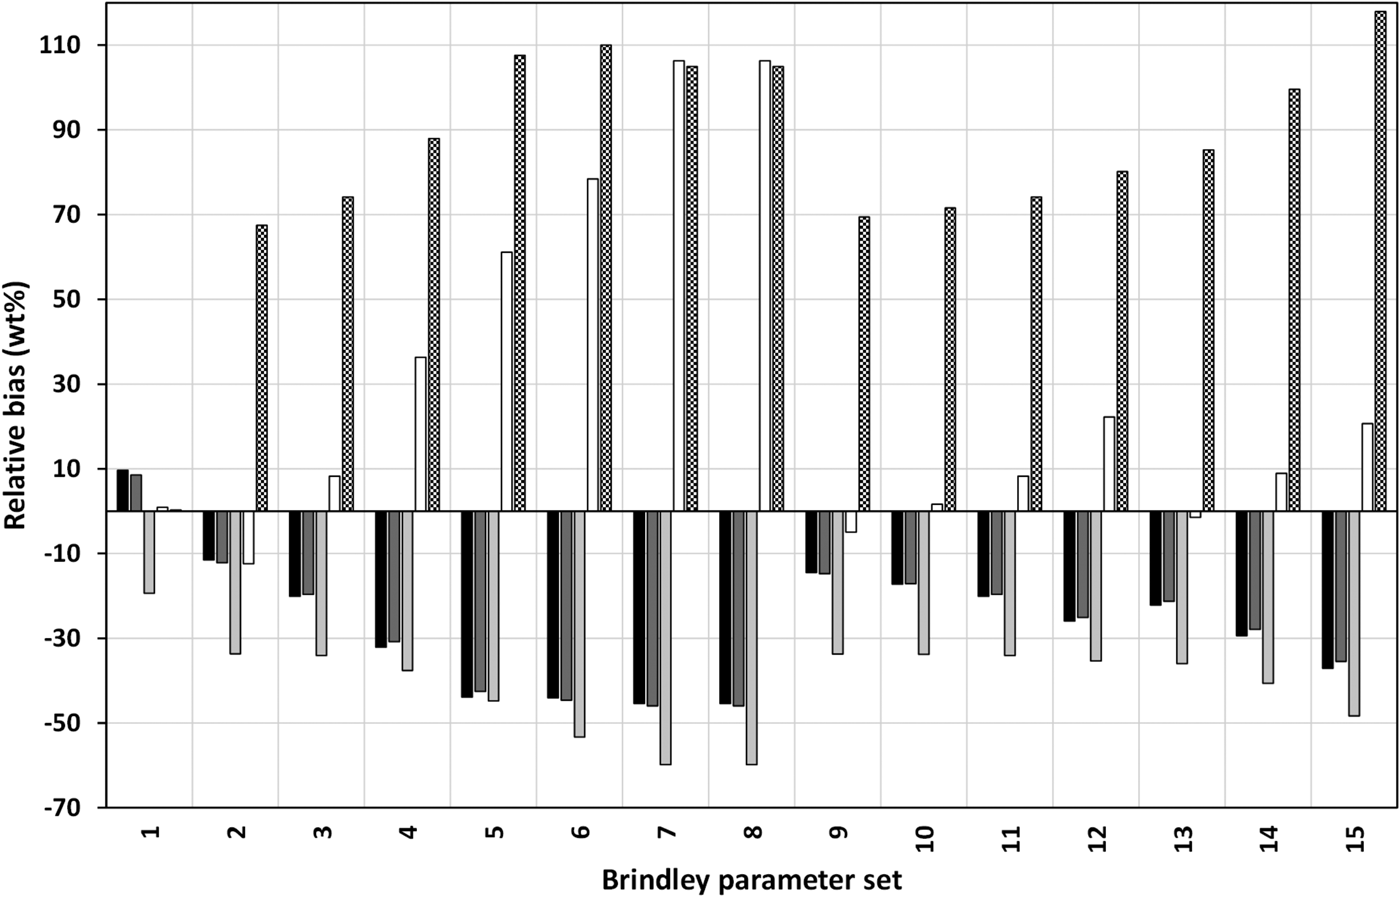
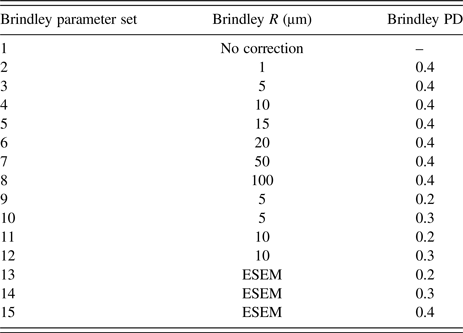
The Brindley correction has been investigated as part of this study using samples Am 0 and Am 21.1. The correction requires input of the particle diameter for each phase and a packing density of the powder. Several combinations of parameters were considered (Table V). Figure 3 shows the results of QPA of Am 0 using various combinations of Brindley parameters. Parameter sets 3 and 4 have improved the QPA, but there is no physical basis for their selection. Using values based on the particle sizes from the ESEM image made the analysis considerably worse than with no correction at all. Figure 4 shows comparable results for QPA of Am 21.1. This is a more complex sample and all the parameter sets tried have worsened the QPA from using no correction at all. This demonstrates the risk associated with the application of this correction method to unknown samples.
Relative bias of QPA of Am 0 with different combinations of particle diameters and packing densities (numbered as per Table V). Black = corundum, dark grey = magnetite, light grey = zircon.

Relative bias of QPA of Am 21.1 with different combinations of particle diameters and packing densities (numbered as per Table V). Black = corundum, dark grey = magnetite, light grey = zircon, white = eskolaite, diamond pattern = silica measured via PONKCS.

Brindley parameters.

A. Internal standard method
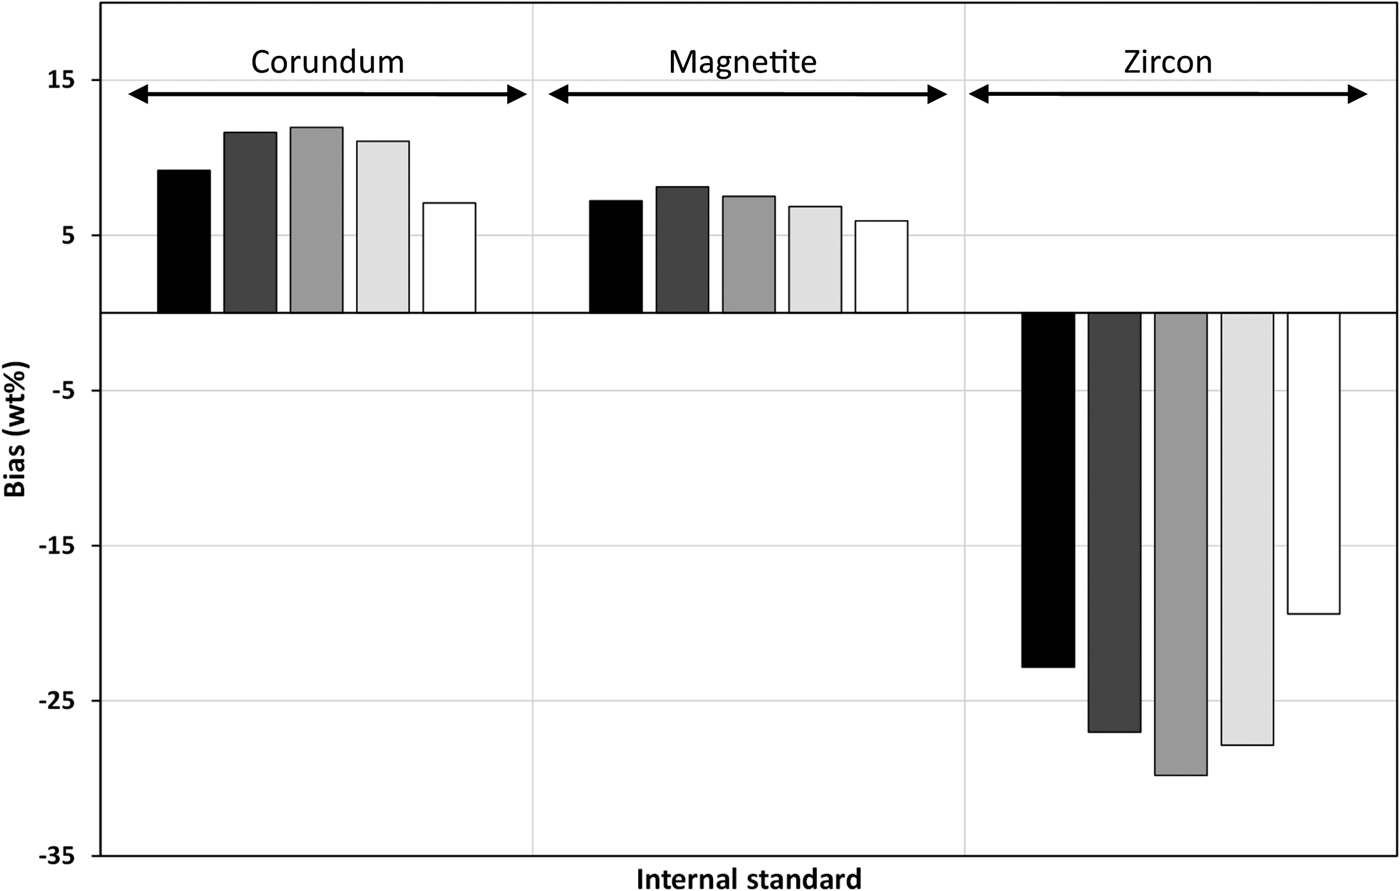
The internal standard method was found to be highly problematic in this environment as its calibration constant is based on a measured value that is incorrect because of microabsorption as well as the presence of amorphous material. Amorphous content determined this way was grossly dependent upon μD. Figure 5 shows the bias of the amorphous content measured using the internal standard method for each of the three “standards”. There is little difference in the measurements between the use of PONKCS, fixed shape, or independent peak models for the amorphous components so only results from the PONKCS model have been shown for clarity.
Bias of amorphous determination via the internal standard method shown for the three internal “standards” using the restrictive PONKCS model for silica (black = Am 1.2, dark grey = Am 2.8, mid-grey = Am 4.7, light grey = 13.6, white = Am 23.7).

Corundum and magnetite have similar values of μD and have overestimated the amorphous content by similar amounts when used as internal standards. Zircon has a much higher μD and has underestimated the amorphous content severely, actually returning negative values.
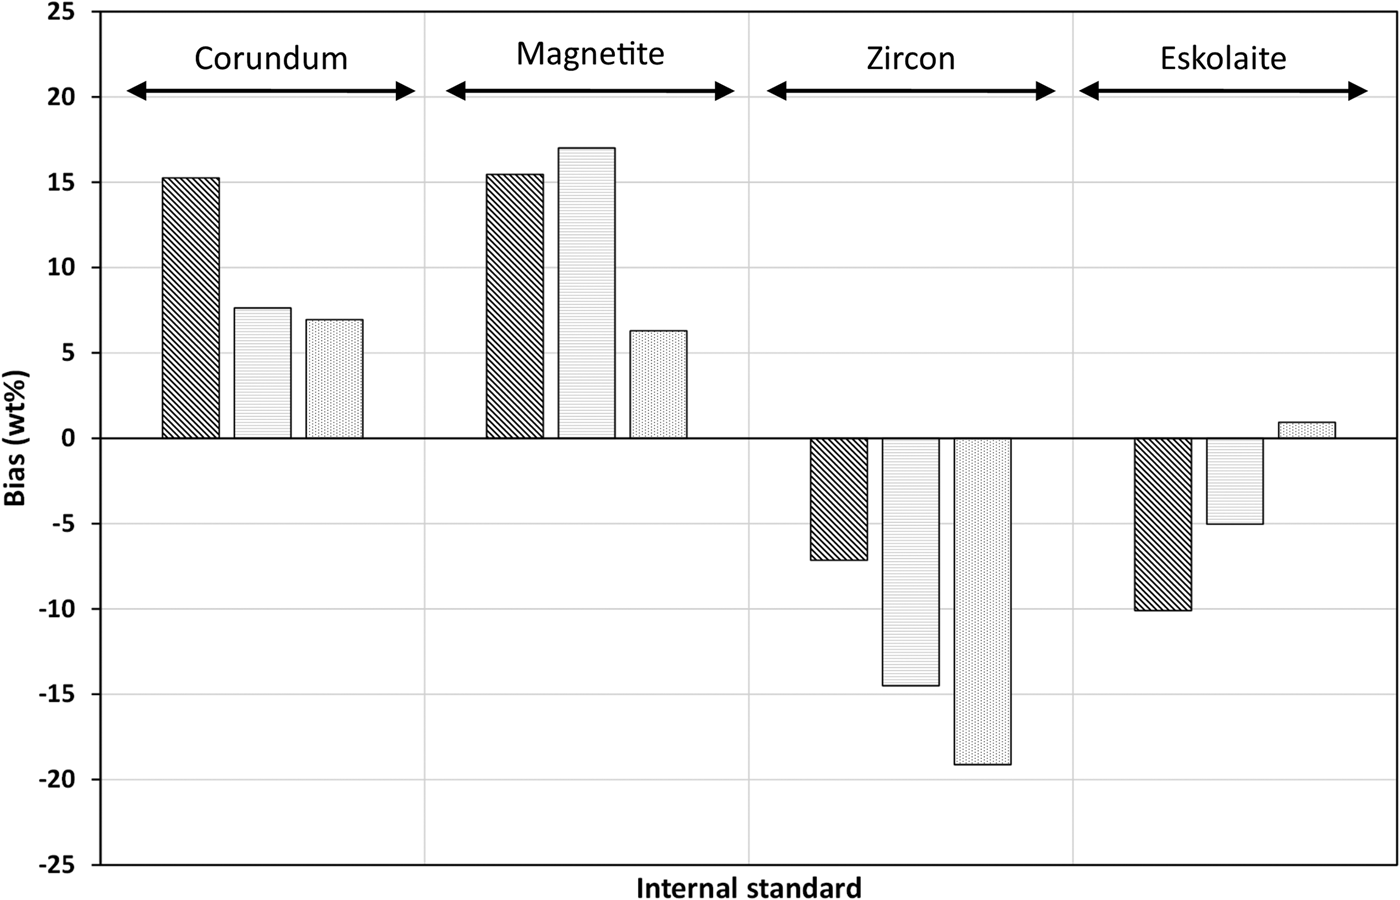
The addition of eskolaite to the mixture introduces a phase that is much more highly absorbing than zircon. However, its particle size is very fine giving a μD of 0.45 which is much less than that of zircon (1.37), therefore reducing the impact of microabsorption on its QPA. Consequently, it gives a better amorphous determination than zircon although it is still inaccurate (Figure 6). This emphasises the importance of considering μD rather than MAC alone.
Bias of amorphous determination via the internal standard method shown for the four internal “standards” using the restrictive PONKCS model for silica (diagonal stripes = Am 1.4, horizontal stripes = Am 11.9, dots = Am 21.1).

B. External standard method
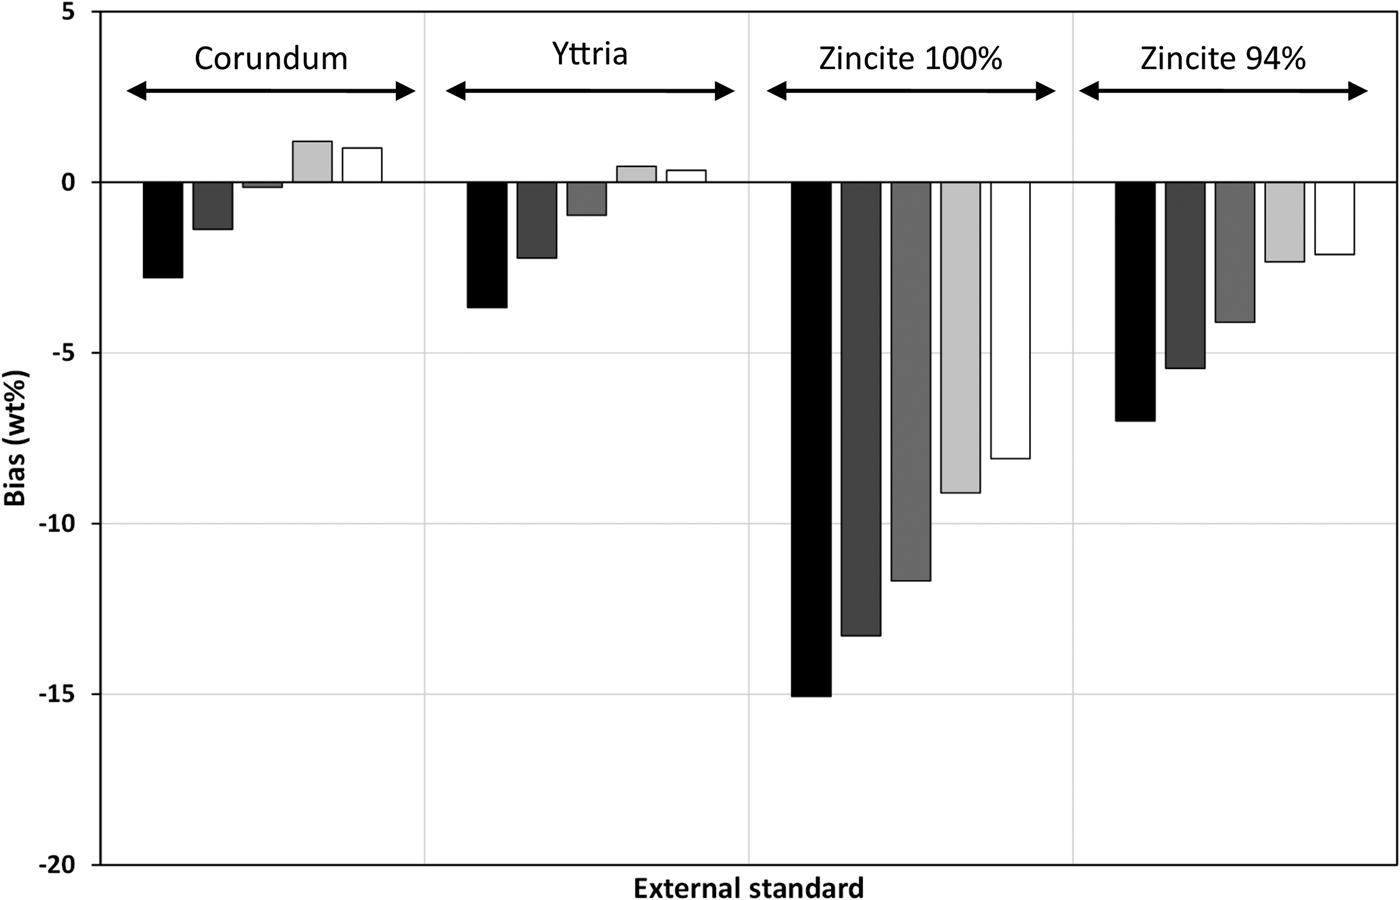
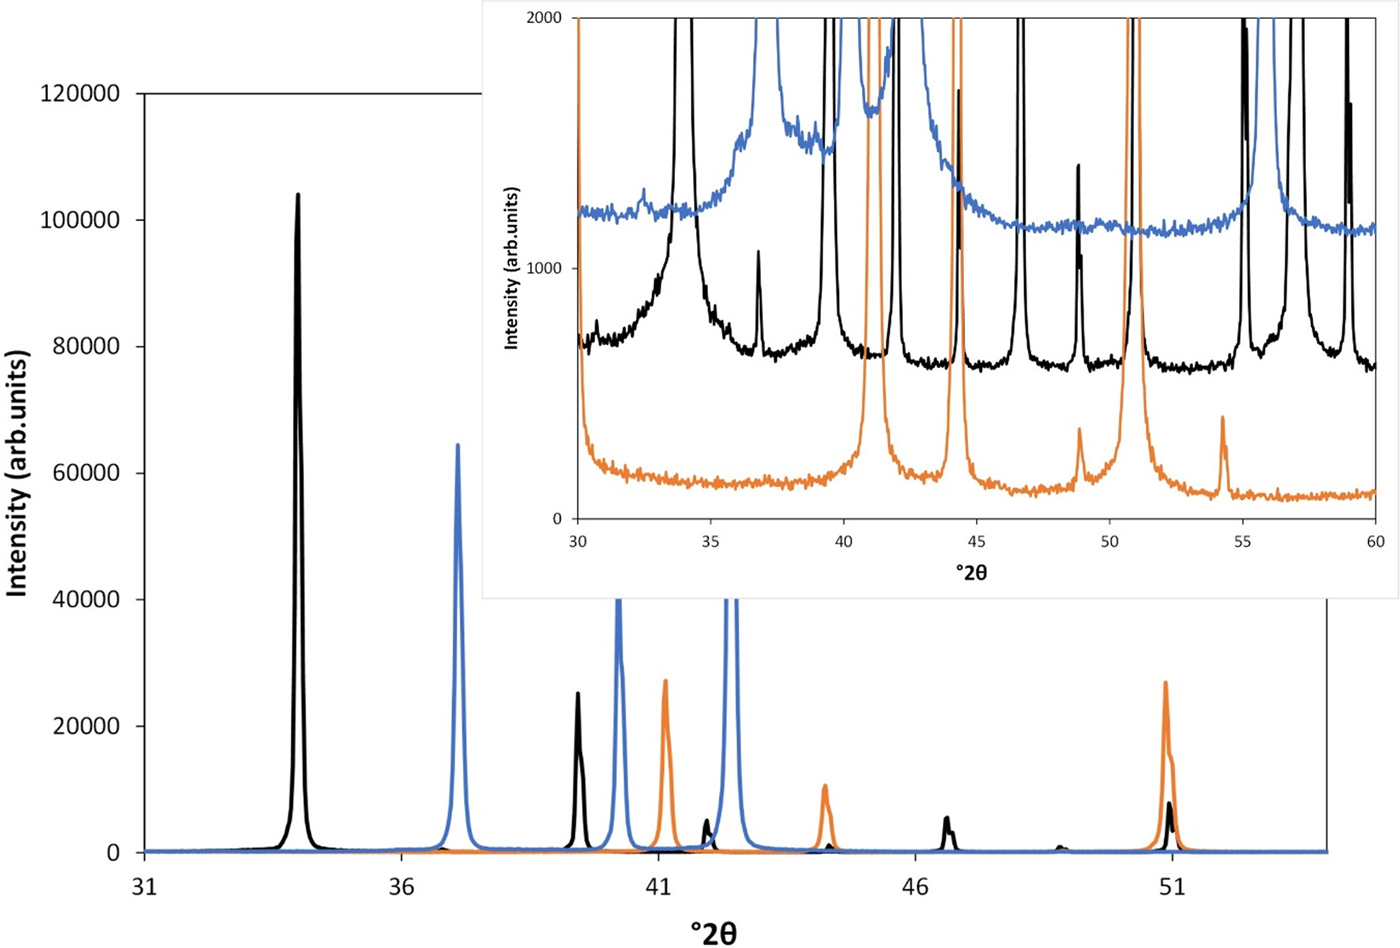
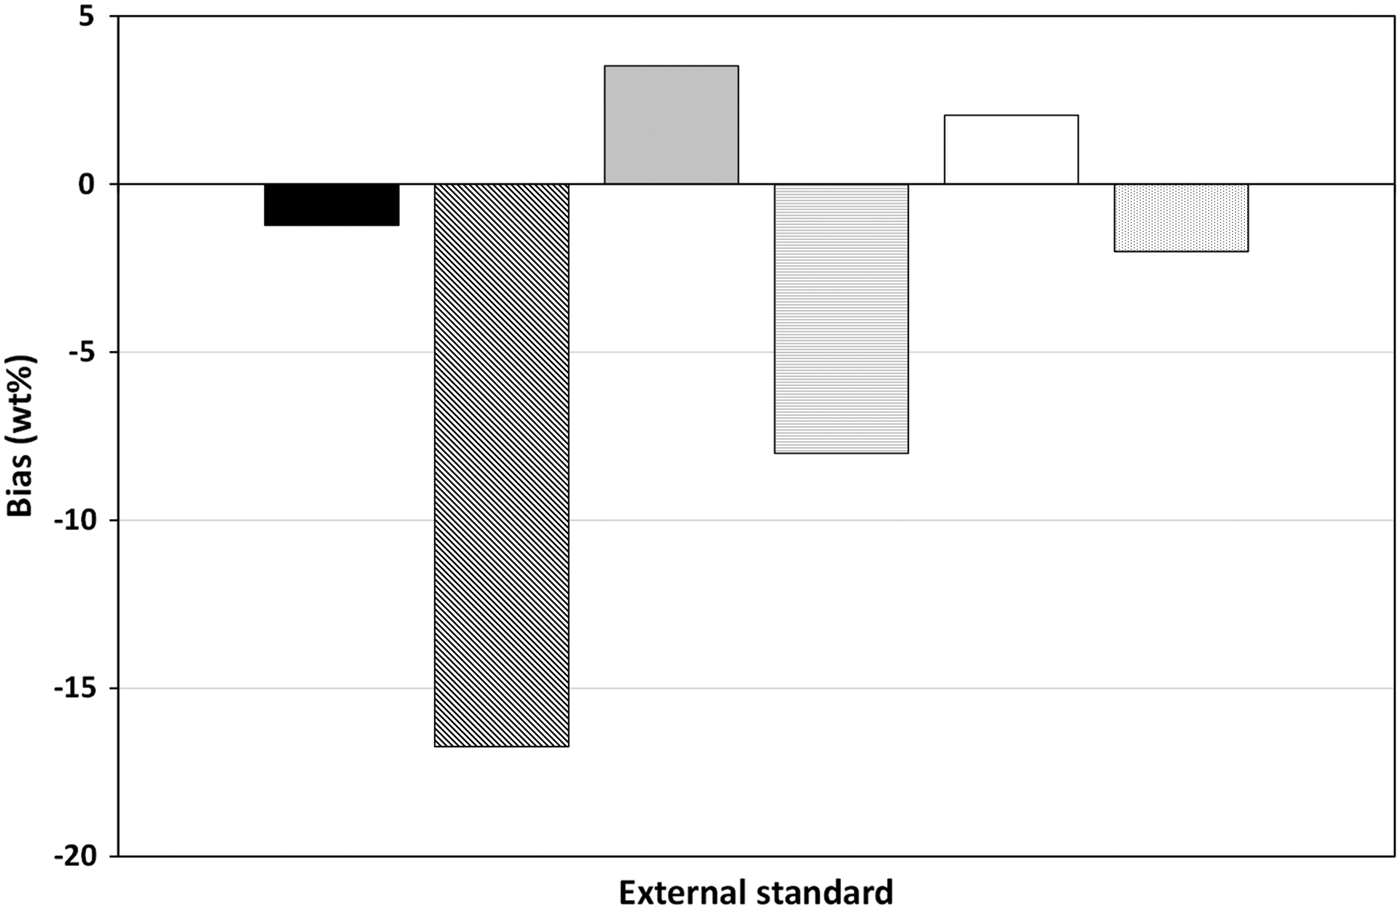
Figure 7 shows the bias of the amorphous measurements made using the external standards. (Note that values obtained using the silica standard have not been shown as they are the same as those for yttria.) The external standard method relies upon accurate knowledge of the amount of the standard phase present in the standard sample. In this study, the standards used were considered to be 100% pure. However, Figure 8 shows that the zincite standard material has an unknown quantity of amorphous material as indicated by the background features highlighted at around 35–45° θ. This means it cannot be considered as 100% for the purpose of calibration. Its concentration has been estimated via the DoC method and the results from the estimated concentration (94%) are also shown in Figure 7 to demonstrate the effect of the change in the calibration constant. The silica flour used as the source of amorphous material was included as an external standard given that its crystallinity was known and as such it could be considered to be “pure”. The values obtained using corundum and yttria are generally within ± 2 wt%. The values from the zincite standard improve with the estimate of zincite crystallinity but are still less accurate than the others because of the error in this estimation. Figure 9 shows a similar plot for samples with equivalent amorphous contents but with and without eskolaite in the crystalline fraction. The presence of eskolaite reduces the accuracy of the amorphous measurement considerably. (Note that only values derived from the corundum standard are shown in this figure.)
Bias of amorphous determination via the external standard method shown for the three different standards using the restrictive PONKCS model for silica (black = Am 1.2, dark grey = Am 2.8, mid-grey = Am 4.7, light grey = 13.6, white = Am 23.7).

(Colour online) Powder diffraction patterns for yttria (black), corundum (orange), and zincite (blue).

Bias of amorphous determination via the external standard method shown for corundum standard comparing equivalent amorphous content samples with and without eskolaite (black = Am 1.2, diagonal stripes = Am 1.4, light grey = Am 13.6, horizontal stripes = Am 11.9, white = Am 23.3, spots = Am 21.1). Silica has been modelled using the restrictive PONKCS model.

The calculation of amorphous content using the external standard method is similar to that of the internal standard method in that it relies on scaling the measurements of the crystalline phases and determining the amorphous content by difference. With this method though consideration is given to the absorption coefficient of the entire sample. Given that the ZMV/K term is a constant for each phase regardless of the mixture, the variance shown here is coming from a combination of the scale factor and the bulk MAC. As shown previously in the discussion of the internal standard method, the impact of the microabsorption cannot be estimated by consideration of the MAC alone and particle radius and packing density also come into play in the application of the external standard method. In this case, the calculated bulk MAC of the eskolaite bearing phases is probably much higher than it is in reality. This results in an overestimation of the phase abundances [from Eq. (4)], which results in a lower or even negative amount of amorphous material. Use of MAC rather than LAC in this method also exacerbates the overestimation by the inclusion of crystallographic density rather than actual, which is also likely to be lower.
C. Degree of crystallinity
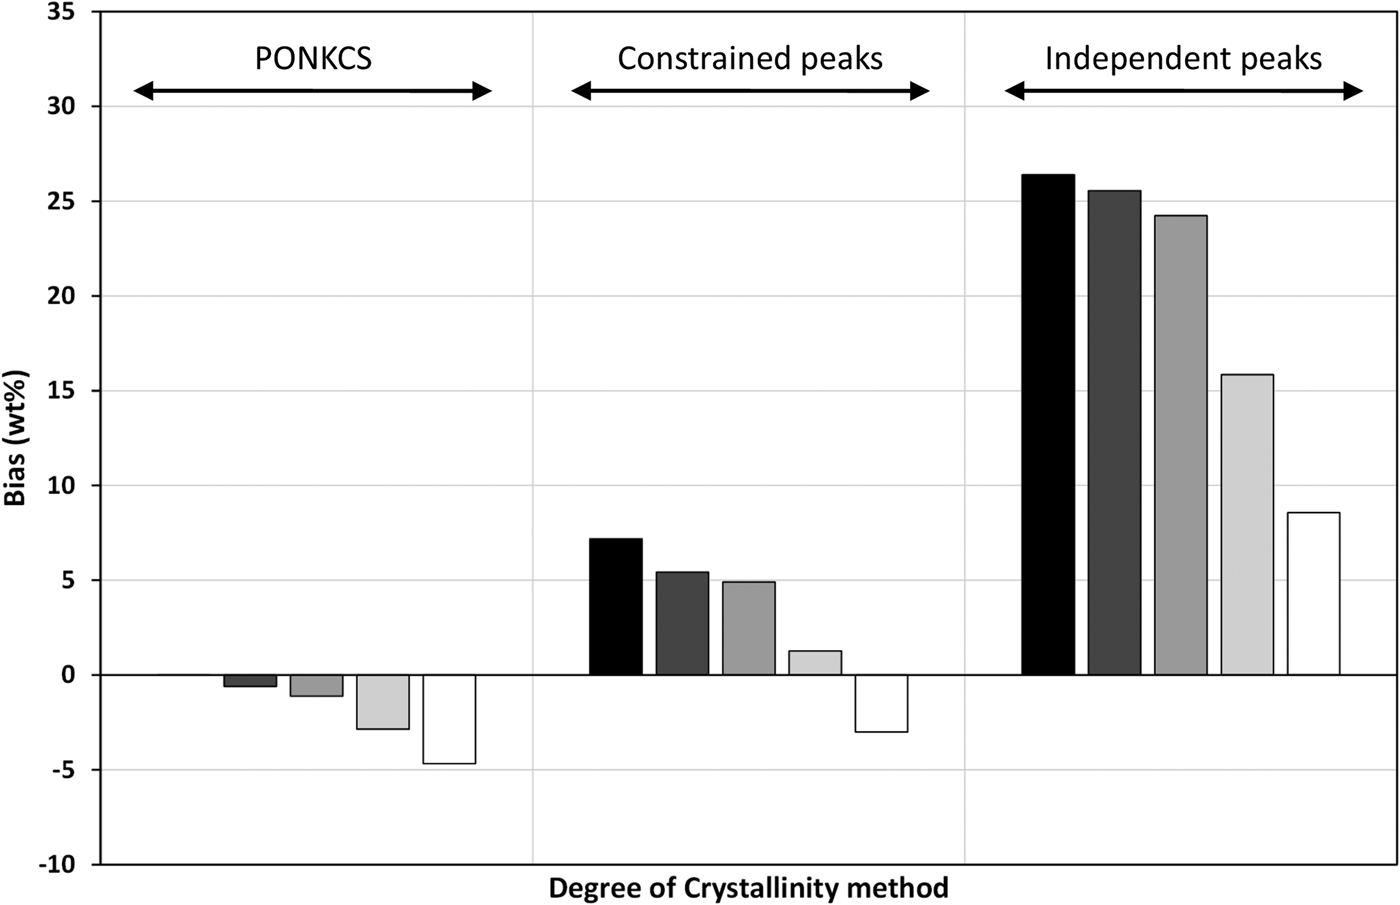
The DoC method is totally dependent upon the area of the pattern that is nominated as “amorphous”. Inclusion of peaks to account for amorphous material has the potential to correlate severely with the background function. This can be seen in the results shown in Figure 10. The more freedom the amorphous model has, the less accurate its quantification. At worst this model returns a value of over 25 wt% silica at the 1.2% level. A result like this could be extremely misleading if accepted at face value.
Bias of amorphous determination via the degree of crystallinity method shown for the three silica models (black = Am 1.2, dark grey = Am 2.8, mid-grey = Am 4.7, light grey = 13.6, white = Am 23.7).

The PONKCS model provides the most accurate analyses but requires a well-characterised sample of the amorphous component, which may be impractical in reality. The constrained peaks model is potentially more applicable although determination of values for the fixed parameters will be very approximate.
D. Partial or No Known Crystal Structure
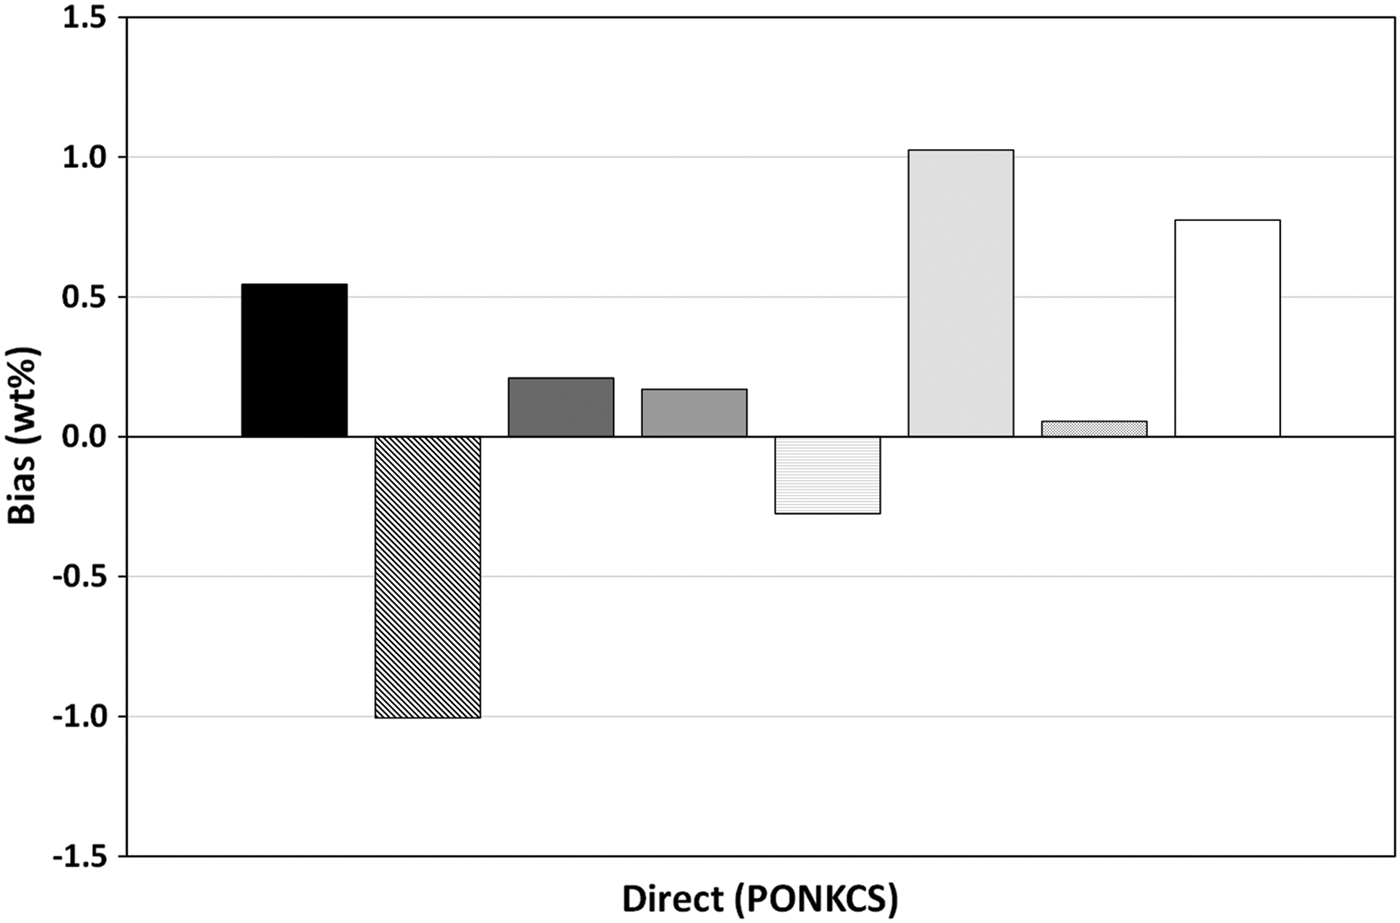
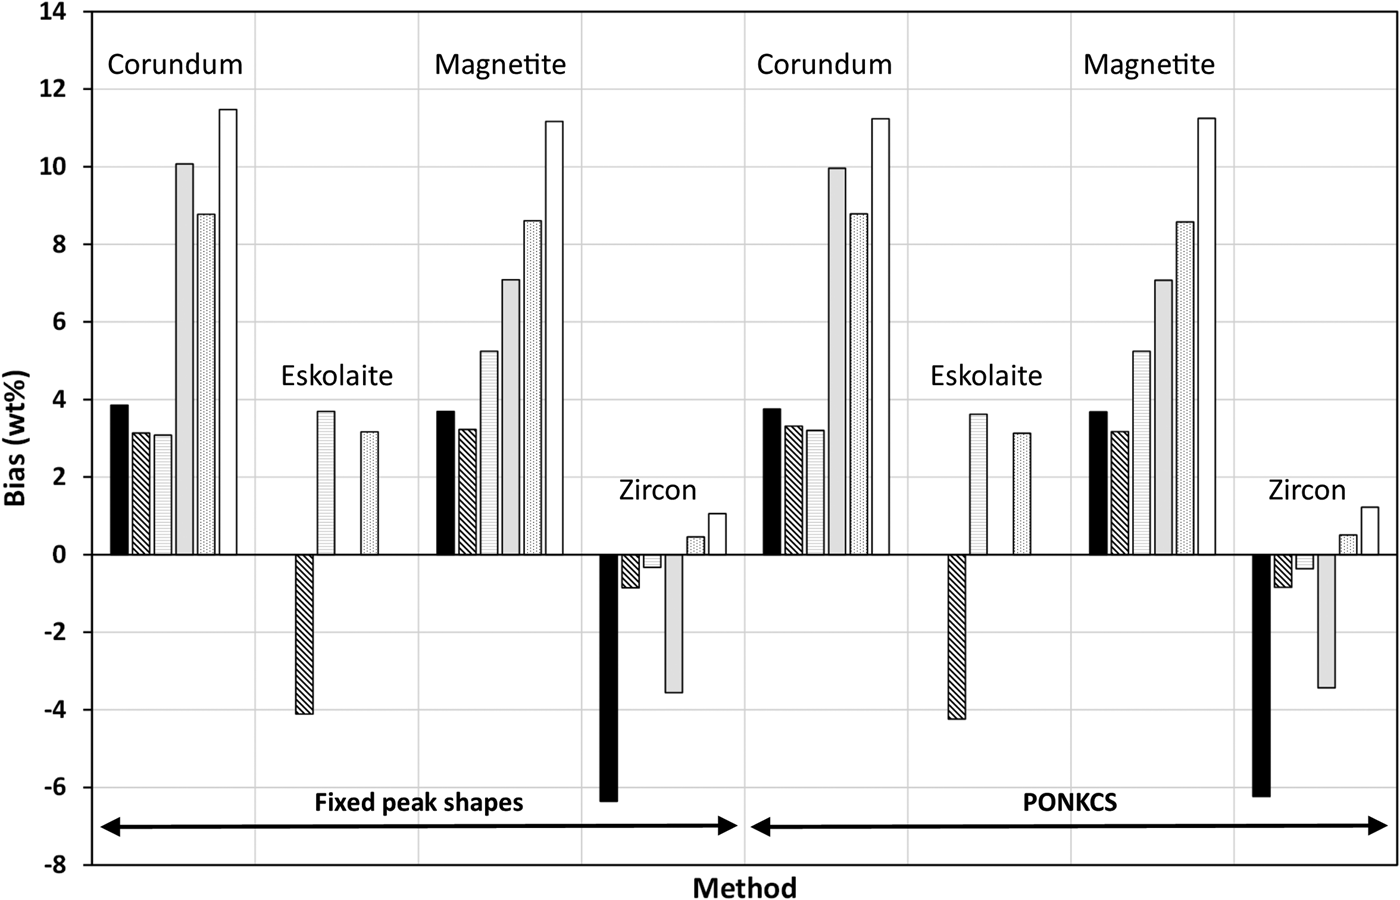
Figure 11 shows the results of the direct measurement of amorphous material via the PONKCS method. At all levels and in all samples, the absolute bias is less than about ±1%, which exceeds the accuracy of any of the other methods. This method has no impact, though, on the measurement of the crystalline phases, which are virtually no different from the relative values returned without accounting for silica via the PONKCS method. Figure 12 shows the bias of the relative weight percentages of the crystalline phases measured using (i) the fixed peak shape and (ii) PONKCS models for the silica. The results from the independent peaks are very similar and have been omitted for clarity.
Bias of direct amorphous determination via the PONKCS method (black = Am 1.2, diagonal stripes = Am 1.4, dark grey = 2.8, mid grey = Am 4.7, horizontal stripes = Am 11.9, light grey = Am 13.6, spot pattern = Am 21.1, and white = Am 23.7).

Bias of relative phase composition comparing the fixed peak shape and PONKCS models for the silica (black = Am 1.2, diagonal stripes = Am 1.4, horizontal stripes = Am 11.9, light grey = Am 13.6, spots = Am 21.1, and white = Am 23.7).

E. False measurement in absentia
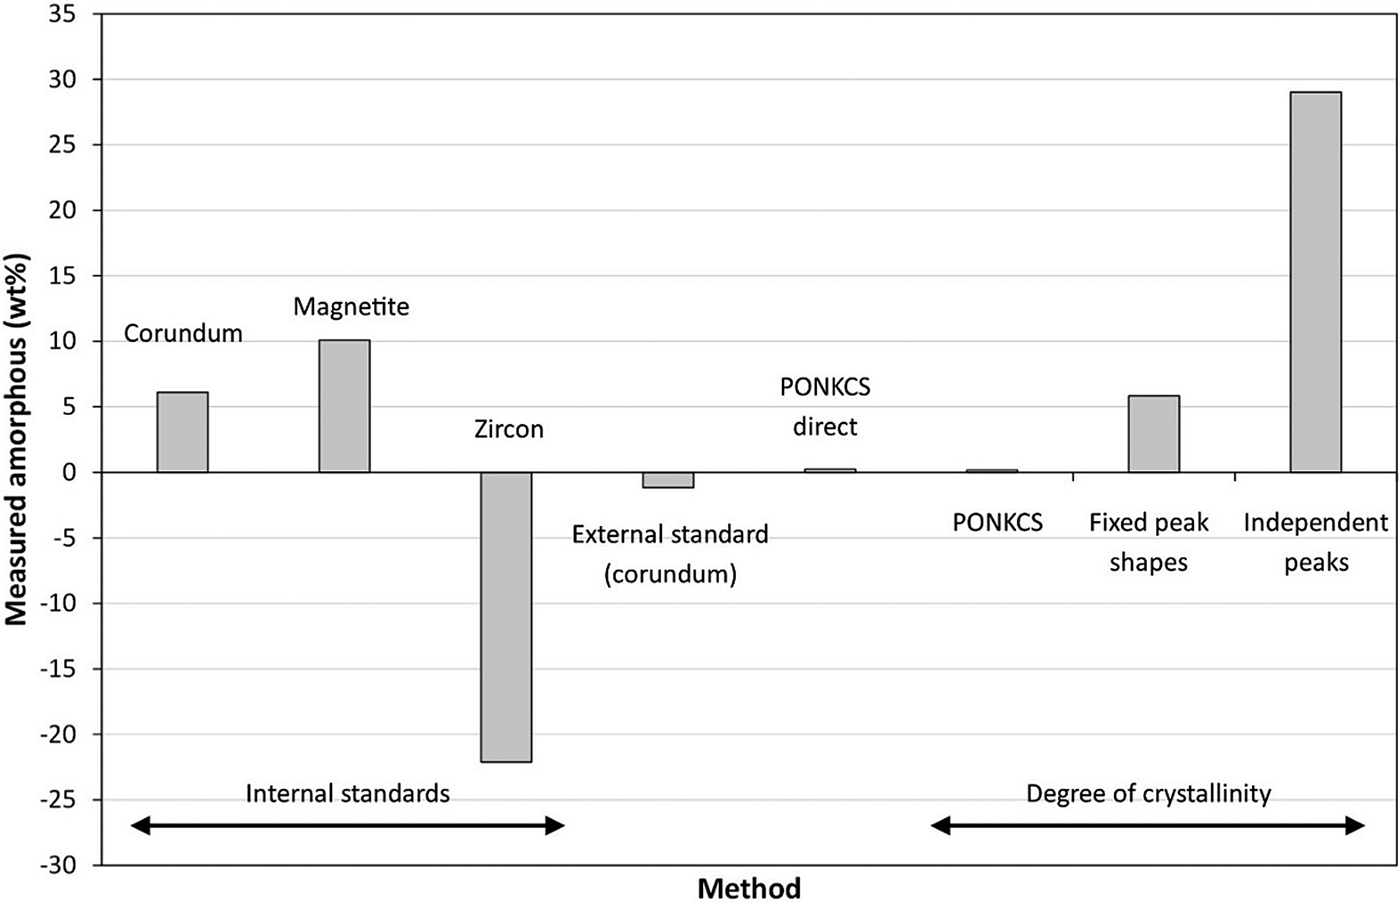
The basic sample from which all others in this study were prepared contained corundum, magnetite, and zircon and has been assumed to be 100% crystalline. This sample was also analysed using the methodologies described above to assess whether or not and to what degree a measurement of amorphous material would be reported in its absence. Figure 13 shows the results of these analyses. In all cases, an amorphous content was reported at either a positive or, unrealistic, negative value.
Measured amorphous content for Am 0 using the restrictive PONKCS model for the internal and external standard and direct measurements, and all three amorphous models for the degree of crystallinity method.

The values returned using the internal standard method are severely inaccurate and reflect the issues discussed above with the derivation of amorphous content from the scaling of incorrect values. The external standard method returned a small negative amorphous content consistent with the values returned for the rest of the four phase suite. The PONKCS direct measurement and that determined via DoC using that model are very accurate reporting <0.5% amorphous content for all measurements. The DoC measurements are in keeping with the other samples in that the amorphous content reported increases with the degree of freedom of the model for the amorphous material. Once again this is because of the increasing level of correlation between the background and the model.
F. Prediction of error
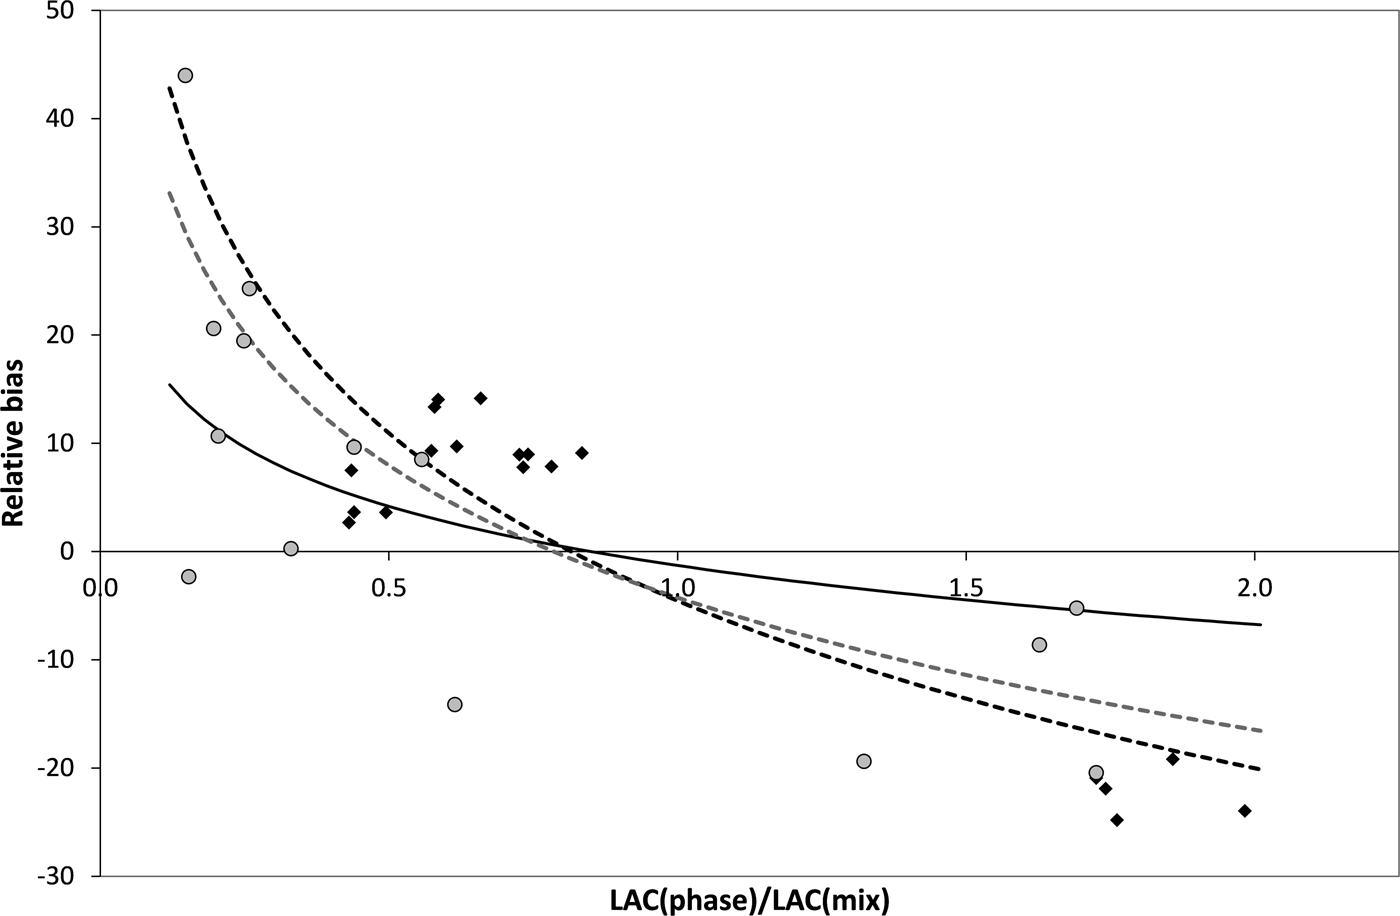
Given the variation in the results obtained with the different methods, it would be of benefit to be able to assess the level of accuracy in the QPA of an unknown sample. Kaduk assessed a number of standard mixtures of varying levels of absorption contrast (Kaduk, Reference Kaduk, Chung and Smith2000) and determined an empirical relation between the relative bias in the analysis and the ratio of the LAC of the phase to that of the bulk sample. The phases considered included micronised Catabwa sand (α-quartz), SRM676 (α-Al2O3), SRM 640b (Si), “Baker analysed” TiO2 (anatase), SRM 674a [α-Al2O3, ZnO, TiO2 (rutile), Cr2O3, and CeO2] and an amorphous silica/alumina. The equation determined there was:
 $${\rm Bias}_{{\rm relative}} (\% ) = - 1.28 - 7.78 \times {\rm ln}\left( {\displaystyle{{\mu _{{\rm phase}}} \over {\mu _{{\rm mix}}}}} \right)$$
with a correlation coefficient of 0.84. This methodology only considers the LACs of the system and takes no account of the particle size issue.
A similar methodology was applied to the results described here with quite a different result demonstrating the specificity of such a relation to a particular suite of samples. Equation (8) gives the function derived using the four phase suite (i.e. no eskolaite) which has a correlation coefficient of 0.76 and Eq. (9) gives that derived using all samples with a correlation coefficient of 0.61.
 $${\rm Bias}_{{\rm relative}} (\% ) = - 4.251 - 17.62 \times {\rm ln}\left( {\displaystyle{{\mu _{{\rm phase}}} \over {\mu _{{\rm mix}}}}} \right),$$
 $${\rm Bias}_{{\rm relative}} (\% ) = - 4.541 - 22.33 \times {\rm ln}\left( {\displaystyle{{\mu _{{\rm phase}}} \over {\mu _{{\rm mix}}}}} \right).$$
Figure 14 shows these relations graphically along with the function reported by Kaduk. The poor fits of the calculated lines and the inappropriateness of the Kaduk function to this system are clearly visible.
Relative bias of phase concentration as a function of the ratio between the LACs of the phase and the bulk sample, black diamonds = the four phase suite; black dotted line = the function derived from the four phase suite; grey circles = the five phase suite; grey dotted line = the function derived using all samples; black solid line = the function reported by Kaduk (Kaduk, Reference Kaduk, Chung and Smith2000).

IV. CONCLUSION
Four different methods of amorphous determination have been assessed using two suites of multi-phase samples of varying absorption contrast. Analysis was carried out using the internal and external standard methods, calculation of the DoC and direct measurement via the PONKCS method. All methods have been applied during Rietveld refinement of a consistent model across the suites.
The concept of microabsorption and its effects have been examined in terms of particle size and absorption contrast using the work of Brindley (Reference Brindley1945). In some samples microabsorption may be reduced by choice of an appropriate wavelength, but in many cases this will not be possible. Even when it is possible, there remains the issue of particle size. Examination of the well-prepared samples considered here demonstrated the poor likelihood of eliminating microabsorption by sample preparation. The variance in particle sizes and the breadth of the size distribution show that the majority of samples will not be within the boundaries of Brindley's correction method, which is based around the product of the LAC and the particle size (μD). This has reinforced the importance of considering the particle size in the estimation of the magnitude of the microabsorption problem. This is frequently ignored and consideration given only to the actual absorption coefficients of the component phases.
As stated above, the internal standard method is the most commonly used means of amorphous determination via XRD (Scarlett et al., Reference Scarlett, Madsen, Cranswick, Lwin, Groleau, Stephenson, Aylmore and Agron-Olshina2002). However, this study has highlighted the dangers associated with its application in samples exhibiting microabsorption. The amorphous content determined this way can be grossly over- or underestimated depending on the standard's contribution to the overall absorption of the sample either through its MAC or its particle size or both. In the samples considered here, none of the internal standards produced a satisfactory estimation of the amorphous content.
The external standard method produced better results than the internal standard because of its consideration of the bulk MAC of the sample. This method does not however affect the relative proportions of the sample but rather provides an estimate of amorphous content by scaling of the bulk. This scale factor is highly dependent upon the value of the bulk MAC used. The accuracy of this value will be affected by the particle size and density of the component phases, and the overall packing density of the bulk sample and cannot therefore be easily calculated.
The DoC method relies upon accurate apportioning of intensity to crystalline and amorphous phases. There is a very strong risk of correlation between the area designated as “amorphous” and that defined by the background function. Without prior knowledge of the pattern of the amorphous material, this is very difficult to avoid. A reasonable estimate of amorphous content could be estimated this way if the constrained PONKCS model for the silica was used. However, if such a model was available, it would be better to use the PONKCS method directly, which has been shown here to provide the most accurate measurement of amorphous content at all levels.
All methods reported some level of false-positive (or negative) value for amorphous content in samples assumed to be 100% crystalline. This was very small for the PONKCS method either alone or in conjunction with the DoC method but development of such a model for amorphous material is likely to be difficult in real-world samples.
It must be remembered that microabsorption affects the relative intensities of the diffraction peaks upon which all measurement depends. Its effects are complex and not readily predicted, however they cannot be ignored in any QPA via XRD. The key issues are the absorption contrasts between the phases and between each phase and the bulk. The particle size of the component phases must also be taken into account although this information is not always easily obtained. Generally particle sizes will not be uniform for any given phase and a broad size range is quite likely. Based on this survey, PONKCS is the most accurate method considered but somewhat impractical. A more readily applied approach is the external standard method with the understanding that its accuracy will be greatly reduced by sample complexity. For some samples, it may be completely misleading and there is unfortunately no means of assessing the accuracy of a measurement without detailed prior knowledge of the sample.
SUPPLEMENTARY MATERIAL
The supplementary material for this article can be found at https://doi.org/10.1017/S0885715618000052
Acknowledgements
The authors thank Matthew Glenn for conducting the ESEM examination of Sample AM21.1.