Introduction
Ethiopia's western and southern lowland areas and the major river basins are infested by five tsetse species (Glossina fuscipes fuscipes Newstead, 1910; G. longipennis Corti, 1895; G. morsitans submorsitans Newstead, 1910; G. pallidipes Austen, 1903; and G. tachinoides Westwood, 1850) (ISCTR, 1999) that strongly affect livestock health and productivity, transmitting several pathogenic species of trypanosomes (Merid Negash et al., Reference Merid, Melaku and Emiru2007).
In Ethiopia, animal health improvement is considered a key component of integrated community-based human health and poverty alleviation schemes (Aseffa Abreha et al., Reference Aseffa, Getachew and Baumgärtner2003). In fact, livestock plays a crucial role in agricultural production, both directly as a food source from animal products and indirectly as a source of energy for traction to enhance food crop production and income generation (FAO, 2002). Ethiopia possesses the largest number of livestock in Africa, comprising 43 million heads of cattle, 42 million heads of goats and sheep, and six million heads of equines (FAO, 2007).
To reduce livestock losses in tsetse infested areas, both disease control and vector management measures need to be undertaken (Getachew Tikubet et al., Reference Getachew, Shifa, Amare, Aseffa, Getachew and Baumgärtner2003, Reference Getachew, Lulseged, Sciarretta, Gilioli, Teame, Trematerra, Gutierrez and Baumgärtner2006). The cattle host, the trypanosome pathogen and the tsetse vector are seen as a complex system that can adequately be managed on the basis of adaptive procedures focusing on change rather than on predefined objectives (e.g. Holling, Reference Holling1978; Shea et al., Reference Shea, Possingham, Murdoch and Poush2002; Berkes, Reference Berkes2007; Gilioli & Baumgärtner, Reference Gilioli and Baumgärtner2007). Sciarretta et al. (Reference Sciarretta, Melaku, Getachew, Lulseged, Shifa and Baumgärtner2005) focused on vector control and included precision targeting interventions into an adaptive tsetse management system. Specifically, the approach uses spatially explicit statistical methods to define pest distribution with a minimal a priori knowledge of the pest behaviour and to provide simple, documentable procedures to minimize direct control tactics (Brenner et al., Reference Brenner, Focks, Arbogast, Weaver and Shuman1998; Ferguson et al., Reference Ferguson, Klukowski, Walczak, Clark, Mugglestone, Perry and Williams2003). The analysis of spatial distributions on the basis of the geostatistics is widely used in pest management (Nestel et al., Reference Nestel, Carvalho, Nemny-Lavy, Horowitz and Ishaaya2004). The technique consists of estimating the value of a parameter (e.g. insect population size) on an unexplored or un-sampled location based on the values of neighbouring localities. Sciarretta et al. (Reference Sciarretta, Melaku, Getachew, Lulseged, Shifa and Baumgärtner2005) applied it to tsetse data obtained during the adaptive animal health project at Luke, Ethiopia. Adaptive management is a systematic, cyclical process for continually improving management policies, strategies and tactics, based on lessons learned from operational activities (Comiskey et al., Reference Comiskey, Dallmeier, Alonso and Levin1999). The active adaptive management recognizes uncertainties about observations, biotic processes and the future and encourages the actors to learn about the managed system, bearing the uncertainty in mind and forcing them to acknowledge all forms of uncertainty (Shea et al., Reference Shea, Possingham, Murdoch and Poush2002).
In our case, tsetse monitoring and data processing with geostatistical analyses produced a time series of distributional maps with areas of relatively high tsetse catches to which management actions were directed (Sciarretta et al., Reference Sciarretta, Melaku, Getachew, Lulseged, Shifa and Baumgärtner2005; Baumgärtner et al., Reference Baumgärtner, Getachew, Gilioli, Gutierrez, Sciarretta and Trematerra2008). Thus, vector management was adapted to the position of the areas of relatively high tsetse densities, changing through time and being reliant on continuous monitoring of tsetse occurrences, processing data and providing decision-support for precision targeting interventions. This method is readily applicable but does not account for possible differences between species and sex of tsetse. A better consideration of these aspects may increase the quality of information for decision support and the efficiency of precision targeting.
The first purpose of this paper is to analyze the spatio-temporal distribution of tsetse at the Keto pilote site in Ethiopia with focus on the aggregation patterns and the spatial association between species and sexes. The second purpose is to evaluate the contribution of these analyses to the precision targeting approach in an adaptive tsetse management framework.
Materials and methods
Study area
The tsetse study was located at Keto, a farming area located in Western Wollega Zone of Oromia Regional State, Ethiopia. The site, near the Birbir River, is located at latitude N 08°43′23″ and longitude E 035°07′18″ and an altitude of about 1200–1400 m above sea level.
The climate is tropical with two rainfall periods per year: the short rainy season lasts from March to May, with light rains; while the main rainy season occurs from June to the middle of September, when most of the yearly rainfall is concentrated.
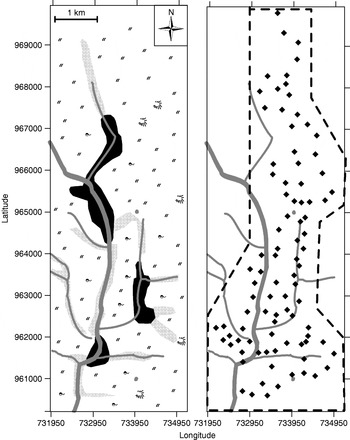
Uncultivated land extends up to the Birbir River and is infested by tsetse. The vegetation is characterised as mainly savannah grassland with scattered trees (Acacia spp.) and bushes, while few wooded areas remain along streams and rivers (fig. 1). The area under study focused on a 20 km2 portion of land located between the river and the grassy savannah (1–3 km wide), representative of the different habitats in the area.
Graphic representation of the administrative area of Keto, Ethiopia, around the Birbir River. Major rivers and streams, and main vegetation elements are showed on the left. Trap positions are showed on the right. Dotted line represents the effective area of sampling ( , grassy vegetation; ▪, forest strips;
 , riverine vegetation with scattered trees;
 , river and streams;
 , scattered trees;
 , shrubs; ◆, traps).

In the recent past, farmers from the crowded Ethiopian highlands moved to this area. The farmers settled mostly on the fringes of the river valley but allow herds to graze freely in the savannah. Cattle are kept mainly for milk production and for providing traction power. Maize, sorghum, sesame and Niger seeds are the main crops, but the settlers also cultivate horticultural crops, such as sweet potatoes, cabbages and beans.
The high prevalence of trypanosomiasis in cattle severely constrained the agricultural production and prevented the settlers from efficiently cultivating the land. Prior to our work, no tsetse management measures were undertaken. At that time, 33 oxen were tested positive for Trypanosoma congolense and 15 for Trypanosoma vivax in a sample of 98 oxen checked through wet smear blood examination. During our survey, no other measures than trapping were carried out in the area, while a more extended management program was planned to follow after the completion of our investigation.
Tsetse sampling
Following the recommendations of the Food and Agriculture Organization (FAO, 1992) and Sciarretta et al. (Reference Sciarretta, Melaku, Getachew, Lulseged, Shifa and Baumgärtner2005), 91 Vavoua version monoconical traps, baited with cow urine, were deployed in an area along the Birbir River. A trap consists of a metal support with a blue/black upper cone textile covering and three blue/black streamers hanging vertically from the cone rim (FAO, 1992). Traps were positioned in the field approximately 500 m from each other, producing an irregular grid (fig. 1). The vegetation around the traps consisted mainly of savannah grassland with scattered acacia trees, but some traps were in other kinds of habitats, including river banks with dense tree coverage (fig. 1).
Trap positions were geo-referenced using geographic positioning system (GPS), and universal transverse of mercator (UTM) coordinates were recorded.
Tsetse traps were deployed from October 2004 until May 2005; in June, the main rainy season started and monitoring had to be interrupted because the area was no longer accessible. The catches were examined once every two weeks, and species, sex and numbers were recorded.
Spatial analysis
A clustering analysis was performed with the spatial analysis by distance indices methodology (SADIE) developed for the analysis of spatially referenced counts (Perry et al., Reference Perry, Winder, Holland and Alston1999).
An index of clustering is ascribed to each sampling unit: units with counts c i>sample mean, m, are considered donor units and are ascribed to a clustering index, v i. Units with v i>1 belong to patches. Sampling units with counts c i<m are considered receiver units and are ascribed to a clustering index, v j. Sampling units with v j<−1 belong to gaps (Perry, Reference Perry1998). Critical values of v i and v j corresponding to the 95th, 90th and 75th percentiles of their respective randomization distributions, were obtained.
Perry et al. (Reference Perry, Winder, Holland and Alston1999) stated that the SADIE methodology refers to a class of methods that detect spatial patterns in the form of clusters and is particularly appropriate for ecological counts usually represented as discrete variables found in isolated clusters, often with a majority of zero values.
Clustering analysis was carried out, for each sampling date and for the whole sampling period, for the catches of G. m. submorsitans, the catches of G. pallidipes, and to male and female catches for each species. Cluster indices were contoured and mapped with Surfer version 8.02 (Golden software, Golden, CO, USA).
The SADIE methodology was also used to perform an association analysis that measures the spatial association between two populations by overlaying the cluster maps of the two distributions (Perry & Dixon, Reference Perry and Dixon2002). Thereby, the spatial association between two observed arrangements is calculated by permuting clustering indices amongst the sample units. The SADIE methodology yields an index of local association assigned to each sample unit, i.e. each trap in the field. If the clustering indices of two populations, compared at the same sample site, are both v i or v j, the SADIE methodology will assign a positive index to that sample site, indicating a local association. If the index from one population is v i and the other is v j, then the index for that site will be negative, indicating local dissociation. Further, an overall index of association is derived as the mean of local indices to describe the extent of association or dissociation between the two populations. A two-tailed test of the randomizations generated may be performed to assign confidence limits to the overall association index. The association index was obtained for each sampling date and the whole sampling period to compare: (i) the distribution of two consecutive weeks for each species, (ii) the distribution of males and females within each species, and (iii) the distribution of G. m. submorsitans and G. pallidipes.
Both the cluster and association analyses were carried out with the SADIE software (Rothamsted Research, Harpenden, UK).
Results
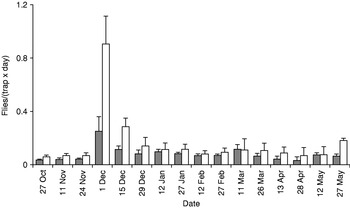
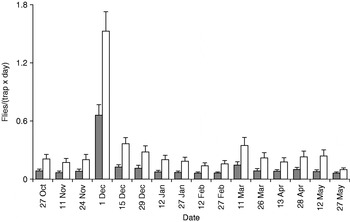
During the survey, 11,671 specimens were collected, belonging to two species of savannah tsetse flies, G. m. submorsitans and G. pallidipes, the second one being more abundant, with 60% of total catches. The mean number of flies per trap per day peaked on the first day of December for both species and then strongly decreased until the end of survey in May (figs 2 and 3).
Biweekly catches of G. m. submorsitans (expressed as flies per trap and day) in monoconical traps sampled from October 2004 to May 2005 at the Keto pilote site, Ethiopia. Bars indicate standard errors (SE) ( , male; □, female).

Biweekly catches of G. pallidipes (expressed as flies per trap and day) in monoconical traps sampled from October 2004 to May 2005 at the Keto pilote, Ethiopia. Bars indicate standard errors (SE) (, male; □, female).

More females were trapped than males, with a ratio of 1.7:1 for G. m. submorsitans and 2.4:1 for G. pallidipes. For the second species, the ratio was quite uniform during the survey period; in the case of G. m. submorsitans, it was more variable, and in some dates, for example 11 March or 12 May, the number of trapped males was similar or higher then females.
Glossina morsitans submorsitans spatial distribution
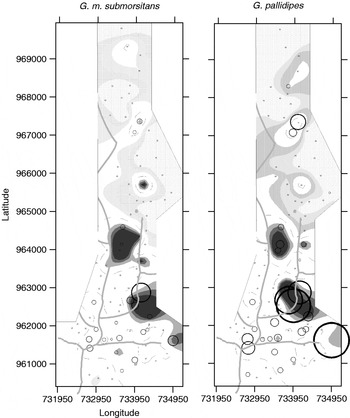
The captures of G. m. submorsitans were higher in the southern than in the northern part of the study area. The cluster analysis indicated the presence of two large patches in the southern zone, one located in a wooded area the other in the savannah grassland; while, in the north, gaps prevailed (fig. 4).
Cluster maps showing G. m. submorsitans and G. pallidipes spatial pattern in the sampling area. The indexes of clustering, v i and v j, obtained by SADIE procedure, indicate the magnitude of patch and gap clusters, respectively. Areas included in the v i and v j limits obtained from 95th, 90th and 75th percentiles are coloured according to the legend. (The size of the circles represents the magnitude of individuals found; x- and y-axes are expressed in UTM coordinates) ( , v i 75th percentile;
 , v i 90th percentile,
 , v i 95th percentile;
 , v j 75th percentile;
 , v j 90th percentile;
 , v j 95th percentile; No. of individuals:
 , 50;
 , 25).

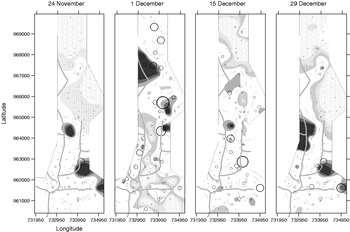
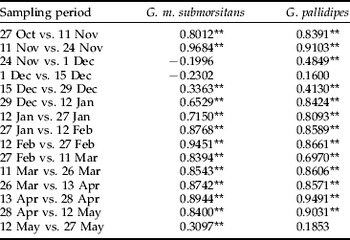
The spatial associations among two consecutive samples were positive and significant (P<0.05) in most cases, with the exception of 24 November vs. 1 December and 1 December vs. 15 December, appearing in the comparisons in table 1. In these periods, corresponding to the early dry season (November–December), biweekly maps showed a pronounced change in high catch areas, in most cases located near forest strips (fig. 5).
Cluster maps showing G. m. submorsitans spatial pattern for the 24 November, 1, 15 and 29 December samples. Areas included in the v i and v j limits obtained from 95th, 90th and 75th percentiles are coloured according to the legend. The indexes of clustering v i and v j, obtained by SADIE procedure, indicate the magnitude of patch and gap clusters, respectively. (The size of the circles represents the magnitude of individuals found; x- and y-axes are expressed in UTM coordinates) (, v i 75th percentile; , v i 90th percentile, , v i 95th percentile; , v j 75th percentile; , v j 90th percentile; , v j 95th percentile; No. of individuals: , 50; , 25).

Spatial association between two consecutive samplings for G. m. submorsitans and for G. pallidipes counts.

Significant positive association is indicated at 95% confidence level. No significant negative association was obtained.
** significant association.
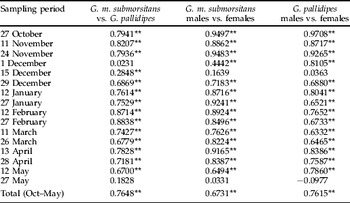
Between the sexes, the spatial association was positively correlated (P<0.05) for all sampling dates apart from 15 December and 27 May (table 2). Biweekly maps built for males showed a radical change in the distribution between 1 and 15 December; whereas, for females, a similar but less abrupt change was obtained between 1 and 29 December.
Spatial association between G. pallidipes and G. m. submorsitans and between males and females counts in each species.

Significant positive association is indicated at 95% confidence level. No significant negative association was obtained.
** significant association.
Glossina pallidipes spatial distribution
The cluster maps of G. pallidipes showed that tsetse were mainly captured in the southern part of the study area where two main patches were identified, one in a wooden area and the other in the savannah grassland; an extended gap area existed in the northern part (fig. 4).
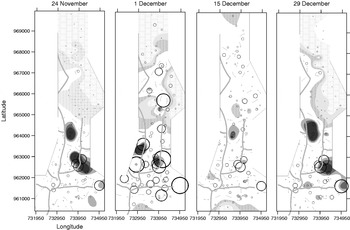
The association index among two consecutive sampling highlighted a positive correlation (P<0.05) in all cases except for 1 vs. 15 December and 12 vs. 27 May (table 1), corresponding to the early dry season (November–December) and to the short rainy season (May), when a pronounced change in aggregation was observed, with most patches located near forest strips (fig. 6).
Cluster maps showing G. pallidipes spatial pattern for 24 November, 1, 15 and 29 December samples. Areas included in the v i and v j limits obtained from 95th, 90th and 75th percentiles are coloured according to the legend. The indexes of clustering v i and v j, obtained by SADIE procedure, indicate the magnitude of patch and gap clusters, respectively. (The size of the circles represents the magnitude of individuals found; x- and y-axes are expressed in UTM coordinates) (, v i 75th percentile; , v i 90th percentile; , v i 95th percentile; , v j 75th percentile; , v j 90th percentile; , v j 95th percentile; No. of individuals: , 50; , 25).

The spatial association between males and females was positively correlated (P<0.05) in 90% of cases; the exceptions were the 15 December and 27 May samples (table 2).
Single survey maps built for males showed that the spatial pattern on 15 December was very different from that observed on the 1 or 29 December; in females, differences were less marked, the 15 December patches were limited, afterwards they extended in the central-western part of the study area.
Comparison of G. m. submorsitans and G. pallidipes distributions
In general, the spatial patterns of the two species were very similar, with major patches and gaps located in the same positions (fig. 4). Also, spatial associations were positive and significant (P<0.05) except for the 1st December and the 27 May data (table 2).
Few differences between species can be seen as, for example, in the single cluster maps from 24 November to 29 December (figs 5 and 6). Then, the aggregation pattern of G. m. submorsitans changed on the 1st of December, when patches in the southern zone disappeared and were replaced by gaps, while new patches appeared in the northern zone. This shift was not observed in G. pallidipes. The 15 December catch distribution changed again but in a similar way for both species, with a strong reduction of patches (figs 5 and 6).
Discussion
Tsetse spatio-temporal distribution
In the investigated area, the distribution of G. m. submorsitans and G. pallidipes catches appeared to be aggregated along the Birbir River and small rivers, as well as in the savannah with a heterogeneous vegetation. On the contrary, the open savannah far from the water did not host important patches.
The temporal pattern of captures showed that G. m. submorsitans and G. pallidipes were most abundant between November and December, probably due to the increase in tsetse during the early dry season, then rapidly declined as the climate became drier. It is noteworthy that the pronounced peak of catches, observed at the end of November, matched a change of distribution in both species and determined the change to a less aggregated distribution. During this time, the distribution of captures differed between the two species, but the hot spots appeared mainly along forest strips. At the end of December, the aggregation pattern rapidly turned again into the previous distribution and remained stable during the rest of the sampling period (dry season), but the total amount of catches was much lower. For the dynamic we explained, we retain that the observed peak of catches at the end of November probably are due, in part, to the movement of individuals that before tended to aggregate and afterwards spread to the surroundings outside the area covered by traps.
The general spatio-temporal dynamics of males and females within each species appeared to follow a similar trend. Nonetheless, the analysis of aggregation patterns for single sexes allowed the highlighting of different behaviour in some periods. In both species, from 1 to 15 December, females showed a longer phase of dispersion with respect to males that did not change the level of aggregation, but patches shifted to a different zone.
Factors explaining spatio-temporal distribution
According to Leak (Reference Leak1999), the aggregated distribution of catches observed in Keto may be due to the fact that both tsetse species, dominant in the arid or semi-arid savannah ecosystem, may occupy preferentially woody habitats, looking for vegetation cover that provide shade for individuals. G. m. submorsitans has been reported to have a more diverse habitat than G. pallidipes (Leak & Woudyalew Mulatu, Reference Leak and Woudyalew1993), but our results clearly showed that the aggregation areas for long periods were very similar in both species, suggesting that the two species can coexist and individuals may share the same habitats.
In this work, the sampling period is limited and, consequently, information on temporal dynamics during the rainy season are lacking. However, various studies carried out in Ethiopia showed that, during the months not covered by our survey (from June to September), catches were at the lowest level of the year (Leak & Woudyalew Mulatu, Reference Leak and Woudyalew1993; Leak et al., Reference Leak and Woudyalew1993; Getachew Tikubet et al., Reference Getachew, Shifa, Amare, Aseffa, Getachew and Baumgärtner2003).
The migratory movements can play an important role in the spatio-temporal distribution, especially in this case, where the monitored area is not very extended. The observed spatio-temporal distributions suggests that, during the dry season, the movements of individuals occurred inside the patches located in suitable habitats, giving rise to strong aggregations. However, as soon as the density of tsetse increased (during the first half of the dry season), the tsetse displayed a less aggregated pattern in the area. According to the observations of Nash (Reference Nash1948), this phase is limited to few days as tsetse rapidly begin to evacuate the drier parts of their range in the open savannah, slowly becoming restricted to the denser vegetation along watercourses. After one month, the flies were again limited to those suitable habitats with a high probability of finding cattle hosts.
The grazing ranges of the cattle, in relation to the distribution of water and pasture, can influence the tsetse spatial patterns (Hargrove et al., Reference Hargrove, Torr and Kindness2003; DFID, 2008). In Keto, herds are led daily from the village area toward the river and other streams. Regularly, cattle stay near the water early in the morning and tend to freely graze at relatively humid sites during the day. During the dry season, they are in the shadow of trees until late afternoon, before going back toward the village. Studies on morsitans group species showed that the daily feeding activities of tsetse are limited to early morning and late afternoon, whereas most of the remaining time is spent inactive at resting sites that are advantageous for meeting the cattle hosts (Leak, Reference Leak1999). Thus, one might conclude that the search for water and shaded places by both tsetse and cattle, at the time of main tsetse activities, would lead to a spatial coincidence at hot spots and possible high disease transition probabilities.
On the whole, the observed results confirmed the statements made by Robinson et al. (Reference Robinson, Rogers and Williams1997) who explained the tsetse spatio-temporal dynamics by the interaction of three factors: climate (particularly rain regime), habitat (especially vegetation cover) and host availability.
Tsetse adaptive management improvement
In our adaptive management approach, tsetse monitoring is done by community members charged with tsetse management and data processing with geostatistical analyses by external collaborators. They developed semi-variograms and produced a time series of distributional maps with areas of relatively high tsetse densities, to which management actions were directed (Sciarretta et al., Reference Sciarretta, Melaku, Getachew, Lulseged, Shifa and Baumgärtner2005). According to local conditions, the actors responded to hot spots by either deploying additional traps for mass trapping tsetse or using targets impregnated with deltamethrin, while others renounced direct interventions and directed herds far away from infested areas (Baumgärtner et al., Reference Baumgärtner, Getachew, Gilioli, Gutierrez, Sciarretta and Trematerra2008).
The use of geostatistical methods allowed the identification of hot spots, empirically defined as “patches with predicted densities that exceed predicted densities in the surrounding areas by one fly” (Sciarretta et al., Reference Sciarretta, Melaku, Getachew, Lulseged, Shifa and Baumgärtner2005). The identification of hot spots and the calculation of the optimum sample size are important aspects of the adaptive management approach since the price of a single trap is relatively high (approximately ten times the average daily per capita income).
SADIE methodology differs from other spatial analyses, including the previously used geostatistics. For instance, the clusters obtained by the SADIE methodology may be defined at various levels using formal randomization tests to obtain confidence intervals, and contour methods may be used to define their exact dimension.
The SADIE methodology improved the insight into the spatial distributions and proved more effective in delimiting hot spots on maps, measuring shapes and sizes of patches and discarding areas with low tsetse density. However, geostatistics were not completely discarded but continue to be used to interpolate cluster indexes obtained by SADIE. Nonetheless, we are conscious that any control campaign must provide attention also to places where tsetse might appear sparse or few due to a low efficiency of traps but indeed are possible sources or routes of invasion. Further, values of cluster indexes among sampling locations obtained by interpolation should be carefully evaluated, avoiding the use of them for generalization on the spatial distribution, as they can lead to inaccurate conclusions (Athanassiou & Saitanis, Reference Athanassiou and Saitanis2006). In this context, the use of insecticide applied to targets or cattle can be applied at different density levels, according to the hot spot position on the map.
SADIE can be applied as easily as the geostatistical methods to continuous monitoring of hot spots and guiding vector management and disease control activities. The development of mathematical models representing the spatial dynamics of vector and host populations may provide additional insight into the dynamics of the complex host – pathogen – vector (Guerrini et al., Reference Guerrini, Bord, Ducheyne and Bouyer2008). However, this modelling approach may be more difficult to use for tactical decision making in the adaptive management framework described here than in the SADIE methodology.
Acknowledgements
We would like to thank the personnel of the Ethiopia office of the Nairobi-based International Centre of Insect Physiology and Ecology (ICIPE) for their help in examining and recording tsetse fly data from the Birbir River area.