1 Introduction
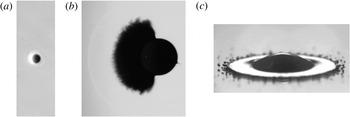
The impact of a short laser pulse onto a free-falling absorbing liquid droplet induces a rapid phase change in a thin superficial layer on the illuminated side of the droplet (Klein et al. Reference Klein, Bouwhuis, Visser, Lhuissier, Sun, Snoeijer, Villermaux, Lohse and Gelderblom2015; Kurilovich et al. Reference Kurilovich, Klein, Torretti, Lassise, Hoekstra, Ubachs, Gelderblom and Versolato2016). The resulting vaporization, explosive boiling or even plasma formation gives rise to mass ablation; see figure 1(a,b). Subsequently, a recoil pressure wave propagates into the droplet and causes a net momentum transfer (Sigrist & Kneubuhl Reference Sigrist and Kneubuhl1978; Apitz & Vogel Reference Apitz and Vogel2005; Klein et al. Reference Klein, Bouwhuis, Visser, Lhuissier, Sun, Snoeijer, Villermaux, Lohse and Gelderblom2015). As a consequence the droplet is propelled forward and strongly deforms (Klein et al. Reference Klein, Bouwhuis, Visser, Lhuissier, Sun, Snoeijer, Villermaux, Lohse and Gelderblom2015; Gelderblom et al. Reference Gelderblom, Lhuissier, Klein, Bouwhuis, Lohse, Villermaux and Snoeijer2016). However, the way in which these pressure waves establish inside the droplet over time, which is in particular relevant for short pulse durations, has so far remained unexplored.
An illustration of three different impact duration regimes on a droplet. (a) A nanosecond laser pulse impacting from the left on a micron-sized liquid tin droplet leads to plasma formation (white glow in the image) and subsequently plasma-mediated ablation of the droplet (image taken from Kurilovich et al.
Reference Kurilovich, Klein, Torretti, Lassise, Hoekstra, Ubachs, Gelderblom and Versolato2016). The typical ablation pressure duration is comparable to the plasma decay duration, which is of the order of the acoustic time scale:
 $\unicode[STIX]{x1D70F}_{e}\lesssim R/c$
, where
 $R$
is the initial droplet radius and
 $c$
the speed of sound inside the droplet. (b) Impact of a nanosecond laser pulse onto a millimetre-sized dyed water droplet can lead to vaporization and mist cloud formation, the accompanying shock wave in the surrounding air is also visible (Klein et al.
Reference Klein, Bouwhuis, Visser, Lhuissier, Sun, Snoeijer, Villermaux, Lohse and Gelderblom2015). The typical vapour-recoil-induced ablation pressure duration is much longer than the acoustic time scale, but much shorter than the time scale on which the droplet deforms:
 $R/c\ll \unicode[STIX]{x1D70F}_{e}\ll R/U$
, where
 $U$
is the propulsion speed of the droplet (image taken
 $5~\unicode[STIX]{x03BC}\text{s}$
after laser impact, image courtesy Klein). (c) For the impact of a droplet onto a solid surface the typical interaction time is equal to the deformation time
 $\unicode[STIX]{x1D70F}_{e}=R/U$
, where
 $U$
is the impact speed of the droplet (image taken from Josserand & Thoroddsen Reference Josserand and Thoroddsen2016).

In this study we aim to understand the fluid dynamic response of a droplet to a short ablation-driven pressure pulse. In addition to this ablation pressure, a laser impact could trigger pressure waves inside the droplet through a number of other mechanisms (Sigrist Reference Sigrist1986). Electrostriction and radiation pressures are of negligible influence compared to the ablation pressure (Sigrist Reference Sigrist1986). However, the local heating of the liquid close to the droplet surface can induce significant thermoelastic waves that result from thermal expansion (Sigrist & Kneubuhl Reference Sigrist and Kneubuhl1978; Wang & Xu Reference Wang and Xu2001). Furthermore, for high laser intensities dielectric breakdown on the droplet surface can lead to the generation of a shock waves inside the droplet (Zhang et al. Reference Zhang, Lam, Wood, Chu and Chang1987; Vogel & Parilitz Reference Vogel and Parilitz1996; Lauterborn & Vogel Reference Lauterborn and Vogel2013) or even plasma generation inside a transparent droplet (Lindinger et al. Reference Lindinger, Hagen, Socaciu, Bernhardt, Woste and Leisner2004; Geints et al. Reference Geints, Kabanov, Matvienko, Oshlakov, Zemlyanov, Golik and Bukin2010; Avila & Ohl Reference Avila and Ohl2016). These mechanisms could have a strong influence on the droplet response. Indeed, cavitation phenomena, shock waves and rapid interface acceleration can give rise to fast jetting, bubble collapse and interfacial instabilities (Vogel & Parilitz Reference Vogel and Parilitz1996; Sun et al. Reference Sun, Can, Dijkink and Lohse2009; Thoroddsen et al. Reference Thoroddsen, Takehara, Etoh and Ohl2009; Tagawa et al. Reference Tagawa, Oudalov, Visser, Peters, van der Meer, Sun, Prosperetti and Lohse2012; Avila & Ohl Reference Avila and Ohl2016). The study of these violent, highly nonlinear response regimes is beyond the scope of the present study. Instead, we examine how an ablation pressure pulse is communicated throughout the droplet and triggers droplet deformation.
An important application of laser-induced droplet deformation is found in laser produced plasma light sources to generate extreme ultra violet (EUV) light used for nanolithography (Fujioka et al. Reference Fujioka, Shimomura, Shimada, Maeda, Sakaguchi, Nakai, Aota, Nishimura, Ozaki and Sunahara2008; Banine, Koshelev & Swinkels Reference Banine, Koshelev and Swinkels2011). In these sources small tin droplets are converted into a plasma by a two-stage laser impact process (Banine et al. Reference Banine, Koshelev and Swinkels2011). Upon the first impact, the droplet deforms into a thin flat sheet which is thereafter ionized by a second more powerful laser. A key question to improve this source is how the droplet deformation changes when the laser pulse duration is shortened.
Up to now, the response of a droplet due to a laser impact has been studied by using incompressible hydrodynamics to model the droplet deformation (Klein et al.
Reference Klein, Bouwhuis, Visser, Lhuissier, Sun, Snoeijer, Villermaux, Lohse and Gelderblom2015; Gelderblom et al.
Reference Gelderblom, Lhuissier, Klein, Bouwhuis, Lohse, Villermaux and Snoeijer2016). In these models the interaction of the laser with the droplet is described by an ablation pressure
 $p_{e}$
acting on the surface of the droplet for a duration
 $\unicode[STIX]{x1D70F}_{e}$
. The impulse
 $p_{e}\unicode[STIX]{x1D70F}_{e}$
resulting from this ablation pressure causes a momentum transfer to the droplet
 $\unicode[STIX]{x1D70C}_{0}R^{3}U$
, where
 $\unicode[STIX]{x1D70C}_{0}$
is the liquid density,
 $R$
the initial droplet radius and
 $U$
the centre-of-mass speed, which therefore scales as (Gelderblom et al.
Reference Gelderblom, Lhuissier, Klein, Bouwhuis, Lohse, Villermaux and Snoeijer2016)
 $$\begin{eqnarray}U\sim \frac{p_{e}\unicode[STIX]{x1D70F}_{e}}{\unicode[STIX]{x1D70C}_{0}R}.\end{eqnarray}$$
The deformation in these incompressible models is calculated by a pressure impulse approach that is also used for studies on the impact of liquid bodies onto solids (Batchelor Reference Batchelor1967; Cooker & Peregrine Reference Cooker and Peregrine1995; Antkowiak et al.
Reference Antkowiak, Bremond, le Dizes and Villermaux2007). As long as the duration of the ablation pressure is long compared to the acoustic time scale
 $R/c$
, where
 $c$
is the speed of sound inside the droplet, and the amplitude
 $p_{e}$
is such that no shockwaves are created, the droplet response can be considered incompressible (Gelderblom et al.
Reference Gelderblom, Lhuissier, Klein, Bouwhuis, Lohse, Villermaux and Snoeijer2016). For example, for classical droplet impact onto a solid the deformation time scale
 $\unicode[STIX]{x1D70F}_{i}=R/U$
is of the same order as the impact duration
 $\unicode[STIX]{x1D70F}_{e}$
which is much longer than
 $R/c$
(see e.g. Clanet et al.
Reference Clanet, Beguin, Richard and Quere2004; Josserand & Thoroddsen Reference Josserand and Thoroddsen2016), as illustrated in figure 1(c).
By contrast, the impact of a laser pulse provides a means to shorten the duration of the ablation pressure considerably, and thereby to transfer the same amount of momentum
 $p_{e}\unicode[STIX]{x1D70F}_{e}$
to the droplet in a shorter time. The ablation pressure duration can for example be decreased by increasing the laser pulse energy to move to the plasma-mediated ablation regime, which leads to more violent and shorter lived ablation pressures (Kurilovich et al.
Reference Kurilovich, Klein, Torretti, Lassise, Hoekstra, Ubachs, Gelderblom and Versolato2016), as illustrated in figure 1(a). A further decrease of the ablation pressure duration can be obtained by directly shortening the laser pulse duration (Chichkov et al.
Reference Chichkov, Momma, Nolte, von Alvensleben and Tunnermann1996). In these cases
 $\unicode[STIX]{x1D70F}_{e}$
is shortened significantly such that it becomes comparable to or even smaller than
 $R/c$
such that the droplet response is compressible and incompressible models breakdown. We note that for laser-induced ablation
 $\unicode[STIX]{x1D70F}_{e}\ll \unicode[STIX]{x1D70F}_{i}$
such that the droplet remains undeformed during impact (Gelderblom et al.
Reference Gelderblom, Lhuissier, Klein, Bouwhuis, Lohse, Villermaux and Snoeijer2016). Indeed, in figure 1(b) we observe that the mist cloud resulting from mass ablation acts on the surface of an undeformed droplet.
In this paper we study the response of a droplet to a short ablation pressure acting on its surface. In particular, we focus on the question how the droplet deformation dynamics depends on the ablation pressure duration at fixed impulse in the regime where
 $\unicode[STIX]{x1D70F}_{e}\lesssim R/c$
. Hence we consider the situation where the pressure field inside the droplet is not yet established during the pressure pulse and the droplet response is no longer incompressible. To this end, we develop a linearly compressible analytic model for the droplet response to short pressure pulses. In § 2 we introduce the analytic model and discuss the regime in which it applies. In § 3 we first compare our analytic results to a compressible lattice Boltzmann simulation. Next we use the analytic model to study the effects of shortening the pulse duration at constant impulse on the pressure, pressure impulse, velocity and deformation fields of the droplet.
2 Problem formulation and methods
In this section we derive a model to describe the spatio-temporal response of a droplet to an ablation pressure acting on its surface. In § 2.1 we provide a scaling analysis to delineate three different regimes in the response of the droplet to this pressure pulse. Analytic expressions for the pressure and velocity fields inside the droplet as function of the pressure pulse are derived in § 2.2. Finally in § 2.3 we discuss the lattice Boltzmann method that we use to support our analytic findings.
2.1 Scaling analysis
We consider a spherical droplet with radius
 $R$
and density
 $\unicode[STIX]{x1D70C}_{0}$
that is subjected to an ablation pressure on the illuminated side with an amplitude
 $p_{e}$
and a duration
 $\unicode[STIX]{x1D70F}_{e}$
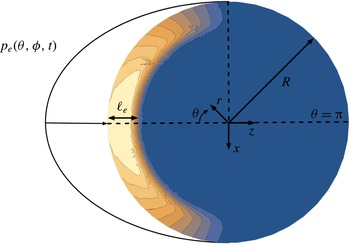
, see figure 2. The total impulse received by the droplet is given by
 $J\sim p_{e}\unicode[STIX]{x1D70F}_{e}$
. In this work we explore the effect of decreasing the pulse duration while keeping the total impulse transferred to the droplet constant; i.e. decreasing
 $\unicode[STIX]{x1D70F}_{e}$
at constant
 $J$
.
Sketch of the problem: an ablation pressure of amplitude
 $p_{e}(\unicode[STIX]{x1D703},\unicode[STIX]{x1D719},t)$
and duration
 $\unicode[STIX]{x1D70F}_{e}$
acts on the surface of a droplet with radius
 $R$
. As a result, a pressure field is induced inside the droplet over a depth
 $\ell _{e}\sim c\unicode[STIX]{x1D70F}_{e}$
. The colour bar denotes the pressure amplitude (blue is ambient and yellow is peak pressure). The spherical coordinate system (
 $r$
,
 $\unicode[STIX]{x1D703}$
,
 $\unicode[STIX]{x1D719}$
) used is indicated (the azimuthal angle
 $\unicode[STIX]{x1D719}$
is not shown but rotates around the
 $z$
-axis).

During the pulse the pressure disturbance on the surface of the droplet penetrates over a length scale
 $\ell _{e}\sim c\unicode[STIX]{x1D70F}_{e}$
, where
 $c$
is the speed of sound in the droplet. If
 $\ell _{e}$
is short compared to
 $R$
all momentum is initially concentrated inside a thin layer, as is illustrated in figure 2. By contrast, if
 $\ell _{e}>R$
, all fluid inside the droplet has experienced a change in momentum directly after the pulse. The ratio between
 $\ell _{e}$
and
 $R$
is quantified by the acoustic Strouhal number and is a dimensionless pressure pulse duration
 $$\begin{eqnarray}St=\frac{\ell _{e}}{R}=\frac{c\unicode[STIX]{x1D70F}_{e}}{R}.\end{eqnarray}$$
To investigate the effect of short pulse durations, we are interested in the limit
 $St\lesssim 1$
.
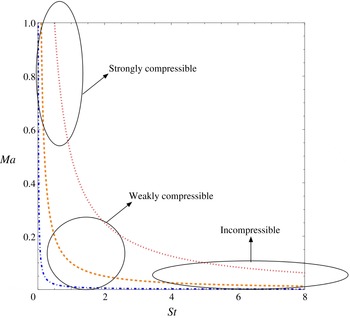
A phase diagram showing lines of constant impulse transfer to the droplet. The blue dotted-dashed line is the isoline
 $St\,Ma=0.01$
, the orange dashed line is the isoline
 $St\,Ma=0.1$
and the red dotted line is the isoline
 $St\,Ma=0.5$
. The plot shows three distinct regimes can be observed at constant impulse: a strongly compressible regime, a weakly compressible regime and an incompressible regime. The weakly compressible regime is the focus of the present work.

When
 $\unicode[STIX]{x1D70F}_{e}$
is decreased at constant
 $J$
,
 $p_{e}$
rises. From momentum conservation in this thin layer it follows that the typical velocity induced inside
 $\ell _{e}$
is given by
 $u_{e}\sim p_{e}/(\unicode[STIX]{x1D70C}_{0}c)$
, where
 $\unicode[STIX]{x1D70C}_{0}$
is the density of the liquid droplet. Hence we observe that a large
 $p_{e}$
induces large velocities in
 $\ell _{e}$
, which is quantified by the acoustic Mach number and is a dimensionless pressure pulse amplitude
 $$\begin{eqnarray}Ma=\frac{u_{e}}{c}=\frac{p_{e}}{p_{0}},\end{eqnarray}$$
where
 $p_{0}=\unicode[STIX]{x1D70C}_{0}c^{2}$
is the base pressure of the droplet. When
 $Ma$
is large the fluid response inside the droplet is nonlinear and shock waves dominate the flow. If
 $Ma$
small, the flow inside the droplet can be considered linear.
The product
 $Ma\,St$
sets the total dimensionless impulse received by the droplet
 $$\begin{eqnarray}St\,Ma=\frac{p_{e}\unicode[STIX]{x1D70F}_{e}}{\unicode[STIX]{x1D70C}_{0}Rc}=\frac{U}{c},\end{eqnarray}$$
where (1.1) is used to express the centre-of-mass velocity
 $U$
of the droplet as whole. This product is often referred to as the global Mach number of the droplet.
One can use
 $Ma$
and
 $St$
to delineate different regimes in the droplet response, as illustrated in figure 3. For lines of constant
 $Ma\,St$
(hence constant impulse), we can identify three regimes. Firstly, when
 $St$
is small and
 $Ma$
is large, we are in a strongly compressible regime where nonlinear advective acceleration and nonlinear viscous dampening need to be taken into account to describe the flow. Secondly, for intermediate
 $Ma$
and
 $St$
, compressible effects are important but nonlinear effects are small, which renders this regime analytically accessible. This regime, which we term the weakly compressible regime, will be the main focus of this paper. Finally, when
 $St\gg 1$
and
 $Ma\ll 1$
, we enter the incompressible regime that was subject of previous studies where long pulse durations (large
 $St$
) were considered (Gelderblom et al.
Reference Gelderblom, Lhuissier, Klein, Bouwhuis, Lohse, Villermaux and Snoeijer2016). This regime is also relevant to droplet impact studies on rigid surfaces, see e.g. Richard, Clanet & Quere (Reference Richard, Clanet and Quere2002), Clanet et al. (Reference Clanet, Beguin, Richard and Quere2004), Yarin (Reference Yarin2006), Josserand & Thoroddsen (Reference Josserand and Thoroddsen2016), Philippi, Lagree & Antkowiak (Reference Philippi, Lagree and Antkowiak2016), Wildeman et al. (Reference Wildeman, Visser, Sun and Lohse2016).
2.2 The weakly compressible model
The compressible flow equations are given by (Batchelor Reference Batchelor1967, p. 164)
 $$\begin{eqnarray}\displaystyle & \displaystyle \frac{\unicode[STIX]{x2202}\unicode[STIX]{x1D70C}}{\unicode[STIX]{x2202}t}+(\unicode[STIX]{x1D735}\boldsymbol{\cdot }\unicode[STIX]{x1D70C}\boldsymbol{u})=0, & \displaystyle\end{eqnarray}$$
 $$\begin{eqnarray}\displaystyle & \displaystyle \unicode[STIX]{x1D70C}\left(\frac{\unicode[STIX]{x2202}\boldsymbol{u}}{\unicode[STIX]{x2202}t}+\boldsymbol{u}\boldsymbol{\cdot }\unicode[STIX]{x1D735}\boldsymbol{u}\right)=-\unicode[STIX]{x1D735}p+\unicode[STIX]{x1D707}\unicode[STIX]{x1D6FB}^{2}\boldsymbol{u}+\left(\unicode[STIX]{x1D705}+\frac{1}{3}\unicode[STIX]{x1D707}\right)\unicode[STIX]{x1D735}(\unicode[STIX]{x1D735}\boldsymbol{\cdot }\boldsymbol{u}), & \displaystyle\end{eqnarray}$$
where
 $\unicode[STIX]{x1D70C}$
is the density field,
 $\boldsymbol{u}$
the velocity field,
 $p$
the thermodynamic pressure,
 $\unicode[STIX]{x1D707}$
is the shear viscosity coefficient and
 $\unicode[STIX]{x1D705}$
the expansion viscosity coefficient. In this work we only focus on the flow inside the droplet and we do not consider the flow of the outer gas phase, since for typical experimental situations (tin droplet in vacuum and water droplet in air):
 $\unicode[STIX]{x1D70C}_{g}/\unicode[STIX]{x1D70C}_{l}\ll 1$
and
 $\unicode[STIX]{x1D707}_{g}/\unicode[STIX]{x1D707}_{l}\ll 1$
(Klein et al.
Reference Klein, Bouwhuis, Visser, Lhuissier, Sun, Snoeijer, Villermaux, Lohse and Gelderblom2015; Kurilovich et al.
Reference Kurilovich, Klein, Torretti, Lassise, Hoekstra, Ubachs, Gelderblom and Versolato2016). In order to find a closed analytic expression for the pressure and velocity field inside the droplet, we will first need to simplify (2.4) and (2.5) and finally solve the system obtained with appropriate surface boundary conditions for the droplet.
In the weakly compressible regime, i.e. for intermediate
 $Ma$
,
 $St$
(see figure 3), we can expand the pressure
 $p$
, density
 $\unicode[STIX]{x1D70C}$
and velocity
 $\boldsymbol{u}$
inside the droplet as a constant plus a small time-dependent part, analogous to Batchelor (Reference Batchelor1967, p. 166)
 $$\begin{eqnarray}\left.\begin{array}{@{}c@{}}\displaystyle p(\boldsymbol{x},t)=p_{0}+p_{1}(\boldsymbol{x},t),\\ \displaystyle \unicode[STIX]{x1D70C}(\boldsymbol{x},t)=\unicode[STIX]{x1D70C}_{0}+\unicode[STIX]{x1D70C}_{1}(\boldsymbol{x},t),\\ \displaystyle \boldsymbol{u}(\boldsymbol{x},t)=\boldsymbol{u}_{1}(\boldsymbol{x},t),\end{array}\right\}\end{eqnarray}$$
where
 $t$
is the time,
 $\boldsymbol{x}=(r,\unicode[STIX]{x1D703},\unicode[STIX]{x1D719})$
are the spherical coordinates defined in figure 2. The thermodynamic pressure can formally be expressed as
 $p=p(\unicode[STIX]{x1D70C},S,T)$
, where
 $S$
is the entropy and
 $T$
is the temperature. In this work however, we neglect any thermoelastic waves that result from thermal expansion due to the local heating of the surface of the droplet. This simplification is supported by typical experiments found in the literature, where both the thermal expansion coefficient and the thermal diffusion coefficient are small (Klein et al.
Reference Klein, Bouwhuis, Visser, Lhuissier, Sun, Snoeijer, Villermaux, Lohse and Gelderblom2015; Kurilovich et al.
Reference Kurilovich, Klein, Torretti, Lassise, Hoekstra, Ubachs, Gelderblom and Versolato2016). We do note that with increasing laser intensity, thermoelastic waves could become increasingly important (Sigrist & Kneubuhl Reference Sigrist and Kneubuhl1978; Wang & Xu Reference Wang and Xu2001). However, this is typically accompanied by an increase in the acoustic Mach number which is outside the scope of this work. Following these simplifications, we can write a basic equation of state for the fluid inside the droplet
 $$\begin{eqnarray}p(\boldsymbol{x},t)=p_{0}+c^{2}\unicode[STIX]{x1D70C}_{1}(\boldsymbol{x},t),\end{eqnarray}$$
where
 $c$
is the speed of sound and
 $p_{0}=c^{2}\unicode[STIX]{x1D70C}_{0}$
is the ideal base pressure of the stationary droplet. Since we are interested in the flow directly after the pulse we introduce the following non-dimensionalization, following the scaling analysis of the previous paragraph
 $$\begin{eqnarray}\boldsymbol{u}=\frac{p_{e}}{\unicode[STIX]{x1D70C}_{0}c}\tilde{\boldsymbol{u}},\quad \boldsymbol{x}=R\tilde{\boldsymbol{x}},\quad t=\unicode[STIX]{x1D70F}_{e}\tilde{t},\quad p=p_{e}\tilde{p},\quad \unicode[STIX]{x1D70C}=\frac{p_{e}}{c^{2}}\tilde{\unicode[STIX]{x1D70C}},\end{eqnarray}$$
where the tildes refer to the dimensionless parameters. From now on we drop the tildes and work with the dimensionless parameters. A consistent approximation of (2.4) and (2.5) is given by the system (Blackstock Reference Blackstock2000, p. 97)
 $$\begin{eqnarray}\displaystyle & \displaystyle \frac{\unicode[STIX]{x2202}p_{1}}{\unicode[STIX]{x2202}t}+St(\unicode[STIX]{x1D735}\boldsymbol{\cdot }\boldsymbol{u}_{1})=0, & \displaystyle\end{eqnarray}$$
 $$\begin{eqnarray}\displaystyle & \displaystyle \frac{1}{St}\frac{\unicode[STIX]{x2202}\boldsymbol{u}_{1}}{\unicode[STIX]{x2202}t}=-\unicode[STIX]{x1D735}p_{1}+\frac{1}{Re}\unicode[STIX]{x1D6FB}^{2}\boldsymbol{u}_{1}+\frac{1}{Re_{v}}\unicode[STIX]{x1D735}(\unicode[STIX]{x1D735}\boldsymbol{\cdot }\boldsymbol{u}_{1}), & \displaystyle\end{eqnarray}$$
where
 $Re=\unicode[STIX]{x1D70C}_{0}Rc/\unicode[STIX]{x1D707}$
is the Reynolds number with
 $\unicode[STIX]{x1D707}$
the dynamic viscosity and
 $Re_{v}=\unicode[STIX]{x1D70C}_{0}Rc/((\unicode[STIX]{x1D707}+\unicode[STIX]{x1D705})/3)$
the Reynolds number for volume changes, where
 $\unicode[STIX]{x1D705}$
is the bulk viscosity. Although the Reynolds number in experiments is typically large (
 $Re\sim 10^{3}$
) we will see later on that we need to retain the viscous terms in (2.10) to overcome singularities when converging pressure waves superimpose in the centre of the droplet. In the high Reynolds regime viscous effects however do not influence the droplet deformation, which was already reported in a previous incompressible and inviscid model by Gelderblom et al. (Reference Gelderblom, Lhuissier, Klein, Bouwhuis, Lohse, Villermaux and Snoeijer2016). We note that there is no explicit dependence on the acoustic Mach number in (2.9) and (2.10), since this is a low-order Mach expansion of the compressible Navier–Stokes equations and we scaled all our fields accordingly (2.8). By taking the divergence of (2.10) and using (2.9) we obtain a viscous wave equation for the acoustic field inside the droplet
 $$\begin{eqnarray}\frac{\unicode[STIX]{x2202}^{2}p_{1}}{\unicode[STIX]{x2202}t^{2}}-St^{2}\unicode[STIX]{x1D6FB}^{2}p_{1}=\frac{1}{Re_{a}}\left[\unicode[STIX]{x1D6FB}^{2}\frac{\unicode[STIX]{x2202}p_{1}}{\unicode[STIX]{x2202}t}\right],\end{eqnarray}$$
where
 $1/Re_{a}=St(1/Re+1/Re_{v})$
is an effective Reynolds number for the viscous dissipation in the acoustic wave (Blackstock Reference Blackstock2000, p. 97). Below we describe how this equation for
 $p_{1}(\boldsymbol{x},t)$
is solved for the problem at hand. In § 2.2.2 we show how the velocity field
 $\boldsymbol{u}_{1}(\boldsymbol{x},t)$
can be computed once
 $p_{1}(\boldsymbol{x},t)$
is known.
2.2.1 The pressure field
We solve (2.11) subject to a pressure boundary condition on the droplet surface. At the interface of the droplet the stresses between the liquid and the gas phase must be continuous. We assume that the magnitude of the pressure variations in the gas phase are much smaller than those inside the droplet. For typical experiments (Klein et al.
Reference Klein, Bouwhuis, Visser, Lhuissier, Sun, Snoeijer, Villermaux, Lohse and Gelderblom2015; Kurilovich et al.
Reference Kurilovich, Klein, Torretti, Lassise, Hoekstra, Ubachs, Gelderblom and Versolato2016) this assumption is justified since the density and the viscosity of the gas phase are much smaller. As a result, the stress condition on the interface significantly simplifies since the pressure in the gas phase may be considered constant and equal to
 $p_{0}$
. As a consequence, the time-dependent part of the pressure at the surface of the droplet must satisfy
 $$\begin{eqnarray}p_{1}(1,\unicode[STIX]{x1D703},\unicode[STIX]{x1D719},t)=0,\end{eqnarray}$$
to ensure that all acoustic energy remains inside the droplet. Furthermore we assumed that the interface remains immobile and therefore the droplet spherical during the pulse. This latter assumption is justified when the pulse duration
 $\unicode[STIX]{x1D70F}_{e}$
is much smaller than the typical interface deformation time scale
 $\unicode[STIX]{x1D70F}_{int}=R/u_{e}$
, or in dimensionless form
 $St\,Ma\ll 1$
. Typically in experiments
 $St\,Ma\sim 10^{-2}-10^{-1}$
. An ablation pressure acting on the surface of the droplet is introduced through a Green’s function formalism (Morse & Feshbach Reference Morse and Feshbach1953, chap. 7). The general solution for the spatio-temporal pressure field inside the droplet is given by
 $$\begin{eqnarray}\displaystyle p_{1}(\boldsymbol{x},t) & = & \displaystyle \iiint _{V}\left[\frac{\unicode[STIX]{x2202}G(\boldsymbol{x},t;\boldsymbol{x}_{0},t_{0})}{\unicode[STIX]{x2202}t_{0}}p_{1}(\boldsymbol{x}_{0},t_{0})\right.\nonumber\\ \displaystyle & & \displaystyle \left.\left.-\,\left(\frac{\unicode[STIX]{x2202}p_{1}(\boldsymbol{x}_{0},t_{0})}{\unicode[STIX]{x2202}t_{0}}-\frac{p_{1}(\boldsymbol{x}_{0},t_{0})}{Re_{a}}\unicode[STIX]{x1D6FB}_{\boldsymbol{x}_{0}}^{2}\right)G(\boldsymbol{x},t;\boldsymbol{x}_{0},t_{0})\right]\right|_{t_{0}=0}^{t^{+}}\,\text{d}V_{0}\nonumber\\ \displaystyle & & \displaystyle +\,\int _{0}^{t^{+}}\,\text{d}t_{0}\oint _{S}\left[G(\boldsymbol{x},t;\boldsymbol{x}_{0},t_{0})\left(St^{2}\unicode[STIX]{x1D735}_{\boldsymbol{x}_{0}}p_{1}(\boldsymbol{x}_{0},t_{0})+\frac{1}{Re_{a}}\unicode[STIX]{x1D735}_{\boldsymbol{x}_{0}}\frac{\unicode[STIX]{x2202}p_{1}(\boldsymbol{x}_{0},t_{0})}{\unicode[STIX]{x2202}t_{0}}\right)\right.\nonumber\\ \displaystyle & & \displaystyle \left.-\,\unicode[STIX]{x1D735}_{\boldsymbol{x}_{0}}G(\boldsymbol{x},t;\boldsymbol{x}_{0},t_{0})\left(St^{2}p_{1}(\boldsymbol{x}_{0},t_{0})+\frac{1}{Re_{a}}\frac{\unicode[STIX]{x2202}p_{1}(\boldsymbol{x}_{0},t_{0})}{\unicode[STIX]{x2202}t_{0}}\right)\right]\boldsymbol{\cdot }\boldsymbol{n}\,\text{d}S_{0},\end{eqnarray}$$
where
 $G(\boldsymbol{x},t;\boldsymbol{x}_{0},t_{0})$
is the Green’s function satisfying
 $$\begin{eqnarray}\frac{\unicode[STIX]{x2202}^{2}G(\boldsymbol{x},t;\boldsymbol{x}_{0},t_{0})}{\unicode[STIX]{x2202}t^{2}}-St^{2}\unicode[STIX]{x1D6FB}^{2}G(\boldsymbol{x},t;\boldsymbol{x}_{0},t_{0})-\frac{1}{Re_{a}}\left[\unicode[STIX]{x1D6FB}^{2}\frac{\unicode[STIX]{x2202}G(\boldsymbol{x},t;\boldsymbol{x}_{0},t_{0})}{\unicode[STIX]{x2202}t}\right]=\unicode[STIX]{x1D6FF}(\boldsymbol{x}-\boldsymbol{x}_{0})\unicode[STIX]{x1D6FF}(t-t_{0}),\end{eqnarray}$$
where we use a spherical coordinate system for
 $\boldsymbol{x}$
and
 $\boldsymbol{x}_{0}$
. To find the general solution to (2.14), we first define a Fourier transformation
 $$\begin{eqnarray}\displaystyle & \displaystyle {\hat{G}}(\boldsymbol{x},\unicode[STIX]{x1D714};\boldsymbol{x}_{0},t_{0})=\int _{-\infty }^{\infty }G(\boldsymbol{x},t;\boldsymbol{x}_{0},t_{0})\exp (-\text{i}\unicode[STIX]{x1D714}t)\,\text{d}t, & \displaystyle\end{eqnarray}$$
 $$\begin{eqnarray}\displaystyle & \displaystyle G(\boldsymbol{x},t;\boldsymbol{x}_{0},t_{0})=\frac{1}{2\unicode[STIX]{x03C0}}\int _{-\infty }^{\infty }{\hat{G}}(\boldsymbol{x},\unicode[STIX]{x1D714};\boldsymbol{x}_{0},t_{0})\exp (\text{i}\unicode[STIX]{x1D714}t)\,\text{d}\unicode[STIX]{x1D714}. & \displaystyle\end{eqnarray}$$
Using (2.15), (2.14) can now be transformed into a Helmholtz equation
 $$\begin{eqnarray}-\unicode[STIX]{x1D714}^{2}{\hat{G}}(\boldsymbol{x},\unicode[STIX]{x1D714};\boldsymbol{x}_{0},t_{0})-\left(St^{2}+\frac{\text{i}\unicode[STIX]{x1D714}}{Re_{a}}\right)\unicode[STIX]{x1D6FB}^{2}{\hat{G}}(\boldsymbol{x},t;\boldsymbol{x}_{0},t_{0})=\unicode[STIX]{x1D6FF}(\boldsymbol{x}-\boldsymbol{x}_{0})\exp (-\text{i}\unicode[STIX]{x1D714}t_{0}),\end{eqnarray}$$
where
 $\text{i}$
is the imaginary unit. A general solution to this equation can be found by expanding Green’s function into eigenfunctions, resulting in
 $$\begin{eqnarray}\displaystyle G(r,\unicode[STIX]{x1D703},\unicode[STIX]{x1D719},t;r_{0},\unicode[STIX]{x1D703}_{0},\unicode[STIX]{x1D719}_{0},t_{0}) & = & \displaystyle \mathop{\sum }_{nlm}\unicode[STIX]{x1D713}_{nl}^{m}(r,\unicode[STIX]{x1D703},\unicode[STIX]{x1D719})\unicode[STIX]{x1D713}_{nl}^{m}(r_{0},\unicode[STIX]{x1D703}_{0},\unicode[STIX]{x1D719}_{0})\nonumber\\ \displaystyle & & \displaystyle \times \,\frac{1}{2\unicode[STIX]{x03C0}}\int _{-\infty }^{\infty }\left(\frac{\exp (\text{i}\unicode[STIX]{x1D714}(t-t_{0}))}{St^{2}\unicode[STIX]{x1D6FD}_{nl}^{2}+\displaystyle \frac{\text{i}\unicode[STIX]{x1D714}\unicode[STIX]{x1D6FD}_{nl}^{2}}{Re_{a}}-\unicode[STIX]{x1D714}^{2}}\right)\,\text{d}\unicode[STIX]{x1D714},\end{eqnarray}$$
where
 $\unicode[STIX]{x1D713}_{nl}^{m}(r,\unicode[STIX]{x1D703},\unicode[STIX]{x1D719})$
are the eigenfunctions of the spherical Helmholtz equation
 $$\begin{eqnarray}\unicode[STIX]{x1D713}_{nl}^{m}(r,\unicode[STIX]{x1D703},\unicode[STIX]{x1D719})=\frac{\sqrt{2}j_{l}(\unicode[STIX]{x1D6FD}_{nl}r)Y_{l}^{m}(\unicode[STIX]{x1D703},\unicode[STIX]{x1D719})}{j_{l+1}(\unicode[STIX]{x1D6FD}_{nl})},\end{eqnarray}$$
 $j_{l}$
are the spherical Bessel functions,
 $Y_{l}^{m}$
are the spherical harmonics and
 $\unicode[STIX]{x1D6FD}_{nl}$
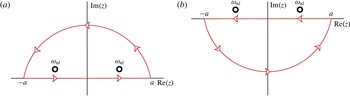
are the zeros of the spherical Bessel functions. To evaluate the inverse Fourier transform (2.16), we use complex contour integration (see figure 4). It can be shown that the contribution of the arc is zero in the limit where the contour radius
 $a\rightarrow \infty$
. Furthermore, there should be no response of an impulse released at
 $t_{0}$
at earlier times
 $t<t_{0}$
(causality condition). To this end, we pick the Jordan curve illustrated in figure 4(a) for
 $t>t_{0}$
and the curve of figure 4(b) for
 $t<t_{0}$
, in the limit
 $a\rightarrow \infty$
. A closed form expression of the Green’s function is now given by
 $$\begin{eqnarray}G(\boldsymbol{x},t;\boldsymbol{x}_{0},t_{0})=\mathop{\sum }_{nlm}\unicode[STIX]{x1D713}_{nl}^{m}(r,\unicode[STIX]{x1D703},\unicode[STIX]{x1D719})\unicode[STIX]{x1D713}_{nl}^{m}(r_{0},\unicode[STIX]{x1D703}_{0},\unicode[STIX]{x1D719}_{0})\exp (-\unicode[STIX]{x1D705}_{nl}(t-t_{0}))\frac{\sin (\unicode[STIX]{x1D702}_{nl}(t-t_{0}))}{\unicode[STIX]{x1D702}_{nl}}{\mathcal{H}}(t-t_{0}),\end{eqnarray}$$
where
 $\unicode[STIX]{x1D705}_{nl}=\unicode[STIX]{x1D6FD}_{nl}^{2}/2Re_{a}$
and
 $\unicode[STIX]{x1D702}_{nl}=(\sqrt{4St^{2}\unicode[STIX]{x1D6FD}_{nl}^{2}-\unicode[STIX]{x1D6FD}_{nl}^{4}/Re_{a}^{2}})/2$
. The resulting spatio-temporal pressure field using (2.13) reads (without any initial condition)
 $$\begin{eqnarray}\displaystyle & & \displaystyle p_{1}(r,\unicode[STIX]{x1D703},\unicode[STIX]{x1D719},t)=\mathop{\sum }_{nl}\unicode[STIX]{x1D6FD}_{nl}\frac{j_{l}(\unicode[STIX]{x1D6FD}_{nl}r)}{j_{l+1}(\unicode[STIX]{x1D6FD}_{nl})}\left(1-\frac{j_{l-1}(\unicode[STIX]{x1D6FD}_{nl})}{j_{l+1}(\unicode[STIX]{x1D6FD}_{nl})}\right)\frac{2l+1}{4\unicode[STIX]{x03C0}}\int _{0}^{2\unicode[STIX]{x03C0}}\int _{0}^{\unicode[STIX]{x03C0}}\int _{0}^{t}\exp (-\unicode[STIX]{x1D705}_{nl}(t-t_{0}))\nonumber\\ \displaystyle & & \displaystyle \quad \times \,\frac{\sin (\unicode[STIX]{x1D702}_{nl}(t-t_{0}))}{\unicode[STIX]{x1D702}_{nl}}{\mathcal{H}}(t-t_{0})P_{l}(\cos \unicode[STIX]{x1D6FE})\left(St^{2}p_{i}(1,\unicode[STIX]{x1D703}_{0},\unicode[STIX]{x1D719}_{0},t_{0})+\frac{1}{Re_{a}}\frac{\unicode[STIX]{x2202}p_{i}(1,\unicode[STIX]{x1D703}_{0},\unicode[STIX]{x1D719}_{0},t_{0})}{\unicode[STIX]{x2202}t_{0}}\right)\nonumber\\ \displaystyle & & \displaystyle \quad \times \,\sin (\unicode[STIX]{x1D703}_{0})\,\text{d}\unicode[STIX]{x1D703}_{0}\,\text{d}\unicode[STIX]{x1D719}_{0}\,\text{d}t_{0},\end{eqnarray}$$
where
 ${\mathcal{H}}$
is the Heaviside theta function,
 $P_{l}$
are the Legendre polynomials and
 $\cos (\unicode[STIX]{x1D6FE})=\cos (\unicode[STIX]{x1D703})\cos (\unicode[STIX]{x1D703}_{0})+\sin (\unicode[STIX]{x1D703})\sin (\unicode[STIX]{x1D703}_{0})\cos (\unicode[STIX]{x1D719}-\unicode[STIX]{x1D719}_{0})$
. In § 3, we will use (2.21) using a particular pressure boundary condition specified by
 $p_{i}(1,\unicode[STIX]{x1D703}_{0},\unicode[STIX]{x1D719}_{0},t_{0})$
. We note that this condition is integrated into the solution at
 $r=1^{-}$
, i.e.
 $r=1-\unicode[STIX]{x1D716}$
where
 $\unicode[STIX]{x1D716}\rightarrow 0$
.
Jordan curves used to evaluate the inverse Fourier transform (2.18) in the complex plane where
 $a\rightarrow \infty$
. (a) Contour used for
 $t>t_{0}$
, which includes the poles. (b) Contour used for
 $t<t_{0}$
to obey the causality condition for the Green’s function.

2.2.2 The velocity field
The velocity field inside the droplet is given by (2.10). Since there is no initial rotation present in the fluid and there are no rotational forces acting at later times, the velocity field remains irrotational and is given by a scalar potential. A straightforward time integral over the pressure gradient (the first term on the right-hand side) based on the spherical Bessel functions (2.21) results in a divergent series. To overcome this problem, we solve the velocity field in a different function basis. To this end, we first define the time integral over the thermodynamic pressure as the pressure impulse
 $$\begin{eqnarray}J_{1}(\boldsymbol{x},t)=\int _{0}^{t}p_{1}(\boldsymbol{x},t^{\prime })\,\text{d}t^{\prime }.\end{eqnarray}$$
The governing equation for the pressure impulse can be obtained by integration of (2.11) in time
 $$\begin{eqnarray}\unicode[STIX]{x1D6FB}^{2}J_{1}=\frac{1}{St^{2}}\frac{\unicode[STIX]{x2202}p_{1}}{\unicode[STIX]{x2202}t}-\frac{1}{St^{2}Re_{a}}\unicode[STIX]{x1D6FB}^{2}p_{1},\end{eqnarray}$$
where we used that both the pressure field
 $p_{1}$
and its derivative vanish at
 $t=0$
. It now becomes apparent that the natural basis functions for the pressure impulse are in fact harmonic functions which results in a convergent series.
The general solution for the pressure impulse inside the droplet is therefore given by
 $$\begin{eqnarray}\displaystyle J_{1}(\boldsymbol{x},t) & = & \displaystyle \iiint _{V}G(\boldsymbol{x};\boldsymbol{x}_{0})\left[\frac{1}{St^{2}}\frac{\unicode[STIX]{x2202}p_{1}(\boldsymbol{x}_{0},t)}{\unicode[STIX]{x2202}t}-\frac{1}{St^{2}Re_{a}}\unicode[STIX]{x1D6FB}^{2}p_{1}(\boldsymbol{x}_{0},t)\right]\,\text{d}V_{0}\nonumber\\ \displaystyle & & \displaystyle -\,\oint _{S}[G(\boldsymbol{x},\boldsymbol{x}_{0})\unicode[STIX]{x1D735}_{\boldsymbol{x}_{0}}J_{1}(\boldsymbol{x}_{0},t)-J_{1}(\boldsymbol{x}_{0},t)\unicode[STIX]{x1D735}_{\boldsymbol{x}_{0}}G(\boldsymbol{x},\boldsymbol{x}_{0})]\boldsymbol{\cdot }\boldsymbol{n}\,\text{d}S_{0},\end{eqnarray}$$
where the Green’s function satisfies the Poisson equation in spherical coordinates
 $$\begin{eqnarray}\unicode[STIX]{x1D6FB}^{2}G(\boldsymbol{x};\boldsymbol{x}_{0})=\unicode[STIX]{x1D6FF}(\boldsymbol{x}-\boldsymbol{x}_{0}).\end{eqnarray}$$
Completely analogous to the boundary conditions on
 $p_{1}$
, the boundary condition on
 $J_{1}$
is
 $J_{1}(1,t)=0$
, which yields
 $$\begin{eqnarray}G(\boldsymbol{x},\boldsymbol{x}_{0})=\frac{1}{4\unicode[STIX]{x03C0}}\left(\frac{1}{\sqrt{r^{2}r_{0}^{2}+1-2rr_{0}\cos (\unicode[STIX]{x1D6FE})}}-\frac{1}{\sqrt{r^{2}+r_{0}^{2}-2rr_{0}\cos (\unicode[STIX]{x1D6FE})}}\right),\end{eqnarray}$$
where
 $\cos (\unicode[STIX]{x1D6FE})=\cos (\unicode[STIX]{x1D703})\cos (\unicode[STIX]{x1D703}_{0})+\sin (\unicode[STIX]{x1D703})\sin (\unicode[STIX]{x1D703}_{0})\cos (\unicode[STIX]{x1D719}-\unicode[STIX]{x1D719}_{0})$
. We evaluate (2.24) numerically using Mathematica 11.1 to speed up the calculations as compared to evaluating (2.24) analytically (Wolfram Research Inc. 2017). The velocity field now reads
 $$\begin{eqnarray}\boldsymbol{u}_{1}(\boldsymbol{x},t)=-St\unicode[STIX]{x1D735}J_{1}(\boldsymbol{x},t)-\left(\frac{1}{Re}+\frac{1}{Re_{\unicode[STIX]{x1D708}}}\right)\unicode[STIX]{x1D735}p_{1},\end{eqnarray}$$
where
 $\boldsymbol{u}_{1}(\boldsymbol{r},0)=\mathbf{0}$
and
 $p_{1}(\boldsymbol{r},0)=0$
.
2.3 The lattice Boltzmann method
To validate our analytic expression for the pressure field inside the droplet, we employ axisymmetric compressible multiphase lattice Boltzmann simulations (Succi Reference Succi2001). Instead of solving the compressible Navier–Stokes equations directly, the numerical method solves a probability distribution function for the position and momentum of particles inside a domain. The evolution of the particle distribution in space and time is given by the Boltzmann equation which is solved numerically on a lattice with a reduced set of velocity vectors. It can be systematically shown that this method is able to correctly solve the fully compressible mass (2.4) and momentum conservation (2.5) equations (Shan, Yuan & Chen Reference Shan, Yuan and Chen2006).
The pressure in our numerical simulation is given by the van der Waals equation of state. This non-ideal equation of state allows us to successfully simulate a liquid–gas system where the interface dynamics is automatically described by the non-ideal pressure. In the vicinity of equilibrium, the van der Waals equation of state behaves as an ideal gas. Therefore, we can directly compare the pressure field inside the droplet with our analytic expression (2.21) in the weakly compressible regime.
Our numerical set-up consists of an initially stationary liquid droplet surrounded by a gas, with a liquid–gas density ratio of
 $\unicode[STIX]{x1D70C}_{l}/\unicode[STIX]{x1D70C}_{g}\sim 170$
. We identify the position of the interface by tracking the derivative of the density field where spikes reveal the location of the interface. We hit our droplet by applying a force directly on the liquid–gas interface. By tuning the amplitude (Mach number) and duration (Strouhal number) of this force, we simulate different regimes in the phase space; see figure 3. Further details on this numerical method can be found in Reijers, Gelderblom & Toschi (Reference Reijers, Gelderblom and Toschi2016).
Unfortunately, the compressible multiphase lattice Boltzmann method lacks the advantages of an adaptive grid refinement technique at the moment of writing. Therefore simulations of higher density ratios of
 $\unicode[STIX]{x1D70C}_{l}/\unicode[STIX]{x1D70C}_{g}>1000$
, simulations in the strongly compressible regime (see figure 3) or even long-time simulations in the weakly compressible regime are not possible. Only early time dynamics can be simulated with the computational resources available to us, which we use to validate the analytic expression for the pressure in the next section.
3 Results
3.1 Acoustic response of a droplet to the ablation pressure
We consider the impact of a uniform laser beam profile on the left side of the droplet (Gelderblom et al. Reference Gelderblom, Lhuissier, Klein, Bouwhuis, Lohse, Villermaux and Snoeijer2016)
 $$\begin{eqnarray}p_{i}(1,\unicode[STIX]{x1D703},\unicode[STIX]{x1D719},t)=\cos (\unicode[STIX]{x1D703}){\mathcal{H}}\left(\frac{\unicode[STIX]{x03C0}}{2}-\unicode[STIX]{x1D703}\right){\mathcal{H}}(1-t),\end{eqnarray}$$
where
 ${\mathcal{H}}$
is the Heaviside function that restricts the pressure profile to the illuminated side of the droplet and limits the duration of the ablation pressure. We note that this boundary condition is only valid for an uniform irradiation along the surface of the droplet, which applies to the experiments described in e.g. Kurilovich et al. (Reference Kurilovich, Klein, Torretti, Lassise, Hoekstra, Ubachs, Gelderblom and Versolato2016). In the case of a focused beam hitting the droplet a Gaussian pressure profile with an appropriate spot size might be preferred, which has been studied extensively in the incompressible limit by Gelderblom et al. (Reference Gelderblom, Lhuissier, Klein, Bouwhuis, Lohse, Villermaux and Snoeijer2016). We use (3.1) in all results presented below. The analytic pressure field (2.21) subject to (3.1) is given by
 $$\begin{eqnarray}\displaystyle p_{1}(r,\unicode[STIX]{x1D703},\unicode[STIX]{x1D719},t) & = & \displaystyle St^{2}\mathop{\sum }_{nl}\unicode[STIX]{x1D6FD}_{nl}\frac{j_{l}(\unicode[STIX]{x1D6FD}_{nl}r)}{j_{l+1}(\unicode[STIX]{x1D6FD}_{nl})}\left(1-\frac{j_{l-1}(\unicode[STIX]{x1D6FD}_{nl})}{j_{l+1}(\unicode[STIX]{x1D6FD}_{nl})}\right)\frac{2l+1}{4\unicode[STIX]{x03C0}}\int _{0}^{2\unicode[STIX]{x03C0}}\int _{0}^{\unicode[STIX]{x03C0}}\int _{0}^{t}\nonumber\\ \displaystyle & & \displaystyle \times \,\exp (-\unicode[STIX]{x1D705}_{nl}(t-t_{0}))\frac{\sin (\unicode[STIX]{x1D702}_{nl}(t-t_{0}))}{\unicode[STIX]{x1D702}_{nl}}\nonumber\\ \displaystyle & & \displaystyle \times \,{\mathcal{H}}(t-t_{0}){\mathcal{H}}(1-t_{0})P_{l}(\cos \unicode[STIX]{x1D6FE})\cos (\unicode[STIX]{x1D703}_{0}){\mathcal{H}}\left(\frac{\unicode[STIX]{x03C0}}{2}-\unicode[STIX]{x1D703}_{0}\right)\sin (\unicode[STIX]{x1D703}_{0})\,\text{d}\unicode[STIX]{x1D703}_{0}\,\text{d}\unicode[STIX]{x1D719}_{0}\,\text{d}t_{0}\nonumber\\ \displaystyle & & \displaystyle\end{eqnarray}$$
for
 $t<1$
.
The pressure field
 $p_{1}(r,\unicode[STIX]{x1D703})$
inside the droplet at different times for an ablation pressure (3.1) impacting from the left side with a dimensionless duration
 $St\approx 6.02$
. The top row shows the analytic results (plotted up to
 $r=0.95$
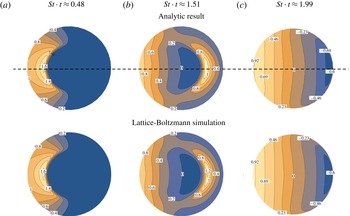
to restrict the number of Fourier modes required). The bottom row shows the results of the lattice Boltzmann simulations, which are in excellent agreement with the analytics. The black dashed line illustrates the centreline axis used to plot the results in figure 6.

Comparison between the analytic pressure
 $p_{1}(r,0)$
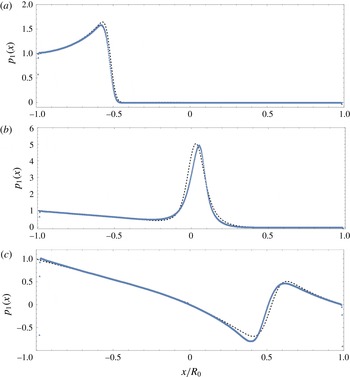
(black dotted curve) and the lattice Boltzmann simulation (blue triangles) along the centreline of the droplet (see figure 5) at different times for
 $St=6.02$
. (a) For
 $St\cdot t=0.48$
the waves are travelling towards the centre of the droplet, (b) for
 $St\cdot t=1.02$
the waves just passed the centre of the droplet and (c) for
 $St\cdot t=2.47$
the waves have reflected on the right interface of the droplet and are travelling back towards the left.

In figure 5 we show a comparison between (3.2) and the lattice Boltzmann simulations at different times, for
 $St=6.02$
and
 $Ma\ll 1$
. In order to obtain the analytic plots we used
 $Re_{a}\sim 200$
,
 $l=20$
and
 $n=500$
. The same parameter values will be used for all results in the remainder of this paper. Initially, the pressure disturbance on the surface of the droplet sends out a radially expanding wave for all source points on the boundary inside the droplet (figure 5
a) which then propagates (figure 5
b) to the right side (figure 5
c). During the propagation, the superposition of all the waves inside the droplet gives rise to a non-trivial pressure distribution, see figure 5(b,c). Note that a negative value for
 $p_{1}$
does not necessarily mean a negative pressure since the total pressure is given by (2.6). The figures show a good qualitative agreement between the analytic model (top row) and the simulated droplet (bottom row).
A quantitative comparison of the pressure profiles along the centreline is given in figure 6. Here, we plotted the pressure field as it passes through the centre of the droplet (figure 6 b) and after the reflection on the right interface (figure 6 c). We observe good quantitative agreement between the analytic results and the simulation, also after wave reflection (figure 6 c) which confirms the validity of boundary condition (2.12).
Some small discrepancies can be observed in both figures 5 and 6. In the lattice Boltzmann simulation, the speed of sound is not constant but depends on the local pressure due to the nonlinear nature of the van der Waals equation of state. In the limit where pressure fluctuations are small, the speed of sound is almost constant however when a pressure wave passes through the centre the pressure increases considerably. These small changes in speed of sound lead to small discrepancies in comparison to the analytic model where the speed of sound is constant. Furthermore, in the simulation a finite density jump is used. Therefore, a small amount of acoustic energy could be transmitted to the gas phase when a pressure wave hits the interface.
3.2 The effect of the pulse duration on the droplet response
We now address how the droplet response depends on the ablation pressure amplitude (
 $Ma$
) and duration (
 $St$
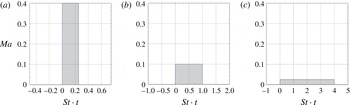
), while the total momentum transfer to the droplet remains constant. To this end, we compare the droplet response to the three types of pulses that are illustrated in figure 7. In the first case (figure 7
a) the duration of the ablation pressure is much smaller than the time it takes for a pressure wave to travel through the droplet (
 $St=0.25$
,
 $Ma=0.4$
). In the second case (figure 7
b) the duration of the pulse is exactly equal to the time it takes to travel over a distance of one droplet radius (
 $St=1$
,
 $Ma=0.1$
). Finally (figure 7
c) defines a pulse duration that is much longer than the acoustic time scale of the droplet (
 $St=4$
,
 $Ma=0.025$
). In all three cases, the total momentum transfer to the droplet is constant and equal to
 $St\,Ma=0.1$
. Below, we discuss the differences in the pressure field (§ 3.2.1), pressure impulse field and velocity field inside the droplet (§ 3.2.2) and eventually the droplet deformation dynamics (§ 3.2.3) for these three different pulses.
Three ablation pressure pulses of different duration but constant impulse (
 $Ma\,St=0.1$
). (a) A short pulse with a duration
 $St=0.25$
and amplitude
 $Ma=0.4$
, (b) an intermediate pulse duration
 $St=1$
and
 $Ma=0.1$
and (c) a long pulse duration
 $St=4$
and
 $Ma=0.025$
.

3.2.1 Pressure field
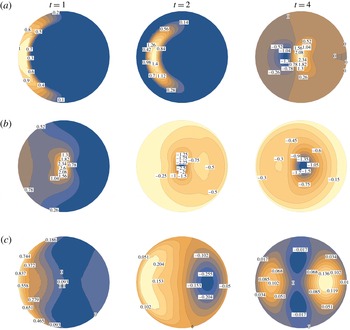
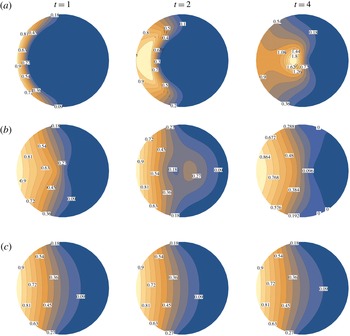
Figure 8 shows the spatio-temporal pressure field inside the droplet that is induced by the three pressure pulses discussed in figure 7. For a short pulse duration, most of the pressure field is initially (i.e. at
 $t=1$
) localized in a small compression zone (figure 8
a). We note that when
 $t=1$
, all plots are drawn exactly after the pulse in figure 8. This zone is the result of the superposition of radial compression waves emitted from source points on the interface. During the propagation (
 $t=2$
), the superposition of these waves leads to a highly compressed spot in the centre, which is clearly visible at
 $t=4$
. At later times (not shown in the figure) the compression waves reach the right interface of the droplet where they reflect and give rise to an expansion zone. Meanwhile, waves radiated from point sources on the droplet surface continuously reflect on neighbouring surface points leading to expansion waves. The amplitude of these expansion waves however are so small that they only become visible in the plot at
 $t=4$
, see figure 8(a). We note that the absolute pressure is not negative, since the absolute pressure is given by (2.6).
The pressure field
 $p_{1}$
inside the droplet for the three different cases illustrated in figure 7: (a)
 $St=0.25$
, (b)
 $St=1$
and (c)
 $St=4$
. The results are depicted for different times: at the end of the pulse (
 $t=1$
), at two times the pulse duration (
 $t=2$
) and at four times the pulse duration (
 $t=4$
). We note that the colour bar scale is not fixed and that all fields are scaled with
 $p_{e}$
. The compression wave is followed by an expansion after the pulse, which is not visible in panel (a) at
 $t=2$
, since its amplitude is negligibly small at this time instant.

The pressure field for intermediate pulse duration is illustrated in figure 8(b). At the end of the pulse (
 $t=1$
) the waves have travelled a distance
 $R$
. Again a compression zone is created in the centre, followed by an expansion zone (
 $t=2$
). At
 $t=4$
, all waves have at least reflected once on the interface of the droplet which gives rise to another large expansion zone. For a long pulse (figure 8
c) the pressure field has spread over the entire droplet. The superposition of all compression and expansion waves lead to a non-trivial field that consists of compression and expansion zones.
To summarize, we observe more localized fluctuations in the pressure field directly after a short pulse as compared to longer pulses. As we will demonstrate below, these fluctuations have an important effect on how the impulse is distributed over time and hence on the resulting velocity field inside the droplet.
3.2.2 Pressure impulse and velocity fields
Figure 9 shows the spatio-temporal pressure impulse field (2.22) inside the droplet for the three pulse durations. To obtain the plots, we evaluate (2.24) numerically. This scalar field is an important field in our analysis, since it describes the spatio-temporal distribution of momentum inside the droplet and the velocity field (2.27) is derived from it, as discussed in § 2.2.2. Note that in all cases the total momentum inside the droplet is constant as soon as the pulse is over, at
 $t=1$
, while the distribution of the momentum can still change in time.
The pressure impulse field
 $J_{1}$
inside the droplet for the three different pulse durations illustrated in figure 7: (a)
 $St=0.25$
, (b)
 $St=1$
and (c)
 $St=4$
. The results are depicted for different times: at the end of the pulse (
 $t=1$
), at two times the pulse duration (
 $t=2$
) and at four times the pulse duration (
 $t=4$
). Note that the colour bar scale is not fixed and that all fields are scaled with
 $p_{e}\unicode[STIX]{x1D70F}_{e}$
.

For a short pulse duration the momentum distribution changes significantly in time, see figure 9(a). Initially all momentum is concentrated on the left side of the droplet, while it redistributes itself throughout the droplet at later times. As we will show below, this localized momentum distribution results in a stronger interface deformation for short pulses. As the pulse duration increases (figure 9
b) the time variation of the momentum distribution becomes smaller. This effect is most prominent for long pulses (figure 9
c) where the momentum distribution is almost constant after
 $t=1$
. In the limit
 $St\rightarrow \infty$
(and consequently
 $Ma\rightarrow 0$
to keep the impulse finite) the pressure impulse is constant in time which corresponds to an incompressible flow.
The
 $\unicode[STIX]{x1D703}$
component of the velocity field inside the droplet at
 $r=0.5$
. The left column represents early times (
 $t\sim 1$
) while the right column represents late times (
 $t\gg 1$
). (a) A short pulse duration
 $St=0.25$
, (b) an intermediate pulse duration
 $St=1$
and (c) a long pulse duration
 $St=4$
. The black dashed line denotes the incompressible velocity field by Gelderblom et al. (Reference Gelderblom, Lhuissier, Klein, Bouwhuis, Lohse, Villermaux and Snoeijer2016).

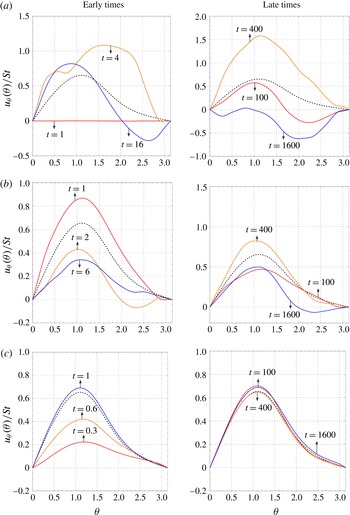
The velocity field (2.27) derived from the pressure impulse is plotted in figure 10, where we show the
 $\unicode[STIX]{x1D703}$
component for
 $r=0.5$
at different times (solid lines). For comparison, the incompressible velocity field as derived in Gelderblom et al. (Reference Gelderblom, Lhuissier, Klein, Bouwhuis, Lohse, Villermaux and Snoeijer2016) is plotted as the black dashed line. When the pulse duration is short (figure 10
a) the velocity field at
 $r=0.5$
for
 $t=1$
is zero, since the momentum has not yet propagated far enough into the droplet. As time progresses, velocity fluctuations become apparent and even for times long after the pulse (
 $t\gg 1$
, right panel) they are nowhere near the incompressible solution. Figure 10(b) shows the velocity field for an intermediate pulse duration. Here, the velocity field fluctuates around the incompressible solution. However, the amplitude of these fluctuations are large. For the longest pulse the velocity gradually builds up (figure 10
c, left panel). At later times (right panel) the velocity field shows only tiny fluctuations around the incompressible solution.
3.2.3 Droplet deformation
Finally, we turn to the question how the droplet deformation is affected by the duration of the ablation pressure pulse. To make a prediction for the droplet deformation, we use the velocity field at the droplet surface. Strictly speaking, the analytic solution (2.27) is derived for a constant spherical domain. However, we can obtain a first-order approximation of the droplet shape at early times, i.e. when the deviations from a spherical shape are still small, by advecting material points on the interface as described in Gelderblom et al. (Reference Gelderblom, Lhuissier, Klein, Bouwhuis, Lohse, Villermaux and Snoeijer2016).
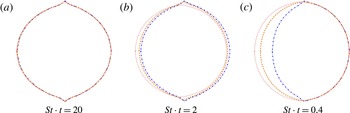
Contour plots of the droplet deformation for the three different pulse durations:
 $St=0.25$
(blue dot dashed),
 $St=1$
(orange dashed) and
 $St=4$
(red dotted). (a) For
 $Ma\,St=0.01$
all cases give rise to identical deformation behaviour, for (b)
 $Ma\,St=0.1$
we see discrepancies arising between the three pulse durations which aggravate in (c)
 $Ma\,St=0.5$
where we observe a clear influence of the pulse duration on the droplet deformation. Note that for each impulse the contours are sketched at a different absolute time to be able to clearly illustrate the deformations.

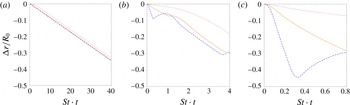
The advective displacement of the droplet interface
 $\unicode[STIX]{x0394}r/R$
at the axis of impact (
 $r=1$
,
 $\unicode[STIX]{x1D703}=0$
) for the three different pulse durations:
 $St=0.25$
(blue dot dashed),
 $St=1$
(orange dashed) and
 $St=4$
(red dotted). (a)
 $Ma\,St=0.01$
, (b)
 $Ma\,St=0.1$
(c)
 $Ma\,St=0.5$
.

We compare the effect of the three different pulse durations illustrated in figure 7 on the droplet deformation. The droplet deformation is not only determined by the pulse duration, but also by the pulse amplitude. We therefore additionally consider three different momentum transfers to the droplet:
 $St\,Ma=0.01$
,
 $St\,Ma=0.1$
and
 $St\,Ma=0.5$
. The acoustical Mach number (or the product
 $St\,Ma$
) now becomes an additional parameter, because we want to quantify the actual differences in deformation. So far, we always scaled out this amplitude dependency (2.8). However, a difference in amplitude now gives a stronger or weaker deformation. In figure 11 we show contours of the droplet deformation for the three different momentum transfers and compare the influence of the pulse duration. We note that the unphysically sharp peaks at the poles are due to the singular nature of the pressure boundary condition (3.1), as already discussed by an incompressible inviscid model by Gelderblom et al. (Reference Gelderblom, Lhuissier, Klein, Bouwhuis, Lohse, Villermaux and Snoeijer2016). We use a step function to limit the boundary condition to the illuminated side of the droplet. In figure 12 we quantify the interface displacement of the droplet at the axis of impact
 $\unicode[STIX]{x0394}r/R$
in time.
When the momentum transfer to the droplet is small (
 $Ma\,St=0.01$
, figures 11
a and 12
a), we need to go to late times (
 $St\cdot t\gg 1$
) in order to observe a significant deformation. On the acoustic time scale
 $R/c$
however, the droplet deformation only shows tiny fluctuations around a static shape. In other words, the fluctuations in the velocity field due to the pressure waves are negligible and the velocity field is to a good approximation incompressible. As a result, on late times the droplet deformation for the three different pulse durations is indistinguishable.
When the amount of momentum transfer to the droplet is increased (figures 11
b and 12
b), interface deformations become apparent at earlier times. For the shortest two pulses all momentum was transferred into the droplet at the time of the plot, while for the long pulse the ablation pressure is still acting on the droplet surface. Therefore, the contour of the longest pulse (red dotted curve) is lagging behind compared to the contour of the shorter pulses (yellow dashed and blue dot dashed curves). Furthermore, for shorter pulses the droplet interface compression is followed by an expansion directly after the pulse which is visible in figure 12(b). Hence, the droplet deformation for short pulses is now clearly a non-monotonic function of time. As
 $Ma\,St$
is further increased, the droplet deformation shows even larger fluctuations around a shape that is also globally deforming, see figures 11(c) and 12(c).
These strong deformations invalidate the assumption that the droplet remain stationary during the pulse. Although figures 11(c) and 12(c) give a first-order estimate of the deformations that are to be expected, for a quantitative prediction one has to solve the fields in the deformed geometry. In this regime we therefore anticipate a strong influence of the pulse duration on the eventual droplet-shape evolution at later times.
4 Discussion and conclusion
The droplet deformation resulting from a laser-induced ablation pressure pulse is studied analytically in the regime where the pulse duration is of the order of the acoustic time scale and the pressure fluctuations are small. The resulting momentum change of the droplet is determined by the pressure pulse amplitude and duration or, in dimensionless form, the acoustic Mach number
 $Ma$
and the acoustic Strouhal number
 $St$
. We examined the effect of changing
 $St$
(i.e. shortening the pulse duration) on the droplet response while keeping the total impulse transferred to the droplet constant.
The pressure, pressure impulse and velocity fields inside the droplet are studied as function of
 $St$
at constant impulse
 $St\,Ma$
. To keep the analysis simple we used a cosine-shaped ablation pressure profile on the surface of the droplet together with a step function to limit the ablation pressure in time and space. To get a first-order estimate of the droplet deformation in time we advected material points on the surface.
In the regime where
 $St\,Ma\ll 1$
, the droplet deformation is independent of
 $St$
and no significant changes in the deformation were observed for shorter pulses. When
 $St$
is large, the flow inside the droplet may be considered incompressible since the pressure impulse field is approximately constant in time. By contrast, when
 $St\ll 1$
the flow inside the droplet is compressible. However, on the deformation time scale the compressible effects average out and the droplet behaves as if it were incompressible. Therefore, the incompressible model by Gelderblom et al. (Reference Gelderblom, Lhuissier, Klein, Bouwhuis, Lohse, Villermaux and Snoeijer2016) can be used to describe the deformation dynamics in this regime.
Significant differences in deformation arise when
 $St\,Ma\lesssim 1$
. When
 $St\gg 1$
the flow is incompressible, but now the droplet deforms significantly during the pulse. When
 $St\ll 1$
all momentum is localized in a small shell close to the illuminated side of the droplet directly after the pulse. This momentum distribution results in a large acceleration of the interface and consequently a compression of the fluid that leads to a different deformation compared to the case where the pulse duration is long (
 $St\gg 1$
). The droplet deformation in this regime is therefore strongly dependent on the pulse duration. In practice, to study droplet deformation resulting from femto-, pico-, nano-second laser pulses in the plasma-mediated ablation regime (i.e. short ablation pressure pulses
 $St\lesssim 1$
) at high energy (such that
 $St\,Ma\lesssim 1$
), droplet compressibility needs to be taken into account.
In the regime where
 $Ma\gtrsim 1$
, the linear approximation of the proposed analytic model breaks down. In this regime, the flow is governed by shock waves, cavitation phenomena, nonlinear viscous damping and rapid interface acceleration, which result in a highly nonlinear droplet response. We argue however that the weakly compressible model can be used as a starting point to identify likely cavitation spots and study first-order droplet deformation, since shock fronts first need to develop in time. We do note however that depending on the liquid properties or temperature, cavitation phenomena could be observed in the regime where
 $Ma$
is small. A more detailed understanding the droplet deformation in these regimes requires numerical simulations and is topic of future work.
Acknowledgements
We are grateful to A. Klein, D. Lohse, A. Prosperetti, F. Toschi and M. Versluis for valuable discussions. This work is part of an Industrial Partnership Programme of the Netherlands Organization for Scientific Research (NWO). This research programme is co-financed by ASML.