I. INTRODUCTION
Biological tissues, including bone and articular cartilage, are multiphase materials with a porous “solid” skeleton and a hydrating fluid phase. Natural tissues are hierarchically structured materials,Reference Lakes1 exhibiting different structural and mechanical characteristics over a range of length scales.Reference Weiner and Wagner2 As a consequence of the varied structure, tissues exhibit fluid flow across different length scalesReference Anderson, Kreuzer, Small and Knothe Tate3 and distinct levels of porosity can often be identified.Reference Cowin4 The study of fluid flow in tissues during deformation is fundamental both to understand how natural tissue functions and to develop biomimetic materials for tissue repair and replacement.Reference Ko, Oyen, Fallgatter, Kim, Douglas, Fricton and Hu5, Reference Oyen6 Fluid flow in tissues gives rise to time-dependent mechanical behavior, which has been considered both within viscoelasticReference Sasaki and Enyo7 and poroelasticReference Cowin4 mechanical frameworks. A poroelastic framework is a continuum mechanical description of the fluid–solid composite materialReference Wang8; while analytically more complicated than a linear viscoelastic framework, this approach has the advantage that material property values can be related directly to tissue microstructure, including physical pore size.
Indentation is a common technique for testing the mechanical behavior of almost any material at length scales ranging from nanometers, for nanoindentation, to millimeters in the case of traditional indentation. In considering the mechanical characterization of hydrated biological materials,Reference Ebenstein and Pruitt9, Reference Oyen10 indentation is ideal because the specimen need not be “gripped” as for tensile testing nor is there a requirement for substantial machining to create “dogbone” specimens. There is also significant potential for measurement and mapping of local properties in heterogeneous and functionally graded tissues.Reference Cuy, Mann, Livi, Teaford and Weihs11 Nanoindentation testing has been used extensively to study bone.Reference Rho, Roy, Tsui and Pharr12–Reference Bushby, Ferguson and Boyde16 However, most nanoindentation experiments have not been performed with tissue kept in a hydrated physiological state, thus neglecting the distinctive role of the water phase in time-dependent bone deformation. More recently, cartilageReference Miller and Morgan17–Reference Franke, Goeken, Meyers, Durst and Hodge19 nanoindentation studies have been performed to characterize its mechanical behavior at small length scales. Since indentation techniques are capable of testing even the smallest hierarchical length scales in biological materials,Reference Ebenstein and Pruitt9, Reference Oyen10 there exists an opportunity to characterize a range of hierarchical features in tissues simply by varying the indentation load (or depth), tip geometry, and the physical instrument used to perform the testing. Data analysis techniques optimized for high-throughput, large-scale investigations by indentation have been developed for examining time-dependent deformation during indentation contact,Reference Galli, Comley, Shean and Oyen20–Reference Galli and Oyen24 but these have been used in only limited investigations of biological materials to date.Reference Oyen25
In the current study, nanoindentation and microindentation creep and load relaxation tests are performed on hydrated bone and cartilage tissue samples. The experimental indentation data are analyzed within both viscoelastic and poroelastic frameworks for evaluation of time-dependent mechanical responses. Length scale effects in mechanical properties are considered via comparison of results from nano- and microindentation length scales, with a solid polymer (PS-4) serving as a scale-independent control. Both bone and cartilage were found to exhibit substantial size effects in their mechanical responses, with the majority of the observed difference being exhibited in the time-dependent response rather than the elastic response. A poroelastic framework was more sensitive to these differences than a viscoelastic framework.
II. METHODS
A. Materials
1. PS-4 polymer
Thin 1-mm sheets of PS-4 photoelastic coating polymerReference Oyen26 (Vishay Micro-Measurements, Raleigh, NC) with a nominal elastic modulus (E) of 4 MPa and a Poisson’s ratio (ν) of 0.5 were used as controls.
2. Cartilage
Three calf patellae were obtained and stored at −80 °C. The patellae were defrosted and dissected using a scalpel. Three strips of cartilage approximately 3-mm thick were cut from the surface of each patella and wrapped in saline-soaked gauze and tested within 36 h. Prior to testing, the cartilage samples were soaked in phosphate-buffered saline (PBS) solution at room temperature for a minimum of 30 min.
3. Bone
Four bone samples were investigated in the present study, approximately 6-mm-thick transverse slices from equine third metatarsal bone. The specimens were preserved at −25 °C, defrosted in deionized water and polished prior to indentation testing. Polishing was carried out using progressively finer SiC papers—the use of polishing suspensions was avoided to minimize the risk of contamination of specimen surface pores with grinding particles. To evaluate the effect of polishing on the experimental results, two levels of polishing were considered: specimens A and B were polished to a grit size of 1200, whereas C and D were polished to a grit size of 4000. The surface of the finely polished specimens was investigated using optical microscopy.
B. Indentation testing
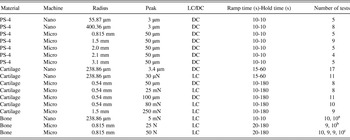
Nanoindentation tests were performed on a UBI 1 (now TI-700; Hysitron Inc., Minneapolis, MN) with a diamond conospherical probe of radius (R) 55 μm and spherical sapphire tips of radius 283 and 400 μm. Microindentation tests were performed using an Instron 5544 Universal Testing Machine (Canton, MA) with either a 5 N (PS-4 and cartilage) or 500 N (bone) load cell and spherical stainless steel tips with radii of 0.54, 0.815, 1.5, 2.0, and 3.1 mm and a sapphire tip with radius 2.1 mm (Table I). For all tests, indents were spaced sufficiently apart such that no contact interference was observed.
List of indentation experiments. For each set of experiments, the table gives the specimen type, the indentation testing machine (see text for descriptions), the spherical probe radius, the peak load or peak displacement level, load control (LC) or displacement control (DC), the ramping and holding times for the experiment, and the total number of individual indentation tests for which data are presented here.

a for specimens C, D, respectively.
b for specimens A, B, respectively.
c for specimens A, B, C, D respectively.
Indentation testing was performed in both load and displacement control modes (Table I); for nanoindentation, both modes are feedback driven, whereas for microindentation, only load control is feedback driven and displacement-controlled testing is performed open-loop. A trapezoidal indentation testing profile was used for all tests, such that the load or displacement was ramped at constant rate to a fixed level, held constant at the peak level for a period of time and then released. Peak load or displacement values are shown along with full experimental details in Table I. Displacement control tests commenced from a position with the tip poised slightly above the surface, whereas load control tests started in contact with a small preload of approximately 1 μN for nanoindentation, 0.5 N for bone microindentation, and sub-1 mN for cartilage microindentation. Bone and cartilage tests were conducted with specimens submerged in fluid; deionized water was used to hydrate bone specimens and PBS for cartilage specimens. Experimental data from all tests was exported as load–displacement–time (P–h–t) for off-line analysis in MATLAB (The MathWorks, Natick, MA).
C. Viscoelastic analysis
Viscoelastic indentation responses were examined based on an approach using elastic–viscoelastic correspondence.Reference Oyen22, Reference Oyen23, Reference Lee and Radok27 Briefly, the approach uses a Boltzmann hereditary integral formulation, integrating over a particular form of the creep or relaxation function (J(t) or G(t), respectively) and the load–time (P–t) or displacement–time (h–t) imposed loading history assuming that Poisson’s ratio (ν) is 0.5Reference Oyen22:


where the creep function J(t) or relaxation function G(t) is assumed to be a Prony series of the form:

for load relaxation in displacement control and

for creep in load control. Integration is performed for the full loading history, for example in two stages for the loading phase and holding phase,Reference Oyen22, Reference Oyen23 resulting in a closed form solution that can be fit (using the nonlinear least squares optimization routine in the optimization toolbox in MATLAB) to the experimental displacement–time data for load controlReference Oyen22, Reference Oyen23 to obtain the creep function coefficients D k. The time constants result directly from the fit. For displacement control relaxation function coefficients, C k are calculated from an analogous procedure based on the ramp–hold solution used for load control.Reference Mattice, Lau, Oyen and Kent21 (This approach has recently been verified by both numerical integration and finite element analysis.Reference Qiang, Zhang, Oyen and Greenleaf28) Reported parameters for both load and displacement control tests then include the limiting values for the relaxation or creep response, the instantaneous and equilibrium shear modulus values, G(0) and G(∞). The ratio of limiting modulus values f = G(∞)/G(0) is also reported as a measure of viscoelastic extent—where f = 1 signifies a perfectly elastic material and f = 0 a perfectly viscous material. All intermediate values indicate a viscoelastic solid with intermediate time-dependent deformation over the duration of the experiment.
D. Poroelastic analysis
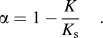
For poroelastic analysis of load-controlled tests, an analysis previously developed by the authorsReference Galli and Oyen24 was used. Specimens were assumed to have a linear isotropic poroelastic behavior and be fully saturated. Such a constitutive response is governed by five parametersReference Detournay, Cheng and Fairhurst29: the shear modulus G, the drained Poisson’s ratio ν, the undrained Poisson’s ratio ν u, the effective stress coefficient α, and the hydraulic permeability κ defined in Darcy’s sense. The effective stress coefficient α is nondimensional, with a range of variation [0, 1], and is related to the ratio between the bulk modulus of the drained poroelastic material and that of the material of which the solid skeleton is made:
The Darcy hydraulic permeability is the ratio of the intrinsic permeability k, a geometrical and microstructural property of the solid skeleton (dimensionally a squared length), to the fluid dynamic viscosity μ:

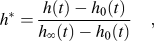
The identification of the poroelastic parameters was performed using the identification algorithm developed by the authors, assuming for water a viscosity value of 0.001 N·s·m−2. The approach is based on the normalization of the time–displacement indentation response to obtain master curves.Reference Agbezuge and Deresiewicz30, Reference Deresiewicz31 The nondimensional displacement h* and the nondimensional time t* are defined according to the following expressions:
and
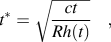
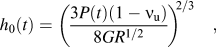
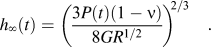
where h(t) is the indentation depth, h 0(t) is the indentation depth which would be measured if the actual load at instant t were applied in step-loading conditions, and h ∞(t) is the corresponding indentation depth at t = ∞ when the pore pressure field vanishes. These extreme values of the indentation depth correspond to the elastic solutionsReference Johnson32 when Poisson’s ratio is ν u and ν, respectively:
and
The diffusivity coefficient c is related to the velocity of the consolidation process and is a function of the five constitutive parameters:
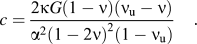
The identification procedure consists of two nested optimization routines, one in the time–displacement domain and the other in the normalized domain; convergence is achieved when the difference between the parameters identified in each domain is negligible. Since the information provided by a spherical indentation test allows for the independent identification of three constitutive parameters, G, ν, and κ were considered unknown whereas for α and ν u, the values 0.14Reference Cowin4 and 0.5 were assumed for bone and 1Reference Bachrach, Mow and Guilak33 and 0.5 for cartilage.
The effect of the assumed value of the undrained Poisson’s ratio was considered as follows. Once the identification for a baseline guess of ν u = 0.5 is carried out, it is possible to obtain the corresponding values of the instantaneous and long-term indentation depths, h 00.5 and h ∞0.5 by introducing the values of the identified parameters into the Hertzian contact expressions (9) and (10) and assuming an instantaneous load, P(t) = P max. The value of the identified diffusivity coefficient c 0.5 can be assessed in an analogous manner. From the values of h 00.5, h ∞0.5, and c 0.5, it is possible to estimate the values of the constitutive parameters for different values of ν u: the values of G and ν can be computed by solving Eqs. (9) and (10) for G and ν and assuming h 0 = h 00.5, h ∞ = h ∞0.5, and P(t) = P max. The permeability value can be obtained from Eq. (11) by introducing the corresponding constitutive properties and assuming c = c 0.5. In the present analysis, the values 0.4 and 0.45 for ν u were considered in addition to ν u = 0.5. For all analyses, the last portion of the ramp (typically the last 1% and 10%, for nanoindentation and macroindentation, respectively) and the entire holding time period were used for parameter identification.
III. RESULTS
1. PS-4 polymer
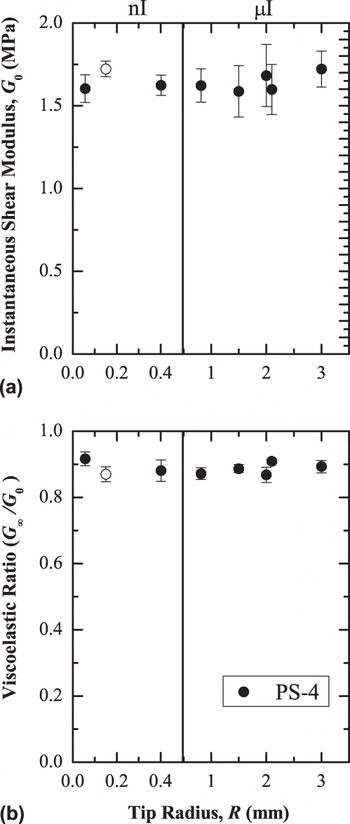
No length scale effects were observed for bulk PS-4 polymer when comparing displacement-controlled nanoindentation and microindentation for a range of tip radii (Fig. 1, solid points). The instantaneous shear modulus (G 0) of PS-4 averaged 1.634 ± 0.137 MPa and the viscoelastic ratio (f = 0.8914 ± 0.025) demonstrates that the material is largely elastic. These data were compared with data previously published for load-controlled nanoindentation with a 150 μm-radius sapphire tip (Fig. 1, open symbols), and no differences were observed even though a different physical instrument was used in the two experiments.
Instantaneous shear modulus (G 0) and viscoelastic ratio (G ∞/G 0) for a PS-4 polymer tested by nanoindentation (nI) and microindentation (μI) as a function of tip radius for seven different indenter tips in displacement control (solid symbols). Viscoelastic properties of the PS-4 polymer obtained on a different machine in load control with a sapphire tip (using only data in a similar load range) are included for reference (open symbols). There is no effect of tip radius, machine type, or control mode on either the elastic or viscoelastic response for the PS-4 polymer.

2. Cartilage
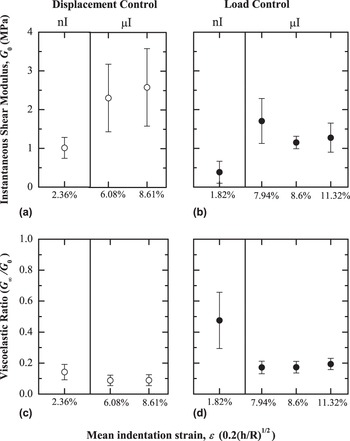
Both the indentation length scale and the control mode were found to substantially affect both the elastic and viscoelastic responses of cartilage (Fig. 2). The instantaneous shear moduli (G 0) obtained from both nanoindentation and microindentation tests in displacement control were substantially greater than those observed in load control while the equilibrium moduli (G ∞) were approximately equal. The overall trend was for smaller stiffness and a lesser extent of time-dependent deformation in the small-scale nanoindentation experiments. One confounding factor is the indentation strain, ε = 0.2 (h/R)1/2, which is listed in Fig. 2 for each dataset. The smaller nanoindentation strains suggest that material nonlinearities could be contributing to the observed differences, although parameter results for different microindentation strain levels are approximately constant. The shear modulus G, drained Poisson’s ratio ν, and permeability k of cartilage were determined to be 236 ± 112 kPa, 0.15 ± 0.10, and 6.6 ± 4.7 × 10⁻²⁰ m2, respectively, when measured via nanoindentation creep tests.
Instantaneous shear modulus (G 0) and viscoelastic ratio (G ∞/G 0) for cartilage specimens tested by nanoindentation (nI) or microindentation (μI), plotted as a function of mean indentation strain. Differences are observed for both elastic and time-dependent responses as a function of length scale and depending on the experimental control mode used.

3. Bone
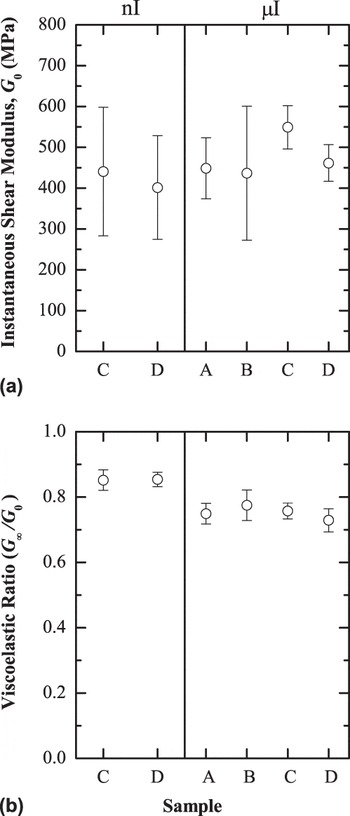
Analysis of indentation results for bone using a viscoelastic approach demonstrated an approximately constant shear modulus and a slight difference in viscoelastic ratio (Fig. 3) when comparing nanoindentation and microindentation results. (Note that for this analysis only 10 s of microindentation data was used for direct comparison with the nanoindentation data.) Smaller standard deviations for samples C and D, those also prepared for nanoindentation, demonstrated the effect of surface roughness on the elastic modulus values—the scatter was altered but the mean values did not differ.
Instantaneous shear modulus (G 0) and viscoelastic ratio (G ∞/G 0) for bone specimens tested by nanoindentation (nI) or microindentation (μI). The elastic moduli did not vary, but there was a slight difference in viscoelastic ratio.

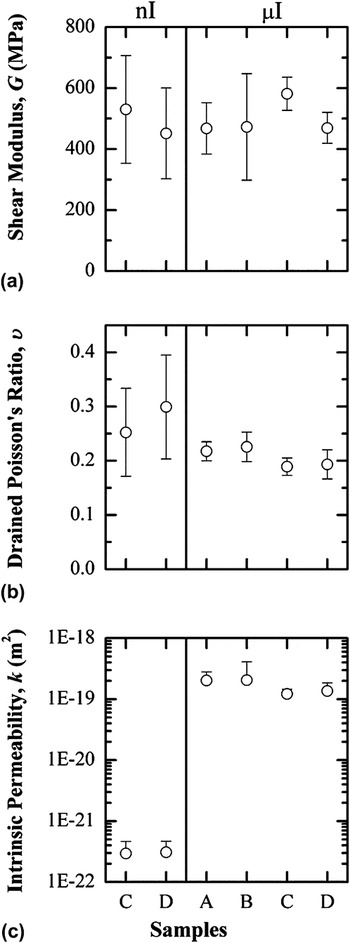
When the same data were considered in a poroelastic context, the difference in time-dependent deformation became striking (Fig. 4). Permeability values differed by approximately three orders of magnitude when comparing nano- and microindentation results. Poisson’s ratio values were slightly greater for nanoindentation data compared with microindentation data. Shear modulus values were indistinguishable across different bone samples and for nanoindentation and microindentation tests on the same specimens. Parameters were not considerably different if the microindentation fitting was performed on 10 s of hold data, as for the viscoelastic analysis, or on the entire 180 s hold curve.
Poroelastic parameters identified from spherical nanoindentation and microindentation tests on all bone specimens; the value of the undrained Poisson?s ratio (νu) was fixed at 0.5. The elastic properties (G, ν) were invariant but a substantial difference between permeability values was observed when comparing nanoindentation (nI) and microindentation (μI) results.

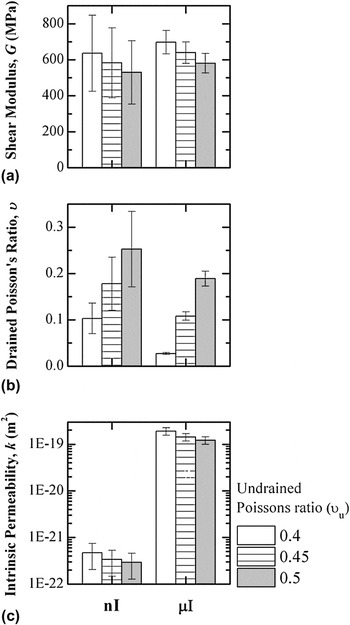
The variation in identified poroelastic parameters is shown (Fig. 5) for varying values of the assumed value of the undrained Poisson’s ratio (ν u = 0.4 and 0.45) compared with the baseline assumption used above (ν u = 0.5) for a single bone sample tested with both nanoindentation and microindentation. The assumed undrained Poisson’s ratio (ν u) affects the shear modulus and permeability to a relatively minor extent, with slight increases in parameters obtained for smaller starting values of undrained Poisson’s ratio. The effect is more pronounced for the (drained) Poisson’s ratio, where values decrease as the initial guess for ν u decreases.
Poroelastic parameters identified from spherical nanoindentation and microindentation tests on a single bone specimen. The undrained Poisson's ratio (νu) was assigned a value of 0.4, 0.45 or 0.5 to assess sensitivity of the parameter identification process on this value.

IV. DISCUSSION
In the current study, samples of two hydrated biological tissues, bone and cartilage, were mechanically tested using spherical indentation at different length scales. Tissue specimens demonstrated size effects in that length scale had an influence on mechanical properties, especially time-dependent mechanical properties. A commercial polymer, PS-4, was used as a control, demonstrating that the observed differences in biological materials were not due to different physical instruments, tip radii, or tip material.
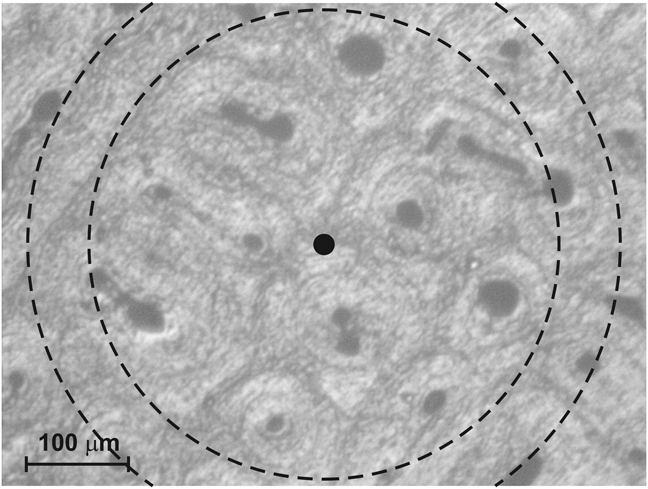
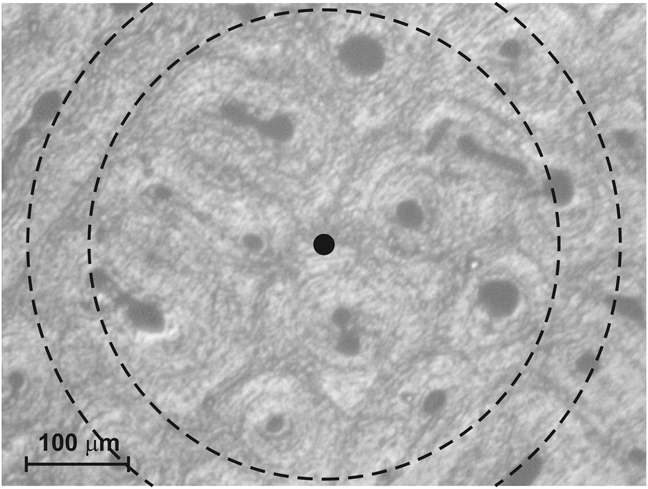
Bone results, interpreted via a novel linear poroelastic data analysis framework,Reference Galli and Oyen24 demonstrated that elastic properties (G, ν) were consistent across length scales, whereas the permeability found from nanoindentation tests was three orders of magnitude smaller than that from microindentation tests. This rather surprising result can be interpreted by examining the tissue microstructure. An optical micrograph of a representative bone specimen surface is shown in Fig. 6, illustrating the characteristic contact size of the indents for micro- and nanoindentations: the tested contact areas and sampled microstructures differ considerably. The pore structure is typical of lamellar bone,Reference Currey34 with osteonal canal diameters ranging from approximately 10 to 60 μm and an average distance of approximately 200 μm from one pore to another. The scale of contact for nanoindentation was thus comparable to the size of the visible pores, and nanoindents were targeted on solid material between the pores. The microindentation contact size, approximately 230 and 290 μm for microindentation with 25 and 50 N, respectively, was sufficiently large to include a number of visible pores. This result suggests that a different hierarchical level of bone porosity was tested using nanoindentation when compared with microindentation.
Optical micrograph of an indented bone surface, showing the characteristic size of the indentation contacts for microindentation (dashed lines, for which the inner circumference is for an applied load of 25 N and the outer for a load of 50 N) and nanoindentation (filled circle).
The bone nanoindentation results herein are also consistent with preliminary data considered in a previous nanoindentation study,Reference Oyen25, Reference Oyen, Galli, Garikipati and Arruda35 which, when analyzed with the present identification algorithm with α = 0.14 and ν u =0.5, yield a value of approximately 6.5 × 10⁻²³ m2 for the intrinsic permeability.Reference Galli and Oyen24 The agreement between the current results and those previously obtained (from a different bone specimen, with a different nanoindentation instrument, a different experimental testing time—hold times of seconds versus minutes—and different physical length scales; Table II) suggest that nanoindentation is a robust experimental technique for assessing permeability at very small length scales. It further illustrates that the permeability measured by nanoindentation, and the associated porosity, is not the same as the permeability (and porosity) probed in larger scale experiments. The indentation strainReference Johnson32 levels in the current nanoindentation tests were small compared with those of the previous studiesReference Bembey, Bushby, Boyde, Ferguson and Oyen15, Reference Oyen25 due to the larger nanoindenter tip radius, but the permeability values were comparable. However, the microindentation strain levels here were comparable with those obtained in the previous nanoindentation tests.Reference Bembey, Bushby, Boyde, Ferguson and Oyen15, Reference Oyen25 This result highlights the relative strain independence of permeability results obtained from indentation testing, and thus validates the assumption of linear poroelasticity. The experimental permeability values obtained here for bone are comparable to those estimated for the lacunar canalicular porosity by modeling approaches,Reference Smit, Huyghe and Cowin36 approximately 2.2 × 10⁻²² and 3 × 10⁻²² m2 (for the hypothesis of “small annulus,” which assumes a canaliculi radius of 50 nm and an osteocyte process radius of 25 nm).Reference Beno, Yoon, Cowin and Fritton37
Bone nanoindentation results comparison.

Micro- and nanoindentation results from the current study.
a Additional nanoindentation results are obtained from Ref. Reference Oyen25.
The identified values of the bone shear modulus (Fig. 4) are similar for all bone specimens both in micro- and nanoindentations: the shear modulus is approximately 500 MPa in all cases. The results are in line with previous nanoindentation studies on hydrated bone,Reference Bembey, Bushby, Boyde, Ferguson and Oyen15, Reference Oyen25 in which a shear modulus of 430 MPa is obtained when step-loading conditions are assumed, and a value of 466 MPa is identified for the same bone dataReference Bembey, Bushby, Boyde, Ferguson and Oyen15 with the same algorithm used herein and when ramp loading is considered explicitly.Reference Galli and Oyen24 These results confirm that bone is substantially more compliant when hydrated: the obtained values for G are one order of magnitude smaller than nanoindentation values obtained from tests on dry and resin-embedded samples, for which a typical G value is 5 GPa.Reference Cowin4, Reference Rho, Roy, Tsui and Pharr12–Reference Zysset, Guo, Hoffler, Moore and Goldstein14, Reference Bushby, Ferguson and Boyde16 The comparison is, however, imperfect as sharp indenter probes and elastic–plastic data analysis is typically used for dehydrated bone, whereas time-dependent (viscoelastic or poroelastic) analysis is used for hydrated bone.
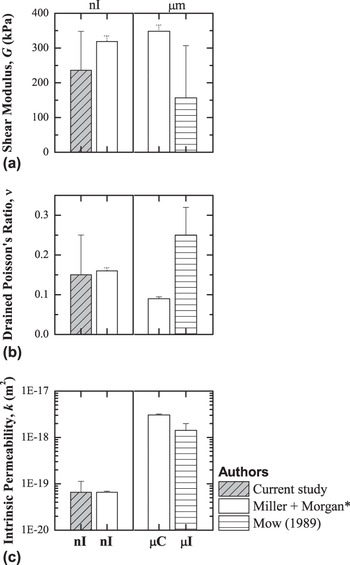
The confirmed length scale effect in the hydraulic permeability of bone is consistent with the current cartilage results, in which cartilage exhibited a lesser extent of time dependence in nanoindentation compared with microindentation. This shear modulus and drained Poisson’s ratio from nanoindentation creep tests are consistent with literature values,Reference Korhonen, Laasanen, Töyräs, Rieppo, Hirvonen, Helminen and Jurvelin38 but the permeability is one to two orders of magnitude smaller than that which is typically reported for non-nanoscale testing.Reference Mow, Gibbs, Lai, Zhu and Athanasiou39 A perceived permeability difference with length scale is also consistent with a recent similar study of articular cartilage by Miller and Morgan,Reference Miller and Morgan17 in which cartilage permeability values measured by nanoindentation were substantially smaller than values measured by microcompression testing. These two studies are compared in Fig. 7, along with a flat punch microindentation study from the literature.Reference Mow, Gibbs, Lai, Zhu and Athanasiou39 Results for cartilage nanoindentation from the current work are in agreement with the recent article,Reference Miller and Morgan17 validating the use of the master curve approach hereReference Galli and Oyen24 in comparison with the time-intensive inverse optimization used previously.Reference Miller and Morgan17 Results for the compression and indentation data at the microscale are broadly in agreement. Interestingly, the microindentation data from the current study could not be analyzed in the poroelastic framework used here, as there was more time dependence observed in the microscale tests than in the nanoscale tests [Fig. 2(d)]. This took the spherical microindentation data out of a linear poroelastic framework, and poroviscoelastic analysis would be required.Reference Galli, Fornasiere, Cugnoni and Oyen40
Poroelastic parameters for spherical nanoindentation of cartilage specimens from the current study, compared to nanoindentation and confined and unconfined compression performed by Miller and Morgan,Reference Miller and Morgan17 and flat punch microindentation performed by MowReference Mow, Gibbs, Lai, Zhu and Athanasiou39 (1989). The undrained Poisson’s ratio (ν u) was fixed at 0.5. The elastic properties (G, ν) were invariant, but a large difference between permeability (k) values was observed when comparing both sets of nanoindentation (nI) and microscale (μC, μI) results. *Plotted standard deviation bars were based on 5% significance levels, as used in the article.

It is important to highlight that the magnitude of the time-dependent displacement is a function of the difference between ν u and ν, as can be seen by combining Eq. (9) with Eq. (10) to obtain the following expression for the ratio h ∞/h 0:
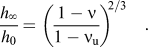
It is because of this limit in the extent of time-dependent deformation that can be characterized as poroelastic that the cartilage microindentation data could not be analyzed within this linearly poroelastic framework, as discussed above, and would necessitate a poroviscoelastic analysis.Reference Galli, Fornasiere, Cugnoni and Oyen40 Further, this explains why the hypothesized value of ν u leads to direct variations in the obtained value of the drained Poisson’s ratio ν for bone [Fig. 5(b)]. Since significant creep is observed in bone, the difference between the two Poisson’s coefficients must be appreciable and much larger than the value of 0.01 reported previously.Reference Cowin4
Substantial differences were observed between the creep and relaxation behavior of cartilage. Although equilibrium shear moduli were similar, instantaneous shear moduli predicted from displacement control experiments were always greater than their counterparts obtained using load control. When these differences are considered within a poroelastic framework, the observation of a greater instantaneous reduced modulus in relaxation then creep can be possibly explained. In load control, tissue creeps as fluid flows away from the process zone—crucially, after the peak load has been applied further displacement cannot occur unless fluid can flow away from the indenter. In contrast, in displacement control, the tissue is displaced at the specified rate regardless of whether fluid has had time to flow. Cartilage is assumed to initially be incompressible (ν u = 0.5) due to its considerable water content and hence the loads that must be applied could be substantial. Similar discrepancies between creep and relaxation have been modeled and shown experimentally in confined compression experiments in cartilage.Reference Mow, Gu and Chen41 Furthermore, cartilage is known to exhibit strain-dependent permeability,Reference Mow, Holmes and Lai42 which would also likely result in apparent differences between a displacement-controlled and load-controlled approach.
Here, we have demonstrated that poroelastic indentation data analysis, made fast with a master curve algorithm developed by the authors’ previouslyReference Galli and Oyen24 and here utilized in a large-scale study for the first time, is extremely useful in the context of hierarchical characterization of hydrated biological materials. The average duration for constitutive parameter identification on a personal computer equipped with a dual core 2.16 GHz central processing unit was approximately 10 s, a negligible computational cost if compared to that of an analogous identification based on inverse finite element modeling (on the order of hoursReference Galli, Comley, Shean and Oyen20). There are some limitations to the poroelastic analysis, however. With indentation testing, it is possible to uniquely identify three of the five linear poroelastic parameters (G, ν, κ) and therefore the values of the other two (ν u, α) must be obtained independently. The value assigned to α does not affect the results of the identification of G and ν because the algorithm actually identifies the ratio k/α 2. Of course, the eventual permeability value strongly depends on the assumption made for α. Therefore, the assumption of incompressibility would cause a reduction of permeability of about two orders of magnitude.Reference Oyen, Galli, Garikipati and Arruda35
Regardless of some acknowledged limitations, for comparison of mechanical properties of different hydrated samples and for studying length scale effects, the current “fast” analysis allows for relatively high-throughput characterization and couples well with automated instrumented indentation techniques.
V. CONCLUSIONS
In conclusion, a scale-dependent variation in hydraulic permeability has been seen in two different hydrated biological materials via multiscale mechanical characterization on the same physical samples. Some key results are:
(1) Large, visible pores in bone are associated with microindentation permeability values approximately three orders of magnitude greater than those found for nanoindentation of the bone “solid” skeleton between the pores.
(2) Cartilage results showing a similar length scale effect are consistent with a recent similar study on cartilage, although a novel poroelastic framework was used in the data analysis here to reduce analysis time frames to minutes instead of hours.
(3) No length scale effect is observed in the elastic or time-dependent response of a homogeneous, bulk solid polymer, such that the observed differences in tissue behavior were not an experimental artifact.
(4) The results herein support the idea that nanoindentation testing is measuring a length scale and associated permeability different from those observed in microscale testing and could be associated with molecular level processes.
(5) Both viscoelastic and poroelastic frameworks can be implemented for analysis of large numbers of individual indentation tests. However, microstructural differences that are only hinted at with viscoelastic analysis are highlighted with poroelastic analysis.
(6) Although data analysis for assessing time-dependent mechanical properties must be done off-line, it is fast and robust, thus allowing for high-throughput material characterization.
Overall, nanoindentation and spherical indentation, in general, is an extremely useful technique for the mechanical characterization of hierarchical biological tissues, particularly when time-dependent deformation is used for data analysis.
ACKNOWLEDGMENTS
The authors acknowledge Dr. M. Duer and Dr. D. Reid for supplying the specimens and L. Howlett for helping with bone sample preparation.