Introduction
Due to ice coverage, what is currently known about the geology of the Antarctic continent comes from sparse outcrops and proxy data from marine sediment cores. Antarctica was not always ice covered; palaeo-reconstructions show that the continental conditions were much warmer and with reduced ice extent during the Eocene epoch (Pross et al. Reference Pross, Contreras, Bijl, Greenwood, Bohaty and Schouten2012). The Eocene epoch (c. 56–34 Ma) marked a time of great change in global climate from the Early Eocene Climatic Optimum (Zachos et al. Reference Zachos, Pagani, Sloan, Thomas and Billups2001, Westerhold et al. Reference Westerhold, Marwan, Drury, Liebrand, Agnini and Anagnostou2020) to the arrival of polar glaciation in the late Eocene and into the Oligocene. The transition from Eocene greenhouse conditions to Oligocene cooling conditions is documented by a distinct increase in benthic foraminifera δ18O values (Zachos et al. Reference Zachos, Pagani, Sloan, Thomas and Billups2001, Coxall et al. Reference Coxall, Wilson, Pälike, Lear and Backman2005). The changes are documented as two distinct steps: the EOT-1 (Eocene-Oligocene Transition isotope stage 1, 34.4 Ma) and the Oi-1 (Oligocene isotope event-1, 33.7 Ma); the former is attributed to cooling and the latter to significant ice growth of the East Antarctic Ice Sheet (EAIS; Coxall et al. Reference Coxall, Wilson, Pälike, Lear and Backman2005).
The Eocene-Oligocene Transition has been widely modelled to better understand the initiation and intensification of glaciation in Antarctica (Wilson et al. Reference Wilson, Pollard, DeConto, Jamieson and Luyendyk2013, Ladant et al. Reference Ladant, Donnadieu, Lefebvre and Dumas2014, Van Breedam et al. Reference Van Breedam, Huybrechts and Crucifix2022). DeConto et al. (Reference DeConto and Pollard2003) posited that the onset of glaciation was probably due to a decrease in atmospheric CO2, which could have caused the initial cooling necessary for ice caps to begin growing. The opening of the Tasman and Drake passages and subsequent isolation of the Antarctic continent along with the Miocene formation of the Antarctic Circumpolar Current (ACC) would have been a secondary mechanism for cooling (DeConto et al. Reference DeConto and Pollard2003, Gasson et al. Reference Gasson, Lunt, DeConto, Goldner, Heinemann and Huber2014, Goldner et al. Reference Goldner, Herold and Huber2014), potentially allowing for ice-sheet growth. These models suggest that under these conditions the growth of the EAIS would have nucleated in areas of high topographical relief and expanded outward towards the coasts, reaching the marine environment first in Dronning Maud Land, then Prydz Bay and finally the Wilkes Land/Terra Adélie coast (DeConto et al. Reference DeConto and Pollard2003, Stocchi et al. Reference Stocchi, Escutia, Houben, Vermeersen, Bijl and Brinkhuis2013). Gasson et al. (Reference Gasson, Lunt, DeConto, Goldner, Heinemann and Huber2014) and Van Breedam et al. (Reference Van Breedam, Huybrechts and Crucifix2022) highlight the sensitivity of EAIS growth in ice-sheet models to palaeotopographical boundary conditions. However, even under the maximum palaeotopography reconstructed by Wilson et al. (Reference Wilson, Jamieson, Barrett, Leitchenkov, Gohl and Larter2012) and Paxman et al. (Reference Paxman, Jamieson, Hochmuth, Gohl, Bentley, Leitchenkov and Ferraccioli2019), the ice-sheet model by Van Breedam et al. (Reference Van Breedam, Huybrechts and Crucifix2022) still produces significant ice-sheet reduction during late Eocene interglacials due to the sensitivity of the ice sheet to relatively small changes in CO2 around a threshold value.
Two sites on the East Antarctic margin contain mudstones that allow us to investigate the palaeoclimate conditions through Eocene and Oligocene interglacials. Updated detailed age models show that Ocean Drilling Program (ODP) Site 1166 and Integrated Ocean Drilling Program (IODP) Site U1360 contain upper Eocene and lower Oligocene sediments, respectively (Florindo et al. Reference Florindo, Bohaty, Erwin, Richter, Roberts, Whalen and Whitehead2003, Houben et al. Reference Houben, Bijl, Pross, Bohaty, Passchier and Stickley2013, Passchier et al. Reference Passchier, Ciarletta, Miriagos, Bijl and Bohaty2017). Despite the limited thickness and recovery of sediments, the sites were chosen because they include the most complete Eocene and Oligocene deglacial sequences on the East Antarctic continental shelf that were deposited during interglacials. The fine-grained lithologies allow for the application of a detrital geochemical approach, including the application of inorganic palaeoclimate proxies, such as the Chemical Index of Alteration (CIA) and the S-index (Nesbitt & Young Reference Nesbitt and Young1982, Sheldon et al. Reference Sheldon, Retallack and Tanaka2002). By reconstructing the mud provenance and weathering indices of the interglacial sediments, the changing palaeoclimate of ice-sheet minima through the Eocene-Oligocene Transition can be better understood.
Regional geology and previous work
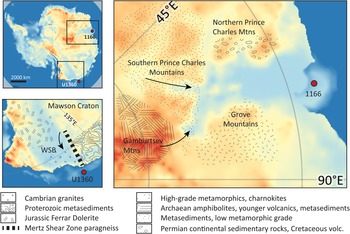
Site 1166 is located in Prydz Bay, the main drainage basin for the Lambert Glacier-Amery Ice Shelf that today drains ~20% of the EAIS (van de Flierdt et al. Reference Van de Flierdt, Hemming, Goldstein, Gehrels and Cox2008). The Amery Ice Shelf and Prydz Bay are located in the Lambert Graben, a failed arm of a triple junction that formed during the late Palaeozoic to early Mesozoic as India began to rift from Antarctica (Stagg Reference Stagg1985, Lisker et al. Reference Lisker, Brown and Fabel2003, Thomson et al. Reference Thomson, Reiners, Hemming and Gehrels2013). On the western edge of the Graben are the northern and southern Prince Charles Mountains, containing outcrops of Archaean mafic dykes (Mikhalsky et al. Reference Mikhalsky, Boger and Henjes-Kunst2013), Precambrian granitic basement, metasedimentary rocks, high-grade metamorphic rocks, granitoids and volcanics, Cambrian granites and Permian sedimentary rocks (Munksgaard et al. Reference Munksgaard, Thost and Hensen1992, Sheraton et al. Reference Sheraton, Tindle and Tingey1996). To the east of the Lambert Graben are the Grove Mountains that consist of Precambrian felsic orthogneisses, mafic granulites and paragneiss (Fig. 1; Liu et al. Reference Liu, Jahn, Zhao and Zhao2007). Located south of the Prince Charles Mountains and inland from the Lambert Graben are the Gamburtsev Subglacial Mountains. These mountains are ~3000 m in elevation and reside in the middle of the East Antarctic craton; they are believed to be an important nucleation point for Eocene-Oligocene Transition ice growth (DeConto & Pollard Reference DeConto and Pollard2003, van de Flierdt et al. Reference Van de Flierdt, Hemming, Goldstein, Gehrels and Cox2008). The rock types of the Gamburtsev Subglacial Mountains remain unknown due to thick ice cover; however, recent studies suggest that they may be composed of mafic granitoids that have two age ranges: 650–500 Ma and 1100–800 Ma (Veevers et al. Reference Veevers, Saeed and O'Brien2008).
Locations of ODP Site 1166 and IODP Site U1360 on a topographical model for the Eocene of Paxman et al. (Reference Paxman, Jamieson, Hochmuth, Gohl, Bentley, Leitchenkov and Ferraccioli2019). Geological interpretations after Sheraton et al. (Reference Sheraton, Tindle and Tingey1996), Liu et al. (Reference Liu, Jahn, Zhao and Zhao2007), Goodge & Fanning (Reference Goodge and Fanning2010) and Jordan et al. (Reference Jordan, Ferraccioli, Armadillo and Bozzo2013). WSB = Wilkes Subglacial Basin.

Sediment transport to Site 1166 in the late Eocene was dominantly glaciofluvial; glacial textures on quartz grains were found in Unit II, indicating a proglacial environment (Strand et al. Reference Strand, Passchier and Näsi2003). Based on terrestrial palynology from Site 1166, Macphail & Truswell (Reference Macphail, Truswell, Cooper, O'Brien and Richter2004) determined that the region contained rainforest scrublands during the Eocene, indicating warm and wet environments. Thermochronological data from sample 16R-55cm in the section studied here (Fig. 2) and the underlying Eocene sands indicate that erosion rates were low, and a very narrow detrital apatite fission track age range of 250–300 Myr points to sediment transport confined to the Lambert Graben with limited erosion of Cretaceous ultramafic rocks exposed in Mac.Robertson Land (Thomson et al. Reference Thomson, Reiners, Hemming and Gehrels2013). Through Nd isotope studies, van de Flierdt et al. (Reference Van de Flierdt, Hemming, Goldstein, Gehrels and Cox2008) had already suggested a Proterozoic to Cambrian age of source rocks within the Lambert Graben and the Gamburtsev Mountains for the Eocene mudstones from Site 1166. Epsilon-Nd ratios suggest that the upper part of Unit II at Site 1166 was probably sourced from an older, potentially Archaean/Palaeoproterozoic parent material. The geochemical signature of the bulk sediment will be used here to better understand the provenance evolution of the sediments from Unit II and its implications for ice advance and retreat within the Lambert Graben.
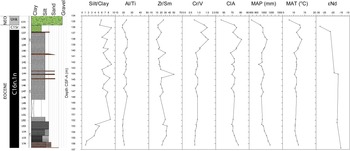
Lithological log and downcore distribution of particle size and geochemical data for Site 1166 in Prydz Bay. The silt/clay ratio is determined based on laser particle-size analysis of the < 2 mm sediment matrix, with the clay-silt boundary at 4 μm. The Al/Ti, Zr/Sm and Cr/V ratios vary with sediment provenance, with Cr/V ratios also affected by chemical weathering (see the main text for details). The MAP values are derived from the CIA-K and the MAT values are derived from the S-index (Sheldon et al. Reference Sheldon, Retallack and Tanaka2002, Passchier et al. Reference Passchier, Bohaty, Jiménez-Espejo, Pross, Röhl and Van De Flierdt2013). Lithological log is from Passchier et al. (Reference Passchier, Ciarletta, Miriagos, Bijl and Bohaty2017). The magnetostratigraphy is from Florindo et al. (Reference Florindo, Bohaty, Erwin, Richter, Roberts, Whalen and Whitehead2003). The εNd column refers to the εNd composition of the mud fraction from van de Flierdt et al. (Reference Van de Flierdt, Hemming, Goldstein, Gehrels and Cox2008). CIA = Chemical Index of Alteration; CSF-A = core depth below sea floor method A; MAP = mean annual precipitation; MAT = mean annual temperature.

Site U1360 is found off the George V coast of the Wilkes Land province. During the late Cretaceous, this region underwent rifting from Australia, creating the continental margin. As spreading continued through the Eocene, an open marine environment formed (Expedition 318 Scientists 2010). Today, the shelf in this region is fed by sediments transported from the Wilkes Subglacial Basin. Outcrops and erratics show that the bedrock geology of the region inland is dominated by late Archaean and early Proterozoic paragneisses and granitoids, early Proterozoic metasedimentary rocks, early to mid-Proterozoic granitoids and migmatites, Cambrian granites, Triassic sandstones and Jurassic dolerites (Goodge & Fanning Reference Goodge and Fanning2010, Godard et al., Reference Godard, Reynes, Bascou, Menot and Palmeri2017, Williams et al. Reference Williams, Kelsey, Hand, Raimondo, Morrissey, Tucker and Dutch2018), as well as rhyolites from further inland (Peucat et al. Reference Peucat, Capdevila, Fanning, Ménot, Pécora and Testut2002). Understanding of the subglacial geology is further enhanced through correlation between Australian geological evidence and geophysical data. Aeromagnetic interpretations suggest that the Wilkes Subglacial Basin consists of a low-lying metasedimentary basement incised with three extensional basins (Ferraccioli et al. Reference Ferraccioli, Armadillo, Jordan, Bozzo and Corr2009, Jordan et al. Reference Jordan, Ferraccioli, Armadillo and Bozzo2013, Aitken et al. Reference Aitken, Young, Ferraccioli, Betts, Greenbaum and Richter2014). The Wilkes Basin is bounded to the west by the Mertz Shear Zone and the Mawson Craton and to the east by a possible magmatic arc terrane (Ferraccioli et al. Reference Ferraccioli, Armadillo, Jordan, Bozzo and Corr2009, Jordan et al. Reference Jordan, Ferraccioli, Armadillo and Bozzo2013, Aitken et al. Reference Aitken, Young, Ferraccioli, Betts, Greenbaum and Richter2014). Towards the Transantarctic Mountains, the basement is interpreted to be covered by Jurassic Ferrar Dolerite (Fig. 1; Jordan et al. Reference Jordan, Ferraccioli, Armadillo and Bozzo2013). The depositional environment for the lower Oligocene interglacial mudstones recovered at Site U1360 can be interpreted as glaciomarine with sea ice based on the presence of gravel-sized outsized clasts interpreted as ice-rafted debris and dinocyst assemblages (Houben et al. Reference Houben, Bijl, Pross, Bohaty, Passchier and Stickley2013, Passchier et al. Reference Passchier, Ciarletta, Henao and Sekkas2019).
Methods and materials
Study sites
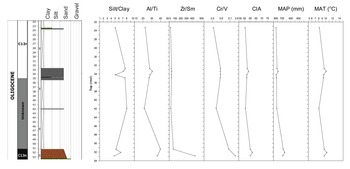
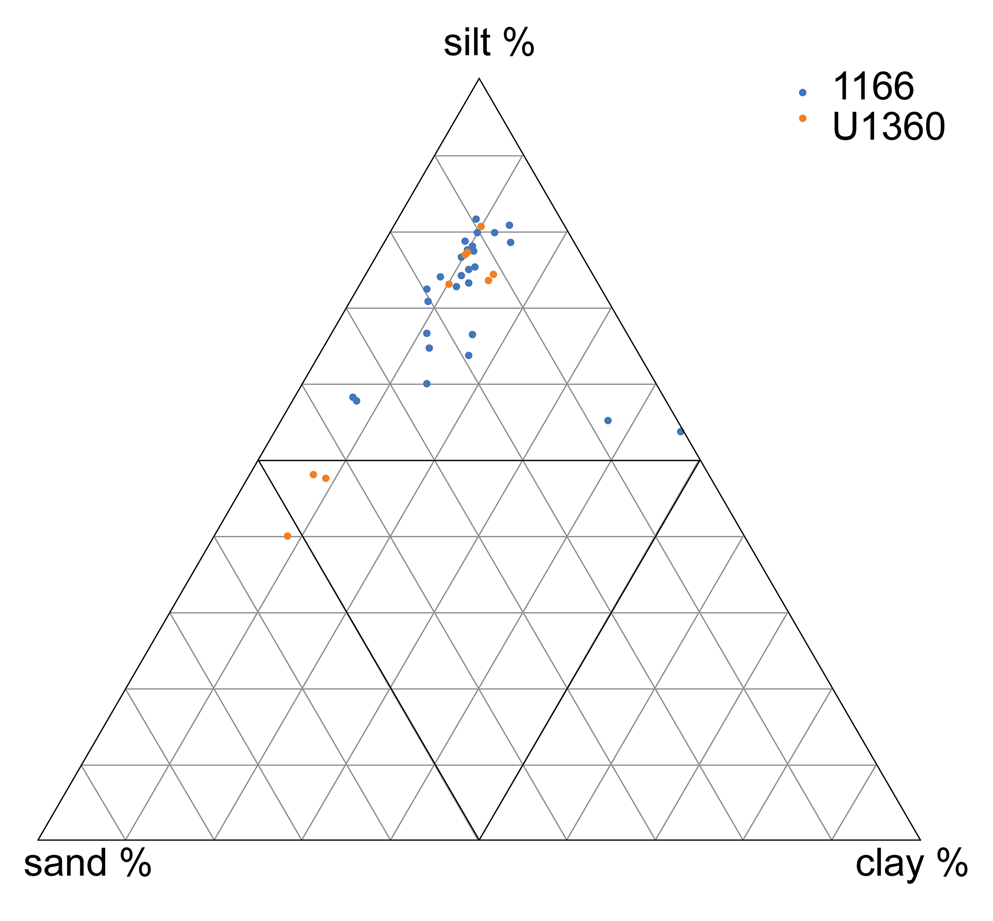
ODP Hole 1166A was drilled in Prydz Bay during ODP Expedition 188 at 475.4 m of water depth and down to 381.3 m below the sea floor (mbsf; Shipboard Scientific Party 2001). This hole was divided into units based on lithology. This study will utilize samples from what has been classified as Unit II, consisting of mudstones with dispersed clasts with interbeds of sand between 135.63 and 156.62 mbsf (Fig. 2; Shipboard Scientific Party 2001). Hole U1360A was drilled by the IODP on Expedition 318 at 66°22.0395′ S and 142°44.7050′ E off the Terre Adélie Coast at 495 m of water depth. The hole was drilled to 70.8 mbsf (Expedition 318 Scientists 2010). The percentage of recovered material was 10%. For this study, we will be focusing on samples from Unit II, specifically cores 3R through 6R (Fig. 3). Investigations of the bulk detrital provenance and weathering history of sediments are ideally carried out on mudstones to avoid grain-size effects (Nesbitt & Young Reference Nesbitt and Young1982, McLennan Reference McLennan2001, von Eynatten et al. Reference Von Eynatten, Tolosana-Delgado and Karius2012). Particle-size data from Sites 1166 and U1360 (Passchier et al. Reference Passchier, Ciarletta, Miriagos, Bijl and Bohaty2017, Reference Passchier, Ciarletta, Henao and Sekkas2019) indicate that the majority of samples from the two sites comprise < 40% sand, > 60% silt and < 20% clay, with a few exceptions (Fig. 4).
Lithological log and downcore distribution of particle size and geochemical data for Site U1360 off Adélie Land. The silt/clay ratio is determined based on laser particle-size analysis of the < 2 mm sediment matrix, with the clay-silt boundary at 4 μm. The Al/Ti, Zr/Sm and Cr/V ratios vary with sediment provenance, with Cr/V ratios also affected by chemical weathering (see the main text for details). The MAP values are derived from the CIA-K and the MAT values are derived from the S-index (Sheldon et al. Reference Sheldon, Retallack and Tanaka2002, Passchier et al. Reference Passchier, Bohaty, Jiménez-Espejo, Pross, Röhl and Van De Flierdt2013). Lithological log is from Passchier et al. (Reference Passchier, Ciarletta, Henao and Sekkas2019). The magnetostratigraphy is from Houben et al. (Reference Houben, Bijl, Pross, Bohaty, Passchier and Stickley2013). CIA = Chemical Index of Alteration; MAP = mean annual precipitation; MAT = mean annual temperature; mbsf = metres below the sea floor.

Particle-size distribution of samples from Sites 1166 and U1360 on a sand-silt-clay ternary plot. The grain-size classes are according to Wentworth (Reference Wentworth1922), with the clay-silt boundary at 4 μm.

Age model
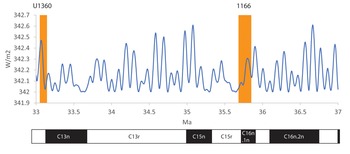
Detailed magnetobiostratigraphical age models have been developed for Site 1166 (Shipboard Scientific Party 2001) and Site U1360 (Expedition 318 Scientists 2010). Originally, Hole 1166A was thought to contain late Eocene to early Oligocene sediment in what was classified as lithostratigraphic Unit II (Shipboard Scientific Party 2001). However, Florindo et al. (Reference Florindo, Bohaty, Erwin, Richter, Roberts, Whalen and Whitehead2003) conducted a palaeomagnetic study, creating an updated age model for Site 1166 by constraining palaeomagnetic data with diatom and radiolarian assemblages. Based on the palaeomagnetic data and diatom assemblages, it was interpreted that Unit II could have coincided with Chron 12r and Chron 13n, or Chron 15r through Chron 17 (Florindo et al. Reference Florindo, Bohaty, Erwin, Richter, Roberts, Whalen and Whitehead2003). Using the first occurrence of the dinoflagellate Deflandrea sp. A., Passchier et al. (Reference Passchier, Ciarletta, Miriagos, Bijl and Bohaty2017) placed Unit II in the latter category, correlating the lower part of Unit II to Chron 16n.1n. The reversal located in the upper section of Unit II would then be Chron 15r, indicating that Unit II is late Eocene in age (Passchier et al. Reference Passchier, Ciarletta, Miriagos, Bijl and Bohaty2017). Based on the magnetobiostratigraphical interpretation, the sandy mudstones in Unit II are dated to the interglacial between c. 35.8 and 35.7 Ma, calibrated to the Vandenberghe et al. (Reference Vandenberghe, Hilgen, Speijer and Gradstein2012) timescale (Fig. 5).
The timing of the late Eocene and early Oligocene deglaciation sequences of Sites 1166 and U1360 relative to the calculated insolation at 70° S (Laskar Reference Laskar, Robutel, Joutel, Gastineau, Correia and Levrard2004). Magnetic polarity chrons according to Vandenberghe et al. (Reference Vandenberghe, Hilgen, Speijer and Gradstein2012).

Initial ages for Unit II of Site U1360 were dated as early Oligocene based on diatoms and dinocysts (Expedition 318 Scientists 2010). Reversed polarity was found in two samples from Site U1360 that correlated to Chron 12r; in combination with the biostratigraphy, it provided a reliable Oligocene age (Expedition 318 Scientists 2010). Houben et al. (Reference Houben, Bijl, Pross, Bohaty, Passchier and Stickley2013) published an updated magnetobiostratigraphical age model for Site U1360. The updated age model was based on the first occurrence of the fossil taxa Malvinia escutiana that coincides with the Oi-1 oxygen isotope excursion event (Houben et al. Reference Houben, Bijl, Pross, Bohaty, Passchier and Stickley2013). Malvinia escutiana first occurs at 42.02 mbsf in core 5R, and from 5R to 3R Oligocene diatom taxa, such as Goniothecium rogersii, Hemiaulus sp., Pyxilla sp., Stephanopyxis sp., Fragilaria spp. and Kisseleviella cicatricata, were found (Houben et al. Reference Houben, Bijl, Pross, Bohaty, Passchier and Stickley2013). Magnetic polarity showed a normal interval in core 6R and a reversed polarity interval in cores 4R and 3R; based on the taxa and polarity intervals, it was determined that core 6R probably matched Chron 13n, which would suggest that the reversal located above was dated to the base of Chron 12r (Houben et al. Reference Houben, Bijl, Pross, Bohaty, Passchier and Stickley2013). The sedimentary facies succession that was recovered, the total thickness and sedimentation rates are consistent with a typical deglacial sequence on the East Antarctic continental margin (cf. Passchier et al. Reference Passchier, Ciarletta, Henao and Sekkas2019). Therefore, we interpret the mudstone sequence as sampling the earliest Oligocene deglaciation at c. 33.1 Ma (Fig. 5).
Geochemical analysis
Preparation and analysis of samples were based on the shipboard guidelines of Murray et al. (Reference Murray, Miller and Kryc2000), and analysis was carried out on a Horiba Jobin-Yvon Ultima inductively coupled plasma-optical emission spectrometer (ICP-OES) and Thermo Scientific iCap Q inductively coupled plasma-mass spectrometer (ICP-MS) at Montclair State University. Major, trace and rare earth element (REE) intensities were used to calculate palaeoclimate proxies, changes in provenance and elemental enrichments for Sites 1166 and U1360.
ICP-OES was conducted on 27 samples from Site 1166 and 9 samples from Site U1360. Samples were first powdered using an alumina mortar and pestle. Powdered samples were then weighed to 100 mg and dry mixed with 400 mg of lithium metaborate. Blanks of lithium metaborate alone were also weighed, and the sample mixtures, along with the blanks, were placed in graphite crucibles and heated in a furnace to 1050°C for 30 min. Crucibles were removed from the furnace, swirled and replaced for an additional 10 min. Crucibles were then removed from the furnace again, and the samples were digested in 50 mL of 7% nitric acid and filtered into 60 mL Nalgene sample bottles to acquire a concentration of 500× sample solution. From the 500× solution, a 4000× solution was created for the sample analysis on the OES by pipetting 6.5 mL of 500× solution into a bottle and adding 50 mL of 2% nitric acid. Both the 500× solution and the 4000× solution sample bottles were stored in a refrigerator to reduce the chance of chemical reactions occurring in the samples. Subsequently, the 4000× solutions were poured into test tubes and placed in an organized rack formation for analysis. Ten calibration standards from the United States Geological Survey (USGS; i.e. DNC-1, BHVO2, W2, BCR2, AGV2, GSP2, BIR, G2, QLO1 and RGM-1) and two internal standards (MAG-1 and SCO1) were also prepared in the same manner and added to the rack for analysis. Samples for ICP-MS analysis were diluted to a 10 000× solution from the original 500× solution used for ICP-OES analysis. The 10 000× solution was prepared by pipetting .5 mL of 500× solution into a test tube and diluting it with 9.5 mL of 2% nitric acid.
Provenance tracing
Aluminium and titanium are conservative elements, meaning they are not easily altered in the surface environment or the water column during sedimentation and carry the signature of their source rock. This allows the wt% ratio of Al2O3/TiO2 to show changes in source rock over time throughout the core. To better constrain provenance at Sites 1166 and U1360, trace elements and REEs were used to create bivariate ratio plots. Enrichments of REEs were calculated using the normalized wt% and normalized ppm of elements in each sample divided by the Post-Archaean Average Australian Shale (PAAS; Taylor & McLennan Reference Taylor and McLennan1985, Barth et al. Reference Barth, McDonough and Rudnick2000). Values were then set to a logarithmic scale; values > 1 indicate enrichment, while values < 1 indicate a depletion of that element in the sample.
Weathering proxies
The CIA (Nesbitt & Young Reference Nesbitt and Young1982) is used on mudrocks to calculate the degree of chemical weathering from the molar concentrations of Al2O3, CaO, Na2O and K2O using Eq. (1).
 $${\rm CIA} = \left[{\displaystyle{{{\rm A}{\rm l}_2{\rm O}_3} \over {{\rm A}{\rm l}_2{\rm O}_3{\rm \;} + {\rm \;CaO\;} + {\rm \;N}{\rm a}_2{\rm O\;} + {\rm \;}{\rm K}_2{\rm O}}}} \right]\times 100$$
CIA values > 65 indicate an environment prone to chemical weathering, probably warmer and more humid, whereas values < 65 indicate an environment prone to physical weathering and an increase in glacial rock flour (Nesbitt & Young Reference Nesbitt and Young1982, Passchier et al. Reference Passchier, Ciarletta, Miriagos, Bijl and Bohaty2017), probably an indication of glacial growth. The molar value of CaO in the CIA calculation needs to be the silicate mineral contribution of CaO. Bulk samples may contain calcium in the form of calcium carbonate (CaCO3), and a carbonate correction is typically carried out. However, upon exposure to 10% HCl, splits of the mud samples showed a very weak reaction or no reaction at all. Furthermore, measured CaO values in the samples were very low. Therefore, a carbonate correction was not used for either Site 1166 or Site U1360 in calculating the CIA values.
Mean annual precipitation (MAP) and mean annual temperature (MAT) were calculated using mudrocks from Sites 1166 and U1360 according to methods from Passchier et al. (Reference Passchier, Bohaty, Jiménez-Espejo, Pross, Röhl and Van De Flierdt2013) and Sheldon et al. (Reference Sheldon, Retallack and Tanaka2002). MAP for each site was calculated using Eq. (2).
 $${\rm MAP} = 143.75{\rm e}^{0.0232( {{\rm CIA}-{\rm K}} ) }$$
To calculate MAP, the equation requires a version of the CIA in which K2O is removed, known as the CIA-K (Sheldon et al. Reference Sheldon, Retallack and Tanaka2002, Passchier et al. Reference Passchier, Bohaty, Jiménez-Espejo, Pross, Röhl and Van De Flierdt2013).
MAT was calculated using Eq. (3), in which S is the molar ratio of K2O and Na2O to Al2O3 (Sheldon et al. Reference Sheldon, Retallack and Tanaka2002).
 $${\rm MAT} = -18.5( S ) + 17.3$$
Once values were calculated for both MAP and MAT, they were compared to previously published precipitation and temperature data (Macphail & Truswell Reference Macphail, Truswell, Cooper, O'Brien and Richter2004, Passchier et al. Reference Passchier, Bohaty, Jiménez-Espejo, Pross, Röhl and Van De Flierdt2013, Tibbett et al. Reference Tibbett, Scher, Warny, Tierney, Passchier and Feakins2021) based on both terrestrial climofunctions and palynology.
Results
Mud provenance
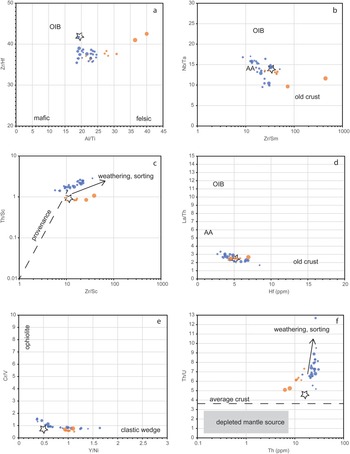
The first step in provenance tracing was to calculate elemental ratios that track detrital minerals at each site to determine whether there were changes in the values that would indicate a change in source material. To check for grain size effects on the data, bubble plots were created in which the size of the marker is equivalent to the sand % in the < 2 mm fraction (Fig. 6). High field strength elements Zr, Hf, Nb, Ta, Al and Ti are typically partitioned in the detrital fraction of marine sediments and can be used as provenance tracers (e.g. Bonjour & Dabard Reference Bonjour and Dabard1991, Plank & Langmuir Reference Plank and Langmuir1998, Young & Nesbitt Reference Young and Nesbitt1998). Zr/Hf ratios in pelagic marine sediments are typically ~35 (Plank & Langmuir Reference Plank and Langmuir1998), and for the PAAS they are ~42 (McLennan Reference McLennan2001), whereas Nb/Ta ratios for both are ~14. In comparison, the Zr/Hf ratios for the Antarctic mudstones fall between 35 and 42, and mudstones also show a larger range of values for Nb/Ta of between 9 and 18, suggestive of variable local source rock compositions directly upstream (Foley et al. Reference Foley, Tiepolo and Vannucci2002). The Al2O3/TiO2 values at Site 1166 ranged from ~18 to 25, which is not a large range, suggesting mostly mafic to intermediate rocks in the source areas. In contrast, Al2O3/TiO2 ratios of Site U1360 sediments revealed values ranging from ~21 to ~46, and this large range suggests that the sediments were sourced from different intermediate and felsic types of source rocks through time.
Bivariate plots for the analysis of the detrital geochemistry and provenance of the mudstones from Sites 1166 in Prydz Bay and U1360 off Adélie Land. Stars designate the composition of the Post-Archaean Average Australian Shale (PAAS; Taylor & McLennan Reference Taylor and McLennan1985, Barth et al. Reference Barth, McDonough and Rudnick2000). The size of the marker is proportional to the sand % in the < 2 mm fraction. a. Al/Ti oxide wt% vs Zr/Hf ratios separate felsic from mafic igneous sources and fractionated melt-derived (low Zr/Hf) from primitive melt-derived (high Zr/Hf), such as ocean island basalt (OIB). b. Nb/Ta vs Zr/Sm ratios showing that interglacial mudstone samples resemble intermediate andesitic arc (AA) or PAAS composition, with only two samples from Site U1360 showing affinities to early continental crust (cf. Foley et al. Reference Foley, Tiepolo and Vannucci2002). c. Zr/Sc vs Th/Sc plot showing the passive margin signature of the source regions and the relatively small effects of sediment sorting (cf. McLennan et al. Reference McLennan, Hemming, McDaniel and Hanson1993, figs 3 & 9) and the Th enrichment of the 1166 samples over the U1360 samples as a result of differences in provenance and chemical weathering. d. La/Th vs Hf (ppm) plot showing the close affinity in provenance of Antarctic interglacial mudstones and PAAS, with a slightly more mafic contribution at Site 1166. e. Y/Ni vs Cr/V plot showing the enrichment in Y for the Adélie Land samples compared to the PAAS and the low Cr/V ratios, with slight enrichment in Prydz Bay due to chemical weathering (see text for discussion). f. Th (ppm) vs Th/U plot (cf. McLennan et al. Reference McLennan, Hemming, McDaniel and Hanson1993) showing the effect of U depletion due to metamorphism and chemical weathering on the composition of the 1166 mudstones and the low Th attributed to Archaean crustal sources for the samples at the base of Site U1360.

A Th/Sc vs Zr/Sc plot was produced to determine whether the samples showed effects of sediment recycling and sorting (McLennan et al. Reference McLennan, Hemming, McDaniel and Hanson1993). Th/Sc values are generally higher for mudstones from Site 1166 in Prydz Bay than for mudstones from Site U1360. For both locations, Zr/Sc ratios slightly increase with grain size (Fig. 6c; McLennan et al. Reference McLennan, Hemming, McDaniel and Hanson1993); La/Th and Hf values are very similar to those in the PAAS (Fig. 6d). Cr/V ratios for Site 1166 are slightly elevated over the PAAS, and Y/Ni ratios are elevated for the majority of samples and more spread out for Site 1166 (Fig. 6e).
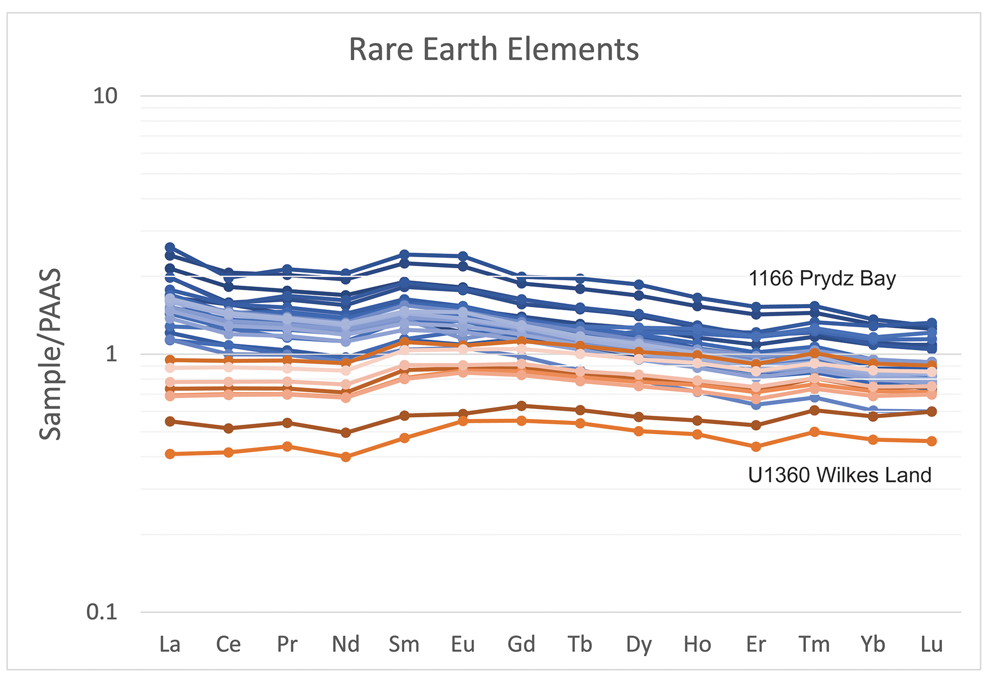
Elemental spider diagrams were created for REEs normalized to the PAAS (Fig. 7). Sediments from Site U1360 are similar in REE distribution to the PAAS, although some samples (those from core 6R) are depleted in light REEs (LREEs). In contrast, sediments from Site 1166 in Prydz Bay show elevated REE abundances relative to the PAAS, especially for the LREEs. The Eu anomaly and chrondrite-normalized Gd/Yb ratios of the 1166 and U1360 sediments are similar to those of average post-Archaean sedimentary rocks (Supplemental Fig. 2).
Rare earth element enrichments and depletions relative to the Post-Archaean Average Australian Shale (PAAS; Taylor & McLennan Reference Taylor and McLennan1985, Barth et al. Reference Barth, McDonough and Rudnick2000).

Chemical Index of Alteration
Site 1166, Unit II, shows CIA values for the upper Eocene to be between 68 and 81 (Fig. 2). The overlying Neogene glacial diamict shows a value of 57. Shipboard logs for Site 1166 show carbonate values up to 3.340% in some core intervals (O'Brien et al. Reference O'Brien, Cooper and Richer2001). However, in the mudstone samples selected for this study at Site 1166, CaO values were so low that even applying a small correction generated negative CaO values. For Site U1360, the shipboard data documented carbonate values up to 0.683%. To check for the impact of small amounts of carbonate on the CIA, a carbonate correction was simulated for Site U1360 data at 0% and 1% CaCO3. CIA values calculated at 0% carbonate range from 56 to 59, while CIA values calculated with a 1% carbonate correction range from 58 to 61 for the early Oligocene (Fig. 3). At Site 1166, upper Eocene values are > 65 and are consistent with a chemical weathering regime (Nesbitt & Young Reference Nesbitt and Young1982). In contrast, lower Oligocene sediments from Site U1360 give values < 65, consistent with a dominant physical weathering regime.
Mean annual precipitation/mean annual temperature
Calculated MAP for the upper Eocene mudstones in Prydz Bay showed values between ~906 and ~1171 mm (Fig. 2). For Site U1360, after applying a simulated carbonate correction of 1%, values with no carbonate correction range from 631 to 731 mm, while values that were carbonate corrected ranged from 674 to 817 mm (Fig. 3). The 1% change in carbonate accounts for a difference of between 43 and 91 mm annually.
Calculated MAT values in the Prydz Bay upper Eocene mudstones fluctuate between 10.2°C and 13.7°C (Fig. 2). The trend plots similarly to CIA values, showing a drop of ~2°C from 156.26 to 153.81 mbsf, as well as fluctuations between 10.0°C and 11.5°C upcore. There is a marked upward increase to 13.7°C at ~138 mbsf, consistent with peaks in CIA values and precipitation. In comparison to the upper Eocene mudstones from Site 1166, the lower Oligocene mudstones from Site U1360 show lower temperatures, ranging from 8.2°C to 10.4°C (Fig. 3). The trend in temperature appears to show a ~2°C warming upcore and later a similar amount of cooling (Fig. 3).
Standard errors were calculated for both MAP and MAT proxies by Sheldon et al. (Reference Sheldon, Retallack and Tanaka2002) and show values of ± 182 mm and ± 4.4°C, respectively.
Discussion
Site 1166
Initial analysis of the elements downcore showed an increase in mafic elements Cr, Ni and V and an increase in the Cr/V ratio (Fig. 6). A particle-size influence was ruled out, but higher CIA values in core 15R (Fig. 2) correlate with the elevated ppm in Cr and Ni, which can be enriched in sediments due to the chemical weathering of olivine and orthopyroxene derived from ultramafic source rocks (Malkowski et al. Reference Malkowski, Sharman, Johnstone, Grove, Kimbrough and Graham2019). Furthermore, the upper Eocene mudstones are enriched in REEs compared to the PAAS (Fig. 7). Such an enrichment is explained by a larger component of heavy minerals in the Prydz Bay sediments due to erosion of (ultra)mafic crystalline basement rocks (see also Supplemental Fig. 1).
The northern Prince Charles Mountains and the Grove Mountains both contain mafic granulites (Munksgaard et al. Reference Munksgaard, Thost and Hensen1992, Liu et al. Reference Liu, Jahn, Zhao and Zhao2007), and the southern Prince Charles Mountains contain a swarm of mafic dykes (Mikhalsky et al. Reference Mikhalsky, Boger and Henjes-Kunst2013). However, the northern and southern Prince Charles Mountains include sequences of sedimentary or metasedimentary rocks, which typically dilute the heavy mineral component as a source; this is incompatible with the REE enrichment (Fig. 7). Moreover, the northern Prince Charles Mountains host Cretaceous intrusions, and, according to apatite fission track ages obtained from Unit II at Site 1166, the coarse sediment fraction in this unit does not contain material of Cretaceous age (Thomson et al. Reference Thomson, Reiners, Hemming and Gehrels2013). This makes a reasonable case for either the Grove Mountains or the Gamburtsev Subglacial Mountains as possible sources for the mafic material. Spatial distributions of elemental ratios of Nb/Ta, Sm/Zr, Cr/V and Al/Ti in basement rocks around Prydz Bay support a more southernly or south-easterly source for the Site 1166 mudstones (Supplemental Fig. 2).
Nd isotopic ratios (ɛNd) from van de Flierdt et al. (Reference Van de Flierdt, Hemming, Goldstein, Gehrels and Cox2008) show large negative ɛNd values for Unit II, with calculated crustal residence ages of 2.0–3.0 Ga, suggesting a very old Proterozoic/Archaean upper crustal source material. The ages increase from the bottom of Unit II upward, with the oldest ages coinciding with the peak of mafic enrichment (Fig. 2). The ɛNd crustal residence ages from the Grove Mountains show the majority of rocks ranging from 1.76 to 1.65 Ga, with the exception of felsic orthogneisses that range from 2.46 to 2.27 Ga and a 50 m wide paragneiss outcrop that contains spinel and has an ɛNd value of -24.5, with a residence age of 2.99 Ga (Liu et al. Reference Liu, Jahn, Zhao and Zhao2007). The southern Prince Charles Mountains region shows ɛNd values that range from -0.5 to -23, with residence ages from 1.66 to 3.85 Ga (Mikhalsky et al. Reference Mikhalsky, Boger and Henjes-Kunst2013). Based on the ɛNd values, crustal residence ages and REE enrichment, it is probable that either the Gamburtsev Subglacial Mountains or the Grove Mountains were the source material for the mafic component in the interglacial mudstones. Veevers et al. (Reference Veevers, Saeed and O'Brien2008) favoured a Gamburtsev Subglacial Mountains source for the Eocene sands underlying the interglacial mudstone section at Site 1166.
The Gamburtsev Subglacial Mountains are considered to be the nucleation point for ice growth in the Prydz Bay region (DeConto & Pollard Reference DeConto and Pollard2003). Late Eocene drainage and topographical reconstructions (van de Flierdt et al. Reference Van de Flierdt, Hemming, Goldstein, Gehrels and Cox2008, Wilson et al. Reference Wilson, Jamieson, Barrett, Leitchenkov, Gohl and Larter2012) indicate that a glacial path from this nucleation point would travel through the southern Prince Charles Mountains and the Lambert Graben, eventually draining into Prydz Bay (Fig. 1). It has been established that Site 1166 during the late Eocene was ice proximal (Strand et al. Reference Strand, Passchier and Näsi2003), meaning that a glacier was present in the hinterland of Prydz Bay. One explanation as to why the mafic component is not seen earlier (Fig. 2) may lie in glacial retreat to the southern portion of the Lambert Graben (Thomson et al. Reference Thomson, Reiners, Hemming and Gehrels2013). Sedimentary facies and increasing CIA suggest that the outlet glaciers were retreating from the sediment-filled ancient rift valleys onto higher cratonic terranes.
Site U1360
High Al2O3/TiO2 ratios > 35 appear in sandy diamict and sandy mudstone samples in core 6R at the base of the early Oligocene glacial sediments in Site U1360 (Figs 3 & 4). Whereas grain size does not appear to be correlative with the detrital sediment ratios, pre-glacial weathering could be responsible for the high Al2O3/TiO2 ratios. Young & Nesbitt (Reference Young and Nesbitt1998) discuss a similar data sequence and attribute the elevated Al2O3/TiO2 ratios at the base of the Proterozoic Gowganda glacial sequence to the incorporation of weathered material from the pre-glacial substrate at the onset of glaciation. This interpretation is supported by the presence of abundant marine palynomorphs Vozzhennikovia spp. and Enneadocysta diktyostila of the Transantarctic flora and Nothofagus and saccate pollen in the same core (Houben et al. Reference Houben, Bijl, Pross, Bohaty, Passchier and Stickley2013). Similarly, Zr/Sc, Zr/Sm and U/Th ratios in core 6R are probably affected by the incorporation of pre-glacial weathered material into the basal glacial sediment. Besides these samples from core 6R in Site U1360, the elemental ratios of the overlying sediments consistently point to a more felsic terrain. This is consistent with the REE and other trace elemental depletions (Fig. 7). However, the Al2O3/TiO2 ratios of 27–30 for the mudstones in core 4R that was not affected by pre-glacial sediment recycling are higher than the values of 20–22 found for Plio-Pleistocene diamictites in core 1R at Site U1360 (Expedition 318 Scientists 2010) and at nearby Site U1358 (Orejola et al. Reference Orejola and Passchier2014). Muscovite-biotite and biotite granite clasts were found in dredges off the coast (Goodge & Fanning Reference Goodge and Fanning2010) and were interpreted to be sourced from the Mertz Glacier. Our data suggest that during the early Oligocene the dominant sediment source to Site U1360 came from these granites to the east of the Mertz Glacier region (Goodge & Fanning Reference Goodge and Fanning2010). This is consistent with reconstructions of crustal thickness and erosion modelling that suggest most of the glacial erosion since ice inception took place to the north-west within the Wilkes Subglacial Basin, directly inland from Site U1360 in an area overlapping with the western and central basins (Jordan et al. Reference Jordan, Ferraccioli, Armadillo and Bozzo2013). After pre-glacial sediment was evacuated, incision into granitic basement rocks is evident from the composition of the early Oligocene glaciomarine mudstones at Site U1360. These mudstones have detrital geochemical compositions very similar to the PAAS (Fig. 6), except for enrichments in Y, higher Al/Ti oxide and Th/U ratios, lower Zr/Hf ratios and depletion in LREEs (Fig. 7). The geochemical signature of these U1360 mudstones could be derived from younger evolved granitic intrusions that are hypothesized to be hosted within the cratonic complex of metamorphosed Precambrian-Ordovician igneous and sedimentary basement (Fitzsimons Reference Fitzsimons2000, Aitken et al. Reference Aitken, Young, Ferraccioli, Betts, Greenbaum and Richter2014).
Palaeoclimatic conditions
The palaeoclimate of the glacial foreland is strongly coupled to the advance and retreat of an ice sheet. At Site 1166 in Prydz Bay, diatom productivity in the late Eocene was good, with neritic to open marine diatom assemblages in Unit II indicating water depths > 50 m (Shipboard Scientific Party 2001). Diatom assemblages with high abundances of planktonic species suggest open marine conditions for the interval of ~142–147 mbsf, with high biogenic opal content. The presence of iron sulphide below ~140 mbsf (Florindo et al. Reference Florindo, Bohaty, Erwin, Richter, Roberts, Whalen and Whitehead2003) may point to suboxic bottom conditions, which could also explain the lack of bioturbation and the well-preserved lamination at the bottom of this mudstone interval (Fig. 2). These observations are consistent with a stratified water column, which can be explained by an influx of meltwater from a smaller ice sheet or ice cap grounded on land.
Indeed, the calculated CIA values for late Eocene sediments of Unit II in Prydz Bay indicate a dominant chemical weathering regime, with values > 65. The Eocene values are consistent with previous studies from the area that range from ~67 to 80 (Passchier et al. Reference Passchier, Bohaty, Jiménez-Espejo, Pross, Röhl and Van De Flierdt2013, Reference Passchier, Ciarletta, Miriagos, Bijl and Bohaty2017). Lower values of 68 may indicate an increase in physical weathering (Passchier et al. Reference Passchier, Ciarletta, Miriagos, Bijl and Bohaty2017) but probably do not indicate continental-scale ice-sheet growth. Higher values of 77–80 indicate a more intense chemical weathering period, consistent with higher temperatures and increased precipitation with an absence of physical weathering. Contrastingly, the Neogene diamict that unconformibly overlies these sediments indicates a dominant physical weathering regime, with a value of 57, which is in the same range as Pleistocene diamictons in Prydz Bay (Passchier et al. Reference Passchier, Ciarletta, Miriagos, Bijl and Bohaty2017).
MAT values calculated from the S-index range from ~10°C to ~14°C for the late Eocene and provide an average for the source region of the detrital sediment. Using the methylation of branched tetraether proxy, Tibbett et al. (Reference Tibbett, Scher, Warny, Tierney, Passchier and Feakins2021) found that mean annual air temperature for the coast of Prydz Bay was ~14°C, with a maximum of 20°C. MAP values based on the CIA-K ratio for the Prydz Bay region during the late Eocene range from ~906 mm to ~1171 mm. These values are consistent with a warm and humid environment, in agreement with the dominant kaolinite clay mineralogy found at the base of Unit II at Prydz Bay (O'Brien et al. Reference O'Brien, Cooper and Richer2001). Macphail & Truswell (Reference Macphail, Truswell, Cooper, O'Brien and Richter2004) described a low diversity of angiosperm species of Nothofagus, Araucariaceae and Podocarpaceae in the upper Eocene sediments of Site 1166, interpreted as a cool-cold temperate rainforest scrub environment. It is mentioned that similar modern-day taxa are found in regions with 1200–2500 mm/year precipitation (Macphail & Truswell Reference Macphail, Truswell, Cooper, O'Brien and Richter2004). Whereas the detrital sediment MAP is an average for the entire catchment from which the sediment was derived, the vegetation was probably concentrated along the coast.
Based on apatite fission track and zircon U-Pb ages of ice-rafted debris found at distal Site 696, Carter et al. (Reference Carter, Riley, Hillenbrand and Rittner2017) suggested that widespread glaciation would have been present by c. 36 Ma, enough so that glacial ice would have reached the ocean in the southern Weddell Sea sector. On the other side of East Antarctica, based on the presence of tunnel valleys, Gulick et al. (Reference Gulick, Shevenell, Montelli, Fernandez, Smith and Warny2017) argued that a dynamic marine-terminating ice sheet was present in the Aurora Basin from the Eocene to the Miocene. However, this contrasts with the persistent low erosion rates determined for the East Antarctic source areas of sediments of similar age in Prydz Bay (Cox et al. Reference Cox, Thomson, Reiners, Hemming and Van De Flierdt2010). Furthermore, using sediment cores from the Ross Sea, Galeotti et al. (Reference Galeotti, DeConto, Naish, Stocchi, Florindo and Pagani2016) suggested that a full-scale ice sheet was not present until c. 32 Ma.
The combined CIA, temperature and precipitation data from this study on Site 1166 in Prydz Bay do not suggest a significant glacial rock flour contribution from East Antarctica during the c. 35.7 Ma interglacial (Nesbitt & Young Reference Nesbitt and Young1982, Passchier et al. Reference Passchier, Bohaty, Jiménez-Espejo, Pross, Röhl and Van De Flierdt2013), meaning that it is probable that, during part of the late Eocene, the ice-sheet extent was limited and surface conditions were warm and humid (Passchier et al. Reference Passchier, Ciarletta, Miriagos, Bijl and Bohaty2017, Tibbett et al. Reference Tibbett, Scher, Warny, Tierney, Passchier and Feakins2021). This interpretation was confirmed by recent modelling studies that show that even with a maximum topography (Wilson et al. Reference Wilson, Jamieson, Barrett, Leitchenkov, Gohl and Larter2012, Paxman, et al. Reference Paxman, Jamieson, Hochmuth, Gohl, Bentley, Leitchenkov and Ferraccioli2019) the late Eocene ice sheet could have had a significantly reduced size in interglacials with a c. 100 kyr periodicity before the Oi-1 event (Van Breedam et al. Reference Van Breedam, Huybrechts and Crucifix2022).
Contrastingly, early Oligocene sediments from Site U1360 on the Wilkes Land margin show a dominant physical weathering regime, as CIA values for samples, even those that were carbonate corrected, are < 65. This suggests an environment with a larger contribution of glacial rock flour. Temperatures between ~8°C and ~10°C and annual precipitation ranging between ~631 and ~731 mm suggest that the earliest Oligocene interglacial at Wilkes Land had a cooler and more arid surface climate. The palaeoclimate data recovered from the Wilkes Land site indicate a significant amount of glacial rock flour present at the beginning of the Oligocene (c. 34 Ma), which is consistent with clay mineralogy showing dominant illite and chlorite and with the abrupt aridification and persistent cooling in East Antarctica reconstructed from other nearby drill sites (Pross et al. Reference Pross, Contreras, Bijl, Greenwood, Bohaty and Schouten2012, Houben et al. Reference Houben, Bijl, Pross, Bohaty, Passchier and Stickley2013, Passchier et al. Reference Passchier, Bohaty, Jiménez-Espejo, Pross, Röhl and Van De Flierdt2013).
Conclusions
During the late Eocene interglacial c. 35.7 Ma, significant ice was not present in Prydz Bay based on CIA values > 65 (dominant chemical weathering regime) and temperatures in the catchment reaching ~14°C. Consistent warming was captured from the mudstones recovered at Site 1166, which coincides with a mafic trace element geochemistry with REE enrichment over the PAAS. The mudstone section documents a late Eocene glacial retreat cycle, with an increase in chemical weathering affecting sediment delivery from ultramafic source areas through time.
Contrastingly, early Oligocene Site U1360 showed CIA values < 65 and cooler temperatures, indicating a dominantly physical weathering regime and cold, arid terrestrial environments during deglaciation. High Al2O3/TiO2 ratios at the base of the glacial sequence are probably the result of incorporation of pre-glacial weathered material. Overall, the geochemical study allowed for a better understanding of glacial dynamics in East Antarctica during the late Eocene, as well as the change from Eocene warm, humid, ‘greenhouse’ interglacials to Oligocene cold, arid, ‘icehouse’ deglacial conditions, consistent with the growth of a continental ice sheet in East Antarctica.
Acknowledgements
This research uses samples provided by the International Ocean Discovery Program. Dr Xiaona Li is thanked for her assistance in collecting the ICP-MS data at Montclair State University. The data are available at the US Antarctic Program Data Center. This manuscript received two anonymous reviews, which helped to improve the clarity of the text.
Financial support
This research was supported by US National Science Foundation award # ANT 1743643, EAR 1531719 and ANT 1245283 to SP.
Author contributions
JJL carried out the sample preparation, instrument analysis, initial data analysis and interpretation and wrote the first draft of the manuscript in the form of a master's thesis. SP designed the project and conducted the final writing, drafting and editing of the manuscript prior to submission with input from JJL.
Supplemental material
Two supplemental figures and a list of additional references will be found at https://doi.org/10.1017/S0954102023000159.