At least in the United States and probably much of the rest of the world, teachers are blamed or praised for the academic achievement of the students they teach. Reading some educational research it is easy to get the idea that teachers are entirely responsible for the success of educational outcomes. I argue that this idea is badly mistaken. Teachers are responsible for a relatively small portion of the total variance in students’ educational outcomes. This has been known for at least 50 years. There is substantial research showing this but it has been largely ignored by educators.
I further argue that the majority of the variance in educational outcomes is associated with students, probably as much as 90% in developed economies. A substantial portion of this 90%, somewhere between 50% and 80% is due to differences in general cognitive ability or intelligence. Most importantly, as long as educational research fails to focus on students’ characteristics we will never understand education or be able to improve it.
So that it is clear what is being discussed, consider the following thought experiment. We begin with two groups of 50 randomly selected teachers and 1,000 randomly selected students. Some measure of teacher quality is available. Though many measures of teacher quality have been suggested, most are based on the achievement of the students they have previously taught. Such measures often take into account ability of the students and how much they have gained from previous teachers. In other words, the teacher is evaluated on the degree they do better or worse than previous teachers with the same student. Such measures are referred to as value added (VA) measures of teacher quality. In addition, we obtain the IQ of each student based on a good measure of general intelligence.
For one condition, 20 students are randomly assigned to each of the 50 teachers. Call this the teacher quality condition. For a second condition, the students are rank ordered by IQ score. Beginning with the most able student, students are divided into groups of 20. The result is 20 groups of students from most able to least able as indicated by IQ. Teachers are then randomly assigned to groups of students. Call this the student ability condition.
In the teacher quality condition, the groups can be ordered on the basis of teacher quality ranging from best to the worst teacher. In the student ability condition, groups can be ordered from the most able student to the least able. For each group in each condition, a measure of student achievement is obtained before they begin instruction and then again after. Each group, regardless of condition, is now taught using identical content for a fixed length of time by the teacher. At the end of the instructional period, each student’s gain is calculated.
We can now calculate average student gain for each group in each condition. The question is will students with better teachers do better than the teachers with smarter students. We can address this issue by correlating each teacher’s rating of quality with the group average of student gain in the teacher quality condition. In the student ability condition, the same measure of academic achievement is correlated with average student ability of the group.
I predict that the correlation in the teacher quality group will never exceed 0.32 or, squaring the correlation, 10% of total variance accounted for. In the student ability group, the correlation between student achievement and mean student ability will be much higher and may be as high as 0.95 or up to 90% of the total variance. It may not be possible to account for as much as 90% of the total variance based on cognitive ability alone, but characteristics of students will account for most of the variance and general cognitive ability will account for a substantial portion of that.
While this thought experiment may clarify the point being made here, the actual world is substantially more complex. One could divide the world into a hierarchical series of nested variables such as the following: Country, state, district, school, class, teacher, and student. For the purpose of this paper, interest will be in all the variables associated with students and all those variables that are not. In addition to intelligence, variables associated with students may include things like socioeconomic status, grit, motivation, and numerous other variables. Similarly, many variables besides teacher quality can be associated with schools and schooling including money spent per pupil, quality of administrators like principals and superintendents, type of instruction, length of school day or school year, neighborhood characteristics of the school, and class size to name a few.
In general, these variables will be discussed as student or school variables. An easy way to think about this is to think that if a student walks away from a school, what variables travel with the student and what variables stay with the school. The proportion of variance in academic achievement associated with schools sets an upper limit for any of the variables nested within schools. Since teachers are nested within schools, they will be limited by the amount of variance in achievement attributable to schools. What the data to be discussed will show is that a huge portion of the variance (90%) is associated with the student and very little of it (10%) is associated with the school.
Nothing to be presented here is particularly new. The Chinese used student ability to select government administrators as early as 200 BC. Much of what will be discussed here was fully appreciated by Huarte (Reference Huarte1698) who valued the importance of students by the 16th century. Others who came later included Galton (Reference Galton1869), Binet and Simon (Reference Binet and Simon1905), and Spearman (Reference Spearman1904) to name a few. Given that what is argued here is so well known, it is not unreasonable to ask why it has been ignored for so long.
The main reason people seem to ignore the research is that they concentrate on the things they think they can change easily and ignore the things they think are unchangeable. Characteristics associated with schools seem easy to change while those associated with students seem much less amenable to modification. But the fallacy in this thinking is that if only a small portion of variance is associated with schools and a large amount with students, then changes in schools, no matter how effective, will only produce small effects.
Indeed, proponents of the importance of instruction have taken their view so far as to suggest that anyone can learn anything with sufficient deliberate practice (Detterman, Reference Detterman2014). Teachers are also taught that they are critical to the learning process. Johnson (Reference Johnson2016) describes it as follows: “What do you suppose is the most significant variable in determining how much learning goes on in a school or classroom? What do you think has the greatest effect on the quality of education students receive? It is the teacher.” Interestingly, this statement is true only if the student’s contribution is ignored.
Yet another reason that differences among students are ignored is that there is a strong tradition of equality in Western Europe and the United States. What is usually meant is equality before the law but many interpret equality as meaning that all people are equal. If there is anything that the last 100 years of social science research has taught us, it is that every person is a one-of-a-kind combination of genes and experience. Each person is unique and not equal to any other in the mathematical sense.
Perhaps the best argument for why we have ignored what is most important for understanding educational achievement is that education has not changed for as long as there has been formal education. Historically, the greatest educational innovations have been the printed book and the blackboard. This is a sad commentary on education but entirely true. If Plato or Aristotle walked into any classroom in any school, college, or university they would know exactly what was going on and could probably take over teaching the class (assuming they had a translator). They would certainly be amazed by the extent of what has been learned since their deaths but not at how it is taught.
The most troubling part of education’s ignoring of the students’ massive role in their own educational achievement is that there is a very large body of research that is unambiguous about the role of the student at every level of education. The highlights of that research will now be considered.
Teachers’ contributions to academic achievement
The Coleman report
In the United States Civil Rights Act of 1964, Section 402, Congress mandated that a study of American schools should be undertaken. Educational segregation that took place in the South and parts of the North under the Supreme Court upheld doctrine of “separate but equal.” Many thought this to be unfair. Black and white children were educated separately but many argued there was nothing equal about the quality of education each group received. Such segregation not only took place in the South but in many large cities in the North due to segregated housing patterns.
James Coleman, a noted educational sociologist, was the lead investigator of the study which came to be known as the Coleman report. Many other prominent researchers also participated. Researchers obtained data for grades 1, 3, 6, 9, and 12 from 4,000 public schools and more than 645,000 students. The data collected included surveys of schools and students, ability tests, and achievement tests. The survey data were extensive with separate surveys for school principals, teachers, and students.
The results from this extensive effort were a surprise to the researchers and to those who commissioned the study. For example, it found that the most segregated racial group was whites. It also found that very little variance in educational achievement was due to schools, from 10% to 20% and that most was due to student characteristics accounting for from 80% to 90% of total variance. The proportion of variance attributable to schools decreased in later grades. Further, teacher quality accounted for about 1% of the total variance in educational achievement.
The way the investigators framed their conclusion was that most of the variation in academic achievement was within schools and very little between schools. In other words, most of the variation was between students in schools and had little to do with the differences between schools.
These results (Coleman et al., Reference Coleman, Campbell, Hobson, Partland, Mood, Weinfeld and York1966) were publicly released on July 4, 1966, a day when the United States celebrates its declaration of independence. One can only assume that this was done to minimize publicity since the results were so counter-intuitive and not at all what was expected to be found. What had been expected was that the results would show that differences in academic achievement would be largely due to school quality but they were not.
Over the last 50 years, many reviews of the findings of the Coleman report have supported the major conclusions. Perhaps one of the most extensive was by Jencks et al. (Reference Jencks, Smith, Ackland, Bane, Cohen, Gintis and Michelson1972). They not only examined the data presented in the Coleman report but other related data as well. Their conclusions was that the largest portion of variance was due to students and not schools. Note that all of these investigators have implicitly indicated that the effects of teachers on educational achievement cannot be larger than the variance associated with schools and so must be less than 10%.
Gamoran and Long (Reference Gamoran and Long2006) reviewed the 40 years of research following the Coleman report but also included data from developing countries. They found that for countries with an average per capita income above $16,000 the general findings of the Coleman report held up well. Schools accounted for a small portion of the variance. But for countries with lower per capita incomes the proportion of variance accounted for by schools is larger. Heyneman and Loxley (Reference Heyneman and Loxley1983) had earlier found that the proportion of variance accounted for by poorer countries was related to the countries per capita income. This became known as the Heyneman-Loxley effect. A recent study by Baker, Goesling, and LeTendre (Reference Baker, Goesling and LeTendre2002) suggests that the increased availability of schooling in poorer countries has decreased the Heyneman-Loxley effect so that these countries are showing school effects consistent with or smaller than those in the Coleman report.
It is probably not surprising that in poor countries where school is inconsistently attended and with various options for obtaining schooling (free public, paid private, etc.) that there would be greater variance associated with schools. However, the range of school effects is generally from 10% to 40% so the variance associated with students always accounts for the majority of variance even in the poorest schools.
The Warsaw experiment
How small can the variance attributable to schools be? This question is partially answered by an amazing natural experiment. During World War II, the city of Warsaw, Poland was completely destroyed. After the war, Warsaw came under the control of a communist government which decided it would assign residents to the reconstructed city randomly to avoid social segregation. The city government felt that this would eliminate differences in cognitive development due to social segregation. Firkowska et al. (Reference Firkowska, Ostrowska, Sokolowska, Stein, Susser and Wald1978) studied the effects of this social experiment. Though the distribution of people in the city was not completely random it was very close to that. They obtained Raven’s Matrices tests for a large portion of the students born in 1963 for much of the city. In addition, they also collected parents’ education and occupation which was used to form a 13-point index of social class. The expectation, of course, was that the correlation between IQ and the social class index of the child’s home would be 0.0.
Instead, r 2 = 0.97, almost perfect. More interesting, the differences between schools was reduced from 10% to 2.1%. In other words, student variance accounted for nearly 98% of the outcome. Since Raven’s scores are generally predictive of academic achievement, it can be assumed that a similar finding would apply to academic achievement tests. But what it certainly shows is that a large part of even school effects can be accounted for by the non-random distribution of students across school districts. It is rather counter-intuitive that a more equitable and equal geographic distribution of people across school districts would make differences between students even more apparent.
Colleges and universities
Angoff and Johnson (Reference Angoff and Johnson1990) studied the proportion of variance that could be attributed to college and university attendance. They obtained a sample of students who had taken the SAT and then four to five years later had taken the GRE. They noted that the mathematics section of both tests was the most related to instruction so used the mathematics portions of each test to allow for maximum effects between schools. From a larger sample, they selected a sample of colleges that each had at least 10 students represented producing a sample of 7,954 students from 292 institutions. Each institution contributed an average of 27 students.
They regressed mathematics SAT, major, and gender onto GRE mathematics scores. They were able to predict 93% of the variance in GRE mathematics from these student characteristics. That meant that at most 7% of the variance in achievement could be attributed to institution attended. Therefore, differences in institutional teaching quality could account for no more than 7% of the variance. What is even more fascinating is that this study indicates it does not really matter what college a student attends. What is important is the student’s ability.
This conclusion seems counterintuitive. If it does not matter what college a student attends, why are students so eager to get into the “best” colleges? One suggestion might be that it is for the better salary graduates of those institutions are paid. But according to Dale and Krueger (Reference Dale and Kruger2011) that is not true (except perhaps for minority students and those who come from less-educated families). They compared several large samples in which they were able to obtain either self-reported salary or Social Security Administration Detailed Earning Records. It was true that students who attended more selective colleges (defined in several ways), earned more than those who did not. However, when the average SAT of the school was corrected for, these significant differences disappeared except for minorities and those from less educated families.
An interesting finding was related to the fact that 35% of students did not attend the most selective school they were admitted to and the fate of these students was examined. Dale and Kruger conclude:
Nonetheless, our results do imply that estimates that do not adjust for unobserved student characteristics are biased upward. Indeed the finding that the average SAT score of the highest ranked school that rejected a student is a much stronger predictor of the student’s subsequent earnings than the average SAT score of the school the student actually attended should give pause to those who interpret conventional regression-based estimates of the effect of college characteristics as causal effects of the colleges themselves. (p. 25)
It is very likely that if Dale and Krueger had individual SAT scores for each student instead of using school means their result would have been even more compelling. However, the results they did obtain are sufficient to conclude that it really does not matter what college a student attends. What matters most is a student’s personal characteristics and particularly his cognitive ability level.
One explanation for the finding that it does pay for minority students and students from less educated families to attend a better college is that they do not have the same social connections as other students. Attending a better college allows them to develop a network of useful social connections. This explanation is supported by other research (Bowen & Bok, Reference Bowen and Bok1998).
Twin study
Another study that estimated the amount of variance associated with differences in teachers examined twins. There are differences in the philosophy of parents or schools about how twins should be treated. Some place both twins in the same classroom while others feel that they should be in different classes. Byrne et al. (Reference Byrne, Coventry, Olson, Wadsworth, Samuelsson, Petrill and Corley2010) used literacy achievement to determine the differences between twins who were in the same or different classrooms. Twins in the same classroom had scores that were more highly correlated than twins in different classrooms. Based on this difference in correlations between same and different classrooms, the authors were able to estimate that no more than 8% of achievement variance could be attributed to having different teachers.
So far the studies presented have examined variance associated with schools. This has ranged from 2% to 10% of total variance. These estimates set an upper limit on the proportion of variance for which teachers can account. What is most interesting about these estimates is that they are consistent not only in primary and secondary schools but even across colleges and universities. The only study that computed more detailed estimates of variance was the Coleman report where the proportion of variance accounted for by teachers was about 1%. Estimates of the amount of variance accounted for by teachers are very difficult to find. I have been unable to find any study similar to thought experiment outlined earlier where teachers were randomly assigned to classes. Because each state is now required to give achievement tests yearly, data are now available that would allow a more precise calculation of the distribution of variances.
Direct estimates of teacher effects
Chingos and Whitehurst (Reference Chingos, Whitehurst and Lindquist2014) analyzed academic achievement data for the states of Florida and North Carolina for grades 3 through grade 8 for Florida and through grade 10 for North Carolina for 2000–01 through 2009–10 school years. Each year has roughly 2.3 million data points or 23 million data points for the decade. Control variables included: gender; race/ethnicity; cognitive and physical disability status; intellectually gifted status; free and reduced lunch program status; and limited English proficiency status. The explicit purpose of the analysis was to determine the contribution of school superintendents to academic achievement.
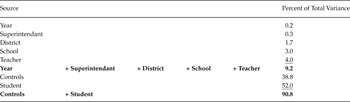
Table 1 shows an analysis of the data for North Carolina. Superintendents contribute only 0.3% to student academic achievement. Teachers are associated with 3.0% of student academic achievement. In total, all factors associated with schools account for 9.2% of student academic achievement. Those not associated with the school account for 90.8% of the variance. Note that the “control” factors also define student characteristics and could be as easily combined with student factors.
Distribution of Variance Predicting Student Achievement in North Carolina for 2000–01 and 2009–10. Data from Chingos and Whitehurst (September, 2014), Figure 4

Just looking within the context of the school, teachers account for about a third of the variance in academic achievement attributable to the school and they have 10 times more influence on academic achievement than the superintendent. It is true that teachers may have the greatest influence on academic achievement of any component in the school if students are ignored. It should also be noted that this may be a low estimate of teachers’ influence. In another paper by Whitehurst, Chingos, and Gallaher (Reference Whitehurst, Chingos and Gallaher2013) based on both the Florida and North Carolina data, total variance associated with schools was 9.6% but teachers accounted for 6.7%. In this case, teachers account for 70% of the total school variance in academic achievement.
If the concentration is on the school, then it is not surprising that the focus of researchers and reformers have been on teachers who are probably the major contributors to academic achievement within schools. In the literature surveyed, schools clearly account for about 10% of total variance in academic achievement and teachers within schools account for from 1% to 8% of total academic achievement or from 10% to 80% of what schools contribute to academic achievement. Though teachers have very powerful effects on academic achievement when only school effects are considered, they have very weak effects when all sources affecting academic achievement are considered. It seems inappropriate to blame teachers for all of the problems of an educational system or perhaps even a social system.
There are other difficulties with laying blame on teachers. Teacher training is generally ineffective and expensive averaging $18,000 per year (The New Teacher Project, 2015). Most teachers reach their maximum level of effectiveness after five years and then plateau. Effects of good teaching appear to have low persistence with three-quarters or more fading within one year (Jacob, Lefgren, & Sims, Reference Jacob, Lefgren and Sims2010). The Institute of Education within the U.S. Department of Education commissioned a number of randomized controlled trials mostly testing educational interventions. Of the 77 trials that were deemed to have no major study limitations only 7 (9%) showed positive effects with the rest showing weak or no effects (Coalition for Evidence-Based Policy, 2013). Teaching in the United States has attracted among the least able students based on average admission scores of teacher colleges. All of these things, multiplied by the small amount of total variance in educational achievement they currently produce, suggest that it will be unlikely that teachers will revolutionize education in the near future.
The point here is that a close look at Table 1 will quickly reveal to any sensible person what has to happen if education is ever to change. We should be investing major effort into understanding the 90% of the variance associated with students. There have been few serious attempts to deeply understand the 90% of the variance that connects student achievement to student characteristics in the educational community. Until that happens there will be few changes in education and the way it is carried out.
The student’s contribution to academic achievement
What student characteristics are associated with academic achievement? Over the last 30 years, the relationship between academic achievement and student characteristics has come into focus and though it is not understood exactly why the two are related, the topography of the relationship is clear. One finding is particularly powerful. Human intelligence or general cognitive ability accounts for at least half and probably more of academic achievement attributable to student characteristics. There are certainly other student characteristics that contribute to academic achievement but these have not been as thoroughly researched as intelligence. Consider just some of the evidence for intelligence.
General intelligence and general academic achievement in English adolescents
Deary, Strand, Smith, and Fernandes (Reference Deary, Strand, Smith and Fernandes2007) studied more than 70,000 English students. All students in England are required to take an examination for the General Certification of Secondary Education (GCSE). The GCSE is an academic achievement test that offers individual tests in a wide range of subjects and each test is expressed on a common scale as a point score. The Cognitive Abilities Test (CAT) is a test of reasoning abilities (AKA general intelligence) and is given widely to students in England. The investigators were able to match a large portion of 15/16 year olds who had taken the GCSE with the score they obtained on the CAT at age 11 years. Since students took different subjects in their secondary education, it was necessary to select students who had taken the same GCSE tests. The largest sample identified whose members had taken the same courses included 13,248 students which was replicated on the next largest sample of 12,519 with only “trivial” differences in outcome despite the fact that they had taken different courses.
For each sample, an educational achievement general factor was extracted from the tests from the GCSE. Similarly, a general factor of intelligence was extracted from the CAT subtests. The correlation between the academic achievement general factor and the intelligence general factor was 0.81. In other words, intelligence predicts at least two-thirds of the general factor of academic achievement when the two tests are given 5 years apart. General intelligence also predicted individual scores in the 27 subject test scores with an effect size (η2) of from 58.6% for Mathematics to a low of 18.1% for Art and Design. Not only does intelligence predict overall academic achievement but it more or less predicts achievement in specific courses five years later.
Similar results were found by Kaufman, Reynolds, Liu, Kaufman, and McGrew (Reference Kaufman, Reynolds, Liu, Kaufman and McGrew2012) who employed the Kaufman intelligence and achievement tests (n = 2520) and Woodcock-Johnson intelligence and achievement tests (n = 4969). For each battery of intelligence and achievement tests, a general, second order hierarchical factor was obtained from detailed latent trait models by age. The obtained general factors for cognitive ability and academic achievement were then correlated. The mean correlation between cognitive g and educational achievement g was 0.83, very similar to what Deary et al. (Reference Deary, Strand, Smith and Fernandes2007) found. The correlation varied somewhat, increasing by age with a range of 0.77 to 0.94. The correlations were also tested to see if they were different from 1.0 and they were, indicating that the intelligence latent variable does not perfectly predict the academic achievement latent variable.
Supplementing findings at the individual level, Lynn and Mikk (Reference Lynn and Mikk2007) found that TIMSS scores and mean country IQ are correlated between 0.92 and 1.00 after correction for attenuation and between 0.85 and 0.93 before correction. They used the 2003 TIMSS testing for grades 4 and 8 on tests of math and science. These correlations, of course, are not equivalent to individual correlations because they are based on group means and so should be expected to be higher. They do, however, indicate that intelligence is important at the national level in determining educational achievement. Lynn and Mikk’s primary purpose in conducting this study was to validate the estimates of country IQs that had been developed from testing or estimation procedures. So, in a sense, the authors took the relationship between education and intelligence as a well-established fact.
What is clear from these and many other studies not cited here is that intelligence is extremely important in educational achievement. Intelligence accounts for somewhere between half and two-thirds of the total variance in academic achievement. If we consider only the 90% of variance attributable to students, then it accounts from 56% to 70% of variance in academic achievement attributable to student characteristics. This compares to the maximum 8% of total variance accounted for by teachers. Intelligence accounts for 6 to 9 times more variance than teachers yet the focus of attention is on studying teachers and not intelligence. Unfortunately, intelligence is seldom mentioned in educational circles. While education seems to have ignored student characteristics, others have been busy investigating them and we now know a substantial amount about them. Major contributors to these advances have been cognitive research, behavior genetics, and neuroscience. Each of these will now be briefly reviewed. Before doing that, one major questions is the causal relationship between intelligence and academic achievement.
The direction of effect
One still open question is the extent to which intelligence or other variables “cause” education or education “causes” intelligence, or both. One method for answering this question is to employ what are known as cross-lagged correlations. In this method, participants are given both an intelligence test and achievement test at time 1 and then some time later are given the same tests at time 2. Because effects can only act forward in time, it is possible to conclude how the variables measured at time 1 affect performance at time 2. For example, if the intelligence test measured at time 1 correlates significantly with academic achievement at time 2 but the achievement test given at time 1 does not correlate with the intelligence test given at time 2, then it would be concluded that intelligence affects academic achievement, but that academic achievement has no significant effect on intelligence.
Two studies have employed this methodology (Crano, Kenny, & Campbell, Reference Crano, Kenny and Campbell1972; Watkins, Lei, & Carnivez, Reference Watkins, Lei and Canivez2007) and both have found that intelligence has forward effects on achievement but achievement does not significantly act forward to affect intelligence. The study by Crano et al. (Reference Crano, Kenny and Campbell1972) used a large sample of 4000 students who had taken both achievement and intelligence tests in the fourth and sixth grade. The study by Watkins et al. (Reference Watkins, Lei and Canivez2007) used a smaller sample (n = 289) tested an average of 2.8 years apart on the WISC-III and a combination of achievement tests. They were able to form latent variables for achievement and general intelligence. Both of these suggest that general intelligence is unaffected by academic achievement.
This conclusion is supported by Mosing, Madison, Pederson, Kuja-Halkola, and Ullen (Reference Mosing, Madison, Pedersen, Kuja-Halkola and Ullén2014) who studied the relationship between music practice and music ability in 10,500 Swedish twins. Music ability was assessed for rhythm, melody, and pitch discrimination. Practice was found to be substantially heritable (40% – 70%). But most important was that:
Further, contrary to predictions of the second hypothesis (i.e., in MZ twins, the twin who practices more will have greater ability), results from intrapair-difference modeling showed that once all genetic and shared environmental factors were controlled for, the association between music practice and ability disappeared—in other words, the twin who trained more did not possess better music abilities. This was despite the fact that some intrapair differences between twins were as great as 20,228 hr —a practice amount considerably higher than that reported for many highly skilled experts, including musicians. (p. 1800)
This suggests that abilities are not easily altered, at least for music.
The issue of direction of effect is an important one and there may be better ways of assessing it. For example, in populations where men receive substantially more education than women it would be interesting to know what measured intelligence was for both men and women. If achievement has no effect on intelligence, then one would expect that men and women would have very similar scores on general intelligence tests but would be significantly different on tests of academic achievement. Ceci (Reference Ceci1991) has detailed a number of situations where negative environments can reduce general intelligence. While we do know that deprivation can reduce intelligence, it is much more difficult to find situations where positive effects increase intelligence. But we have known for some time that there have been gains in tested intelligence (Flynn, Reference Flynn1984; Tuddenham, Reference Tuddenham1948). The general opinion seems to be that fluid intelligence is not changing but that test takers are becoming more sophisticated perhaps because cultures are making it easier to learn important information and mental organizations that were not previously as easily available and are important for taking intelligence tests.
Genetic contributions to achievement
It is well known that intelligence and academic achievement are both heritable. In fact, academic achievement appears more heritable than intelligence. This has been pointed out repeatedly. Thompson, Detterman, and Plomin (Reference Thompson, Detterman and Plomin1991) analyzed data from the Western Reserve Twin study and found that academic achievement was well predicted by intelligence and that the two latent traits were substantially correlated. But when there was a discrepancy between the academic achievement predicted by IQ and actual academic achievement, it was due to non-shared environment. Petrill and Wilkerson (Reference Petrill and Wilkerson2000) reviewed studies of intelligence and academic achievement. They point out that both environment and genetics are important to academic achievement with environment being more important to younger children than older ones but with genes becoming increasingly important as children move into adulthood. Luo, Thompson, and Detterman (Reference Luo, Thompson and Detterman2003) used the Western Reserve Twin study to explore the causes of academic achievement using a battery of cognitive tests in addition to an intelligence test. They concluded that “individual differences in mental speed are a main causal factor underlying the observed correlation between general intelligence and scholastic performance in children between age 6 and 13.”
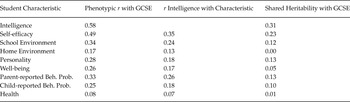
One of the most extensive investigations of student characteristics was carried out by Krapohl et al. (Reference Krapohl, Rimfield, Shakeshaft, Trzaskowski, McMillan, Pingault and Plomin2014). They examined the relationship of a number of student characteristics to the GCSE in a sample of over 13000 twins who took the test when they were approximately 16 years old. The student characteristics they examined are shown in the first column of Table 2. The second column of Table 2 shows the correlation of GCSE with general intelligence and the third column shows the correlation of each student characteristic with intelligence.
Correlations of Student Characteristics with GCSE scores from Krapohl et al. Table S4 (Phenotypic r and correlation of intelligence with student characteristics) and Table S6 (Shared heritability of GCSE)

Beh. Prob. = Behavior Problems
The point here is that intelligence shows the highest correlation with GCSE and that other student characteristics show lower correlations with GCSE and frequently a substantial correlation with intelligence (shown in the third column). Finally, the fourth column shows the shared heritability of each characteristic with GCSE. These are very low for some of the student characteristics. In terms of phenotypic variance, intelligence accounts for about 34% of the predicted variance in GCSE while the other eight predictors account for about 28% of the variance. When intelligence and the eight other student characteristics are combined to predict GCSE performance, the combination is able to predict 45% of the phenotypic variance. That is only an 11% gain over the 34% intelligence predicts alone. The reason the gain is not larger is because many of the eight characteristics share variance with intelligence. The picture is much the same for genetic variance. In other words, intelligence alone accounts for a substantial portion of the phenotypic and genetic variance but other characteristics do contribute to a lesser extent. All student characteristics including intelligence are able to account for 75% of the heritability GCSE scores, a truly exceptional result.
We also know other things about the genetics of intelligence and academic achievement (Plomin, DeFries, Knopik, & Neiderhiser, Reference Plomin, DeFries, Knopik and Neidherhiser2016). Individual genetic effects are small and numerous. These genetic effects are smaller in younger children and steadily increase adolescence becoming substantial in adulthood (Haworth et al., Reference Haworth, Wright, Luciano, Martin, de Geus, van Beijsterveldt and Plomin2010). The effects are pleiotropic meaning the same genes can be found acting across numerous phenotypic characteristics such as intelligence and academic achievement (e.g., Plomin & Kovas, Reference Plomin and Kovas2005). As sample sizes get larger and larger, the single nucleotide polymorphisms (SNPs) identified are increasing and accounting for significantly larger portions of variance. It will be possible, one day soon, to use genetic information to accurately predict individual IQs. It is also known that the same genes that are responsible for the normal distribution of characteristics like intelligence are the same ones responsible for disorders of the same phenotypic trait and perhaps other traits as well. It is very likely that there are no exclusive “intelligence” genes only genes that affect intelligence.
Much of what has been discussed has little current practical application for intelligence. There is one finding that does. The importance of Gene X Environment interactions are becoming increasingly appreciated for the role they play in academic achievement. What appears to be important for optimal development is that individuals find environments that are well matched to their genetic inheritance. This is as true for people as it is for food crops and livestock, or for that matter, all plants and animals. Asbury and Plomin (Reference Asbury and Plomin2013) have written a book for educators that offers the very practical advice of matching people’s environments to their abilities.
The brain
What has been learned about the brain and intelligence is as significant as what has been learned about genetics and intelligence. The technology to map and understand the brain has taken amazing leaps forward. The new technologies have provided the data necessary to develop new theories. Parietal-Frontal Integration Theory or P-FIT (Jung & Haier, Reference Jung and Haier2007) and its extensions (Basten, Hilger, & Fiebach, Reference Basten, Hilger and Feibach2015) have provided a map of what parts of the brain seem most important for intelligence. The model also meshes well with cognitive theories of how intelligence works. For example, specific parts of the brain have been associated with general intelligence (Colom, Jung, & Haier, Reference Colom, Jung and Haier2006).
There is also a growing body of research on how the brain develops for persons of various intellectual levels (Giedd et al., Reference Giedd, Blumenthal, Jeffries, Castellanos, Hong, Zijdenbos and Rapoport1999). The course of development is very likely genetically controlled and there have been attempts to measure the heritability of parts of the brain.
Cognition
Knowledge of cognition and intelligence has increased significantly over the last few decades. There have been substantial gains in measurement. It has now been shown that intelligence is extremely stable from childhood to old age (Deary, Whalley, Lemmon, Crawford, & Starr, Reference Deary, Whalley, Lemmon, Crawford and Starr2000). For the first time, there is a structural model of human intelligence that has been statistically compared to other models (Johnson & Bouchard, Reference Johnson and Bouchard2005a,Reference Johnson and Bouchardb) and not constructed based on a best guess. It is also known that the general ability factor derived from different batteries of tests is nearly identical if the batteries contain a representative sample of the universe of tests (Johnson, Bouchard, Krueger, McGue, & Gottesman, Reference Johnson, Bouchard, Krueger, McGue and Gottesman2004; Johnson, te Nijenhuis, & Bouchard, Reference Johnson, te Nijenhuis and Bouchard2008). This is important structural information about cognitive abilities.
A great deal has been learned about more specific cognitive abilities. For example, it is known that working memory is a critical process in reasoning ability (Kyllonen & Christal, Reference Kyllonen and Christal1990). It is also known that the components of executive functioning which are inhibition, switching, working memory, and updating are highly heritable (Engelhardt, Briley, Mann, Harden, & Tucker-Drob, Reference Engelhardt, Briley, Mann, Harden and Tucker-Drob2015).
Putting it all together
In the first part of this paper, I presented evidence that schools and teachers account for less than 10% of the total variance in academic achievement and that student characteristics account for 90%. This observation has been supported by many studies and reviews and has been known at least since the 1960s. In fact, in the few studies that estimate the variance in academic achievement attributable to teachers not confounded with schools it is probably only 1% to 8%. It should also be noted that though this is a small amount of the total variance, teacher effects on school achievement are probably the largest component of with-in school factors when student characteristics are ignored.
I have not argued that because the amount of variance in academic achievement teachers’ account for is small, they should be ignored. Quite the contrary. Teachers should be appreciated for the difficult task they face. But no matter how good they are, they will not be able to revolutionize education or make geniuses out of every child. They do not have control over the variables that are responsible for most of the variance in educational outcome. It will do no good to lay the entire burden of reforming education on teachers as some educators have done.
What should be done? In the latter part of this paper, I briefly summarized the significant advances that have been made in understanding intelligence in genetics, neuroscience, and cognition. I also argued that intelligence is the student characteristic that appears to account for more variance than any other variable now known. It seems obvious to me that we would have a better understanding of academic achievement if we had a better understanding of intelligence. Without understanding the infrastructure of intelligence, it will be impossible to change educational practices in any significant degree as many centuries have testified.
What will it take to understand the infrastructure of intelligence? The answer to this is simple: Genes affect the brain and the brain controls behavior. The relationship between genes, brain, and behavior must be understood. I not only think it is possible to do this but very likely that it will be done in the not too distant future. The more researchers addressing this issue the sooner it will get done. I believe this is critical to the future since the problems we face will require optimizing human intelligence if they are to be solved.
Once we understand the complete infrastructure of intelligence, we will have a good start on understanding what can and cannot be done to improve education. Without fully understanding intelligence, there will continue to be more ineffective and ill-conceived attempts to “reform” education and more blaming teachers for what is not their fault.