Introduction
During the past 30 years, a number of physiological, statistical, and behavioral tools have emerged that allow neuroscientists to establish compelling links between the behavior of single neurons and perceptual experience. The development of these tools has given us great insight into the neural mechanisms of decision making. Pioneering work by Newsome et al. (Reference Newsome, Britten and Movshon1989) revealed remarkable similarities between neural responses to moving stimuli of a population of MT neurons while monkeys reported the direction of these stimuli, leading to the conclusion that activity of these neurons may contribute to perceptual decisions. This conclusion subsequently received strong support from a series of microstimulation studies showing that direct electrical activation of small groups of neurons selective for a given stimulus dimension can alter the reports make about those stimuli, suggesting that they influence the perceptual decisions monkeys make (Salzman et al., Reference Salzman, Britten and Newsome1990; Bisley et al., Reference Bisley, Zaksas and Pasternak2001; Nichols & Newsome, Reference Nichols and Newsome2002; Cohen & Newsome, Reference Cohen and Newsome2004; DeAngelis & Newsome, Reference DeAngelis and Newsome2004; Afraz et al., Reference Afraz, Kiani and Esteky2006; Shiozaki et al., Reference Shiozaki, Tanabe, Doi and Fujita2012).
A measure termed choice probability (CP) has been subsequently introduced (Britten et al., Reference Britten, Newsome, Shadlen, Celebrini and Movshon1996). This term refers to specific mathematical approach that allows an examination of the relationship between neuronal activity and perceptual decisions. This measure, based on signal detection theory (Green & Swets, Reference Green and Swets1966), allows scientists to relate the activity of individual neurons to perceptual decisions on a trial-by-trial basis and has since been used by many sensory neurophysiologists searching for a direct link between neural representation and perception (e.g., Dodd et al., Reference Dodd, Krug, Cumming and Parker2001; Parker et al., Reference Parker, Krug and Cumming2002; Uka & DeAngelis, Reference Uka and DeAngelis2004; Liu & Newsome, Reference Liu and Newsome2006; Palmer et al., Reference Palmer, Cheng and Seidemann2007). Many of these studies recorded from visual neurons specialized for processing of fundamental dimensions of visual stimuli in monkeys trained to report the identity of such stimuli. The results revealed weak but statistically significant links between activity of neurons processing relevant sensory dimension and the behavioral report, suggesting that perceptual decisions made by the monkeys were likely to rely on the activity of neurons processing stimulus dimension relevant to the behavioral task.
These studies and the techniques they introduced have been enormously influential in several respects. First, they have led to a consensus view—controversial at first—that decision making is a problem that is tractable by neuroscientific methods. Second, they have paved the way for a host of studies examining the mechanisms behind other types of basic perceptual decisions, including somatosensory, auditory, and olfactory decisions (Romo & Salinas, Reference Romo and Salinas2003; Uchida et al., Reference Uchida, Kepecs and Mainen2006; Cohen & Maunsell, Reference Cohen and Maunsell2009; Cohen & Newsome, Reference Cohen and Newsome2009). Third, they have helped us develop a more sophisticated understanding of the functions of many brain regions that lie between the sensory inputs and motor outputs. Finally, these studies have served as the foundation for studies of more complex types of decision making.
This paper focuses on two types of complex decision-making problems that go beyond the basic perceptual classification. We will focus, in turn, on memory-guided sensory-based decisions and reward-based decisions. Both types involve classification processes, but involve additional psychological factors—memory and reward processing, respectively. We will make extensive use of our own research in illustrating the problems that are encountered and approaches that can be taken to overcome them.
Sensory-based decisions
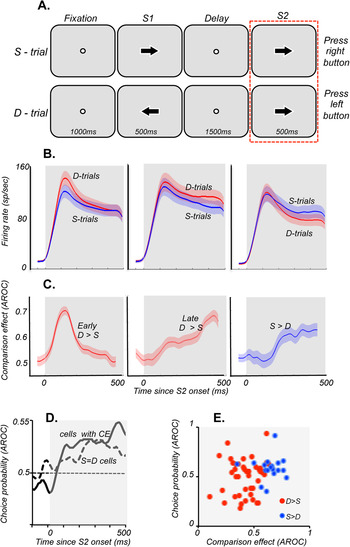
Here, we describe a series of studies aimed at identifying the neural basis of a more complex visual discrimination task requiring subjects to compare two sequentially presented moving stimuli, S1 and S2, and report whether their motion directions are the same or different. In contrast to the more commonly used tasks requiring identification of a single stimulus, in this task, often faced by active observers, the decision can only be made after the presentation of the second stimulus and is based on the comparison of that stimulus with the stimulus that is no longer present (Fig. 1A). Thus, the neural code underlying the perceptual report required by this task must include the information about the current and the previous stimulus. In other words, in addition to perceptual discrimination, this task requires active use of working memory. This factor means that subjects must compare an active representation to a stored one.
MT activity at the time of decision during comparisons of motion directions. (A) The diagrams outline the temporal sequences of the events during the task. The monkeys fixated a spot for 1000 ms before being presented with two stimuli, S1 and S2, lasting 500 ms each and separated by a 1500-ms delay. S1 and S2 moved either in the same (S-trials) or in opposite (D-trials) directions. They pressed one of two pushbuttons to report whether S1 and S2 moved in the same or in different directions. The rectangle around the S2 component highlights the portion of the trial analyzed here. During the task, stimuli consisted of random dots displaced in directions chosen from a predetermined distribution. The width of this distribution determined the range of directions within which individual dots move and was varied between 0° (all dots moving in the same direction) and 360° (dots moving in random directions). The data in (B and C) are based on trials with coherent motion (0° range), whereas the data in (D) are based on trials with S1 consisting of random motion (360° range). Both stimuli were placed in the neuron’s receptive field and during S2 moved in the preferred direction for that neuron. (B) Average responses during S-trials (blue curves) and D-trials (red curves). Three distinct groups of cells showed differences in their responses to identical stimuli moving in the neuron’s preferred direction: cells with stronger activity on D-trials early in the response (left plot; early D > S cells, n = 34), cells with stronger activity on D trials late in the response (middle plot, late D > S cells, n = 27), and cells with stronger activity on S-trials (right plot, S > D cells, n = 32). (C) Differences between the two response curves shown in (B) (i.e., CEs), computed with ROC analysis shown separately for each group of cells. (D) CP computed separately for neurons with CEs (CP = 0.53 ± 0.02; P = 0.145, n = 62) and neurons with no CEs (CP = 0.53 ± 0.01, P = 0.012; n = 67). Note that the overall CP for cells with CE failed to reach significance, whereas neurons with no CEs (S = D) showed significant choice-related activity, indicative of higher activity prior to same report. However, when CP was computed separately for each cell group, one cell group showed consistently significant CP (S > D, CP = 0.58, P = 0.03; see Lui & Pasternak, Reference Lui and Pasternak2011). (E) Correlation between CE and CP computed for individual cells was weak, failing to reach statistical significance (r = 0.24, P = 0.06).

To identify the neural mechanisms that allow the animal to make decisions based on stored representations of stimuli, we focused on the activity associated with the comparison phase of the task, the period during and following the presentation of S2. We examined this activity in two cortical regions likely to provide information relevant to the motion comparison task: area MT, which has a well-documented role in processing of visual motion, and dorsolateral prefrontal cortex (DLPFC; areas 8, 9, 46), which has a documented role in representing behaviorally relevant motion (Zaksas & Pasternak, Reference Zaksas and Pasternak2006; Hussar & Pasternak, Reference Hussar and Pasternak2009) and strongly implicated in sensory maintenance and executive control (Miller & Cohen, Reference Miller and Cohen2001). Our results, briefly described below, provide a convincing link between neuronal activity recorded in both areas and the choices made by the animals.
Choice-related activity in MT during direction comparison task
In a recently published report, we provided a detailed account of choice-related activity in MT during the direction comparison task, shown in Fig. 1 (Lui & Pasternak, Reference Lui and Pasternak2011). In this task, the animals were trained to report whether two random-dot stimuli, S1 and S2, separated by a delay moved in the same direction (S-trials) or in different directions (D-trials) by pressing one of two response buttons. Both types of trials were equally likely to occur and were interleaved on a trial-by-trial basis. Task difficulty was manipulated by varying the coherence of the random-dot stimulus presented during S1 (for details see Zaksas & Pasternak, Reference Zaksas and Pasternak2006; Lui & Pasternak, Reference Lui and Pasternak2011). To determine whether MT neurons contribute to the comparison of directions required by the task, we examined responses to the preferred direction presented during the second stimulus, S2, on S-trials when it was preceded by the same direction and on D-trials when it was preceded by a different direction. We reasoned that the dependence of firing rate during the S2 on the sensory properties of the first stimulus would be indicative of MT having access to remembered information. We found that many MT neurons showed this pattern. In fact, this modulation was of two types, each represented by separate sets of neurons: those with stronger responses on same trials (S > D neurons) and those responding more on different trials (D > S neurons). Furthermore, we observed that D > S responses were of two types, each represented by a distinct group of neurons with different temporal profiles, one occurring shortly after S2 onset and the other occurring a few hundreds of milliseconds later (Fig. 1B and 1C). The presence of these effects, we termed comparison effects (CEs), shows that after the onset of S2, firing rates of many MT neurons depend on both the current and the remembered stimulus.
We examined whether this response modulation could provide the basis for the perceptual report made at the end of each trial by first computing CP, the approach that allowed us to determine whether activity preceding the report predicts specific choices made by the monkeys at the end of each trial. We limited this analysis to trials with S1 containing random motion and S2 moving coherently in the neuron’s preferred direction (see Lui & Pasternak, Reference Lui and Pasternak2011). Under these conditions, the performance was at chance, and the animals were equally likely to report trials as same or different (i.e., press right or left button). Because stimulus conditions were identical during the two types of trials, any difference in activity associated with each report could not have been driven by stimulus differences. With this approach, we compared the activity associated with each report and found significant but weak choice-related activity during S2, linking MT to decisions made by the monkeys at the end of each trial (Fig. 1D).
We then examined whether the robust CEs recorded during S2 were utilized in these perceptual reports. We found that whereas in some cells, these effects coexisted with choice-related activity, in other cells, they were absent despite the presence of significant CP, suggesting that the link between the CEs and choice-related activity is weak. Indeed, the correlation between CEs and CP examined on a cell-by-cell basis was relatively weak (Fig. 1E).
Despite the weak correlation of CEs with decision-related signals, the contribution of MT to the comparison stage of the direction discrimination task is supported by the results of our earlier lesion study (Bisley & Pasternak, Reference Bisley and Pasternak2000). In that study, we examined the effects of a unilateral MT lesion on motion discrimination by presenting S1 and S2 at separate locations represented by the intact (ipsilateral) and lesioned (contralateral) regions of MT. This allowed us to separately assess the contribution of MT to encoding/retention (S1 and delay) and comparison (S2) phases of the task. The deficit in the accuracy of direction discrimination was profound but only when the comparison stimulus was presented in the affected field. When the conditions were reversed and that stimulus appeared in the intact and the initial stimulus was placed in the lesioned field, the precision of direction was largely unaffected. This observation highlights the importance of MT for the comparison process, complementing the finding of comparison signals recorded in MT during S2 (Lui & Pasternak, Reference Lui and Pasternak2011). These results further strengthen the notion that this sensory region participates not only in processing of current motion stimuli but also in the circuitry underlying comparisons between current and remembered stimuli (Pasternak & Greenlee, Reference Pasternak and Greenlee2005).
On the other hand, these data also suggest that MT, with its weak choice-related activity and the absence of correlation with signals reflecting sensory comparisons, is unlikely to be sufficient to account for behavioral choices made by our monkeys. Thus, it is necessary to consider the contribution of neurons in other cortical regions, starting with DLPFC, the area strongly associated with sensory maintenance and decision making (Miller & Cohen, 2001).
Decision-related activity in the dorsolateral prefrontal cortex
To address the relationship between neural activity and perceptual choice during motion comparisons, we focused on DLPFC, the region directly and indirectly interconnected with MT (Barbas, Reference Barbas1988; Petrides & Pandya, Reference Petrides and Pandya2006; Ninomiya et al., Reference Ninomiya, Sawamura, Inoue and Takada2012) and with documented selectivity for visual motion used during motion comparison tasks (Zaksas & Pasternak, Reference Zaksas and Pasternak2006; Hussar & Pasternak, Reference Hussar and Pasternak2009). Recordings were carried out during a task that was similar to that used during MT recordings (Hussar & Pasternak, Reference Hussar and Pasternak2012). In the task used to probe DLPFC, the monkeys also compared two sequentially moving random dots that moved in the same or different directions. Whereas in the MT experiments, we controlled task difficulty by adjusting coherence, here we controlled it by adjusting the difference in direction between the two stimuli.
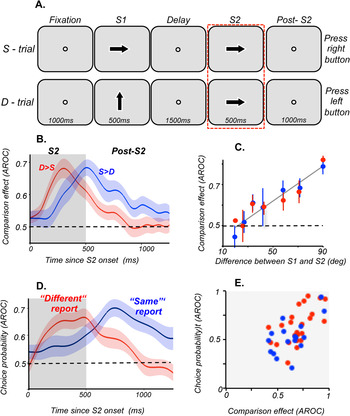
As in MT, we found that on trials with the largest differences between S1 and S2, responses were modulated by the preceding direction. As in MT, we observed this modulation in the form of stronger responses on same trials (S > D cells) or on different trials (D > S cells), in two separate groups of neurons. However, in contrast to MT, which showed two temporal profiles of D > S modulations, early and late, in the DLPFC, this type of modulation occurred later in the response, toward the end of S2 and was represented by a single group of cells (Fig. 2B). Furthermore, same–different modulations persisted after the offset of S2, with D > S CE emerging earlier. It is not clear whether the activity recorded after S2 offset was also characteristic of MT, since during MT recordings such data were not collected. Because during this task, we used both small and large differences between S1 and S2 directions, we were able to show that the magnitude of CEs decreased as the two directions became more similar (Fig. 2C). This relationship paralleled behaviorally measured accuracy of direction discrimination, and we found that CE was no longer present for pairs of directions that the monkeys were unable to discriminate reliably (Hussar & Pasternak, Reference Hussar and Pasternak2012). This relationship between CE and discrimination performance was further confirmed by finding lower incidence of CEs in the monkey with less accurate direction discrimination (see Fig. 7D and 7E in Hussar & Pasternak, Reference Hussar and Pasternak2012). It is noteworthy that we observed similar effects during an analogous task involving comparisons of stimulus speeds (Hussar & Pasternak, Reference Hussar and Pasternak2013). Taken together, these observations support the notion that response modulation during S2 represents the difference between directions of the two stimuli being compared during the task. While these signals appear to reflect the computation required by the task, it is not clear whether they are utilized in the decision process.
DLPFC activity at the time of decision during comparisons of motion directions. (A) Diagram of the direction comparison task showing the two types of trials, S-trials and D-trials (Hussar & Pasternak, Reference Hussar and Pasternak2012). On S-trials, S1 and S2 separated by 1500 ms delay moved in the same direction whereas on D-trials, S1 and S2 moved in different directions. The animals reported whether the two directions were the same or different by pressing one of two response buttons. They were allowed to respond 1000 ms after S2 offset. During each session, direction difference thresholds were measured by varying the difference between directions in S1 and S2. The rectangle around the S2 trial components highlights the portion of the trial relevant to the analysis described here. (B) CEs recorded during and after S2. Average CE for S > D cells (blue, n = 20) and D > S cells (red, n = 26) during S2 and post-S2. (C) Dependence of CE on the difference in direction between S1 and S2: D > S cells (red); S > D cells (blue). The correlation between CE and direction difference was highly significant (P < 7.5 × 10⁶). (D) CP of DLPFC neurons more active before different (n = 24) and before same (n = 17) reports. Shadings represent ±s.e.m. (E) Correlation between CE and CP computed for individual S > D and D > S cells, which showed both CE and CP. The two measures were strongly correlated during 200–400 ms (P = 1.3 × 10⁷) shown here, as well as later in the trial, 600–800 ms after S2 onset (not shown; P = 1.2 × 10⁴).

To determine whether the activity recorded during and after the comparison stimulus (S2) is predictive of choices made by the animals, we computed CP. This analysis, carried out on the subset of trials in which S1 and S2 moved in the same direction, revealed significant choice-related activity in firing rates that appeared shortly after the onset of S2 and persisted until the behavioral report. This activity was of two types: one associated with same report and the other with different report, paralleling the two types of CEs associated with the same and different direction trials. We found that a third of DLPFC neurons carried both the comparison and choice-related signals and that the CEs reliably preceded the choice-related activity, suggesting that at the time of decision, DLPFC neurons represent information about the difference between S1 and S2. Such pattern would be consistent with a possibility that the observed CEs are utilized in the decision process. Indeed, we found that the comparison and choice-related activity were strongly correlated. Specifically, neurons preferring S-trials also showed more activity prior to the same report and neurons preferring D-trials also showing greater activity prior to the different report. Although this correlation does not prove that the CE provides the basis for the perceptual report, its strength and the consistency in the sign of the two types of signals support this possibility.
Relative contributions of MT and DLPFC to decisions during motion comparisons
This brief summary of work examining the participation of neurons in two interconnected cortical areas, one specialized in processing of visual motion (area MT) and the other strongly linked to executive control and working memory (DLPFC), highlights an approach based on relating the activity of single neurons to choices made by the monkeys during a multistage motion discrimination task. In contrast to simpler tasks requiring subjects to identify aspects of the current stimulus (e.g., direction), in our task, the decision must be based on the comparison between two identified stimuli. This task cannot be solved without the information about the previous stimulus stored in working memory. Our results showed that the contribution of MT to the direction task is not limited to processing the current stimulus, since its neurons also represent the information about the remembered direction. Recordings in the DLPFC revealed that its contribution to motion comparisons is also not limited to a single component of the task. Rather, its neurons participate in all phases of the task, faithfully representing behaviorally relevant motion, showing stimulus-related and anticipatory activity during the delay, and representing the difference between the two comparison stimuli (Hussar & Pasternak, Reference Hussar and Pasternak2009, Reference Hussar and Pasternak2010, Reference Hussar and Pasternak2012, Reference Hussar and Pasternak2013). Thus, our data point to similarities in the way MT and DLPFC neurons represent behaviorally relevant visual motion and in the nature of their activity during the comparison phase of the task. Although the presence of direction selectivity in DLPFC can be attributed to the influences arriving from MT, the source of CEs in the two areas is more difficult to identify. The early D > S signal appears in MT soon after the onset of S2, before neurons in DLPFC display D > S modulation. On the other hand, the other two types of CEs in MT occur relatively late after S2 onset and are substantially weaker than those recorded in DLPFC. These similarities and differences in CEs between the two areas point to a scenario in which they both participate in the network underlying the comparison process, with MT providing initial signals originating the process and DLPFC supplying MT and presumably other components of that network with the information underlying the upcoming choice. Strong correlation between CEs and choice-related activity in DLPFC, but not in MT, point to prefrontal neurons as a likely source of signals that ultimately lead to perceptual reports.
In this paper, we focused exclusively on cortical activity recorded during comparisons of visual motion. However, such signals are not unique to visual motion, and analogous CEs have also been observed in prefrontal and visual processing neurons during tasks involving other stimulus dimensions (e.g., Miller et al., Reference Miller, Li and Desimone1993, Reference Miller, Erickson and Desimone1996; Freedman et al., Reference Freedman, Riesenhuber, Poggio and Miller2003; Cromer et al., Reference Cromer, Roy, Buschman and Miller2011; Hayden & Gallant, Reference Hayden and Gallant2013). For example, Freedman et al. (Reference Freedman, Riesenhuber, Poggio and Miller2003) used a match-to-category task to train monkeys to distinguish between categories of shapes and observed that responses in the PFC during the comparison stimulus (test) were modulated by the shape category that appeared during the sample. As in our study, some neurons responded more strongly during the match (same) trials and some during the nonmatch (different) trials. Parallel recordings in inferotemporal cortex revealed similar response modulation. Analogous CEs recorded during the same task were also observed in premotor cortex (Cromer et al., Reference Cromer, Roy, Buschman and Miller2011). Furthermore, signals reflecting choice-related activity have also been reported in a number of cortical areas during tasks involving tactile stimuli (Hernández et al., Reference Hernández, Nácher, Luna, Zainos, Lemus, Alvarez, Vázquez, Camarillo and Romo2010).
Reward-based decisions
In perceptual decisions, subjects must judge the properties of potentially ambiguous sensory stimuli but their value function is assumed to be trivial: their goal is simply correct performance (Britten et al., Reference Britten, Newsome, Shadlen, Celebrini and Movshon1996). In contrast, many real world decisions require additional calculations—subjects need to consider their own value functions, which may not be normatively determined (Glimcher, Reference Glimcher2002; Rangel et al., Reference Rangel, Camerer and Montague2008; Padoa-Schioppa, Reference Padoa-Schioppa2011). For example, different people have different attitudes about risk: some people are risk-seeking and others are risk-averse. Neither of these attitudes is wrong; instead they are assumed to reflect different mappings between objective, external values, and subjective values. Value functions are necessarily covert, although they can be inferred through a large number of decisions (Glimcher, Reference Glimcher2002; Montague & Berns, Reference Montague and Berns2002). Understanding the neural basis of reward-based decisions requires dealing with the additional uncertainty imposed by invisible value functions.
Relative to perceptual decision making, including memory-guided decision making, the neuroscience of reward-based decisions remains relatively unexplored. Current studies have focused on the simplest questions: understanding which reward structures in the brain signal information about rewards and how they do it (Schultz, Reference Schultz2006; Balleine et al., Reference Balleine, Delgado and Hikosaka2007; Rushworth et al., Reference Rushworth, Noonan, Boorman, Walton and Behrens2011). For the most part, it is quite easy to find neurons whose activity correlates with reward value and with other aspects of valuation (Kennerley et al., Reference Kennerley, Behrens and Wallis2011). The trick is carefully determining what variable is encoded, while controlling for other variables that are highly correlated, and what role that signal plays in cognition (Cook & Maunsell, Reference Cook and Maunsell2002; Leathers & Olson, Reference Leathers and Olson2012). For example, motivation is distinct from reward: it is closely correlated with value in the positive domain but strongly anticorrelated in the negative (punisher) domain (Roesch & Olson, Reference Roesch and Olson2004). In other words, a strongly negative reinforcer may motivate avoidance just as strongly as a strongly positive reinforcer motivates approach. Thus, studies that use only positive reinforcers may confuse reinforcer size with motivation. Early studies using only positive rewards suggested that the lateral intraparietal area (LIP) tracks the reward value of shifting gaze to a specific location (Platt & Glimcher, Reference Platt and Glimcher1999). However, a recent study using both positive and negative ones demonstrates that activity of these neurons tracks motivation, not reward (Leathers & Olson, Reference Leathers and Olson2012). Another variable that is closely related to both reward and punishment is attention, which is often frequently confused with reward size (Maunsell, Reference Maunsell2004). Dissociating effects of reward from ancillary effects that correlate with it is seldom trivial (Bendiksby & Platt, Reference Bendiksby and Platt2006). Neuroscientists have now more or less agreed on a central subset of reward structures (e.g., Platt & Glimcher, Reference Platt and Glimcher1999; Averbeck et al., Reference Averbeck, Sohn and Lee2006; Paton et al., Reference Paton, Belova, Morrison and Salzman2006; Wallis, Reference Wallis2007; Kennerley & Wallis, Reference Kennerley and Wallis2009; Krajbich et al., Reference Krajbich, Armel and Rangel2010). These include the orbitofrontal cortex (Wallis, Reference Wallis2007; Padoa-Schioppa, Reference Padoa-Schioppa2011), dorsolateral prefrontal cortex (Barraclough et al., Reference Barraclough, Conroy and Lee2004), anterior cingulate cortex (Hayden et al., 2009b; Hayden et al., 2011a), posterior parietal cortex (Platt & Glimcher, Reference Platt and Glimcher1999), the dopamine system (Schultz, Reference Schultz2006), the ventral striatum (Cai et al., Reference Cai, Kim and Lee2011), and the amygdala (Gottfried et al., Reference Gottfried, O’Doherty and Dolan2003; Paton et al., Reference Paton, Belova, Morrison and Salzman2006). However, this is more or less the state of the field. The precise function and role in cognition of each of these remain contentiously debated. Here, we discuss one area that has received particular attention, which is a site where we have often recorded: the dorsal portion of the anterior cingulate sulcus (dACC).
Neural correlates of reward-based choice
The dACC has long been closely associated with reward representations. Neurons in this region respond following rewarding outcomes (Niki & Watanabe, Reference Niki and Watanabe1979; Ito et al., Reference Ito, Stuphorn, Brown and Schall2003; Williams et al., Reference Williams, Bush, Rauch, Cosgrove and Eskandar2004; Matsumoto et al., Reference Matsumoto, Matsumoto, Abe and Tanaka2007) and track the proximity of rewards (Shidara & Richmond, Reference Shidara and Richmond2002). These signals maintain a representation of reward outcomes across trials (Seo & Lee, Reference Seo and Lee2007; Bernacchia et al., Reference Bernacchia, Seo, Lee and Wang2011). Formal classifications show that these neurons signal reward prediction errors (Amiez et al., Reference Amiez, Joseph and Procyk2006; Matsumoto et al., Reference Matsumoto, Matsumoto, Abe and Tanaka2007; Sallet et al., Reference Sallet, Quilodran, Rothe, Vezoli, Joseph and Procyk2007) or reflect subjective values of options, independent of stimulus attributes (Kennerley et al., Reference Kennerley, Dahmubed, Lara and Wallis2009; Cai & Padoa-Schioppa, Reference Cai and Padoa-Schioppa2012). These results implicate dACC directly in decisions (Walton et al., Reference Walton, Bannerman, Alterescu and Rushworth2003; Williams et al., Reference Williams, Bush, Rauch, Cosgrove and Eskandar2004).
However, as noted above, reward tends to correlate with a variety of other factors that are not reward per se. Thus for example, rewards motivate both learning and small changes in response strategy (i.e., adjustments), and more generally affect the patterns by which we behave in the future. One basic taxonomy is that signals can either be monitoring signals or control signals (Botvinick et al., Reference Botvinick, Braver, Barch, Carter and Cohen2001; Kerns et al., Reference Kerns, Cohen, MacDonald, Cho, Stenger and Carter2004). Monitoring signals track the size of a rewarding outcome and carry a representation of this for use by any downstream structures. Control signals carry information that directly affects ongoing cognitive processes. Control signals may track the size of a rewarding outcome as well but do so only incidentally. Although control signals and monitoring signals are often identical, control depends on contextual factors that influence behavior and monitoring signals do not. Thus, in the case of reward areas, and reward signals, correlation is not enough to infer representation.
Thus, the mechanisms of reward-based decisions comprise at least two distinct processes: an acute reward value comparison and selection process, and a monitoring and adjustment process. Both are absolutely critical to reward-based decisions. Here we focus on the monitoring and adjustment process, although we will briefly discuss the comparison processes as well.
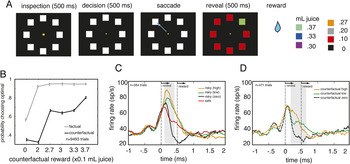
We have recently performed two studies to investigate the role of dACC in reward-based decisions (Hayden et al., 2009b; Hayden et al., 2011a). In one study, monkeys performed a difficult decision-making task in which their goal was to find the baited option among seven decoys (Hayden et al., 2009a). The location of the baited location was determined by a stochastic pattern. Its value varied independently from its location, randomly, from trial to trial. In practice, the monkey was able to guess its location about half the time and failed to guess it correctly the other half. The key element was that monkeys found out what the reward was for the baited option regardless of their decision. On trials when they failed to guess it, the reward was fictive—meaning it would have occurred had they chosen the baited option.
Because we interleaved real and fictive outcomes within single sessions, we were able to compare activity within single neurons for both types of outcomes. Interestingly, we saw a common coding scheme for real and fictive rewards—larger responses for larger rewards, regardless of whether they were real or fictive. This finding is difficult to reconcile with the observation that dACC neurons solely track outcomes of decisions—fictive decisions are, by definition, outcomes that did not occur. They suggest that one of two alternative hypotheses is true—either that dACC tracks multiple types of outcomes and that, presumably, downstream decoders have access to information about whether the outcome was real through other channels—or else that dACC does not track outcomes but tracks some variable that is the same whether the outcome was real or not. What could this variable be?
Rewards have direct effects on behavior. They often lead to quick changes in strategy depending on the type of information they give about upcoming payoffs. Thus, neuron activation patterns that appear to be reward signals may instead be signals that direct a change in strategy. In our fictive learning task, larger outcomes tended to promote an acute adjustment in strategy whether they were real or fictive (Fig. 3).
Schematic of task and results from fictive learning experiment. (A) Illustration of structure of fictive learning task (Hayden et al., 2009a). Stimuli were presented on a dark computer monitor, illustrated by black rectangle. On each trial, a central fixation spot (yellow) appeared, with eight white squares arrayed in a large circle around it. Following a brief hold period, subjects were free to shift gaze to one of the squares to select it. Selection of the square led to an immediate end of the trial. All squares turned color; seven turned red, one turned one of six other colors (see right hand side of panel). Colors validly predicted the reward associated with the chosen option (real reward) or, for the seven unchosen options, the reward that would have been given for that option (fictive reward). (B) Schematic of behavior on next trial (likelihood of choosing the optimal target) as a function of reward chosen (gray line) or the value of the oddball unchosen reward (black line). Larger rewards led to larger probability of choosing optimally, regardless of whether they were real or fictive. (note that there is a strong ceiling effect for real rewards). (C and D) Illustration of peristimulus time histogram (PSTH) of firing rate for one neuron aligned to time reward is revealed (time 0) for real (C) and fictive (D) rewards. This neuron (and majority of other neurons, data not shown) exhibit higher firing rates following larger reward, regardless of whether they were real or fictive.

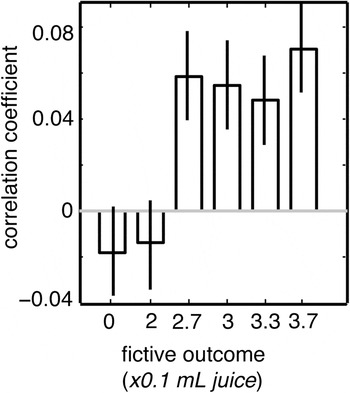
To study this effect more directly, we examined the correlation between behavioral switching and firing rate, holding reward size constant (Fig. 4). We did this by performing the analysis separately for each reward size. This analysis has a lot in common with a CP analysis. Whereas a CP analysis regresses out variations in stimulus properties and correlates residual variation in firing rate with variation in perceptual report, our analysis correlates residual variation in firing with variation in preference. We found that, for four of the six reward sizes used, residual variation in firing rate after controlling for rewards correlated with likelihood of shifting strategy on the next trial (Fig. 4). This finding is consistent with the idea that dACC contributes to the computation and representation of control signals.
Variation in preference is predicted by variation in firing rate. Plot of average correlation between firing rate in response to fictive rewards for all neurons in dataset and likelihood that monkey would choose optimally on the next trial, separated out by reward sizes. For the four larger fictive rewards (2.7, 3, 3.3, and 3.7), there was a significantly positive correlation between firing rate and strategy on the next trial. This analysis has many similarities to the CP type of analysis.

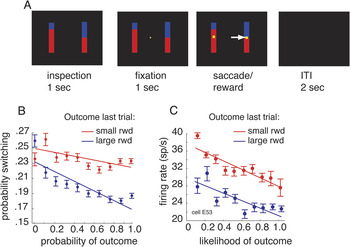
This interpretation is further supported by the results of another study, one that used a different decision-making task (Hayden et al., 2011b). This task is a variant of the explicit gambling task that we have developed to study risk attitudes in rhesus monkeys (Hayden et al., 2008a; Hayden et al., Reference Hayden, Heilbronner and Platt2010). In this task, monkeys chose between pairs of gambles (Fig. 5). Gambles were signaled using vertically oriented bars divided into a red and a blue portion. The size of the red portion indicated the probability that the gamble would yield a small reward and the size of the blue portion indicated the probability that the gamble would yield a large reward.
Schematic of task and results from risky choice experiment. (A) Illustration of risky choice task. On each trial, two options appeared and were freely inspected for 1 s. Then, monkeys fixated, and after a brief delay, they selected one option by shifting gaze to it. Each option offered a gamble defined by a specific probability (1–100% of a large reward, remainder of probability to a small reward). Following choice, gamble was resolved. (B) Monkeys exhibited a bias toward the dominant normative strategy (choose option with greater probability of large reward) to an inferior strategy (choose option with less probability of large reward). In all sessions, monkeys exhibited a greater tendency to switch from the dominant strategy to the inferior one (y-axis) following small rewards than following large rewards. They also exhibited a greater tendency to switch following unexpected rewards, regardless of their sign (x-axis). (C) Neuronal responses following outcomes were greater following small rewards than large rewards and following unexpected rewards than expected ones. The patterns of neuronal responses tracked closely the pattern of behavioral results, suggesting that dACC neurons signal likelihood of strategy adjustment, not reward per se.

Like in the fictive learning study, above, we found that dACC neurons respond most strongly following the rewards that result from choices. We found two clear patterns in the size of these responses. First, neuronal activity is stronger in response to smaller reward than to larger reward—this is the opposite of the pattern we observed in the fictive task. This finding is entirely inconsistent with the results of our fictive learning study and suggests that dACC neurons do not have stable tuning patterns for reward size. Second, we find that responses are greater for unexpected outcomes, regardless of their size. Although these two effects were found to be statistically independent, they pose a problem for decoders: responses to expected small rewards were the same as those to unexpected large ones. Thus, downstream neurons would not be able to distinguish a surprising large reward from an expected small one.
Thus, either downstream decoder regions have some other way to distinguish rewards or they don’t care about rewards but about the effects they have. Indeed, we found that, in this task, surprising rewards and small rewards both motivate switching to a different behavioral strategy. Monkeys generally prefer the option with the greater expected value but, in some cases, switch to the lower valued option. Examining the effect of outcomes on propensity to switch, it is clear that firing rates track switching closely across conditions (Fig. 5). Thus, one parsimonious interpretation of these data is that dACC neurons do not in fact track outcomes but instead signal trial-to-trial adjustments or switches in strategy.
We have used the CP strategy with some success to understand the function of dACC neurons. However, it is not clear that this strategy will solve all the relevant problems. Instead, our findings point to what has been the most successful strategy for making linkages between brain activity and behavior: use of multiple different tasks to study the problem. This is especially useful when the tasks call upon a variety of mappings between variables that correlate with neuronal activity and inputs and outputs.
One major limitation of the work discussed here is that it focuses on one very specific element of reward-based decision making: the way in which the outcomes of one trial influence choices on the next one. These trial-to-trial factors are a critical element of reward-based choices but are different from the complementary problem of understanding the role of neurons at the time of the decision. We focus here on this trial-to-trial element because, historically, it has been more studied and its mechanisms more fully worked out.
However, several groups have begun to investigate the mechanisms of decision at the time of choice as well (Wallis, Reference Wallis2007; Kennerley & Wallis, Reference Kennerley and Wallis2009; Kennerley et al., Reference Kennerley, Behrens and Wallis2011). The basic approach has been to identify the types of reward variables encoded in key reward regions during simple and complex choice tasks (Padoa-Schioppa & Assad, Reference Padoa-Schioppa and Assad2006; Cai et al., Reference Cai, Kim and Lee2011; Hayden et al., 2011b; Padoa-Schioppa, Reference Padoa-Schioppa2011). Although some of these ideas are still in their infancy, there is already a strong reason to believe that the key mechanisms by which two values are compared are similar to those by which two traces are compared in memory. First, reward neurons in OFC appear to show persistent activation in working memory for rewards (Lara et al., Reference Lara, Kennerley and Wallis2009). Second, neuronal models of memory trace comparison work just as well for rewards as they do for stored memories (Wang, Reference Wang2012). Third, there is strong evidence in both fMRI and MEG that reward values are compared through a mutual inhibition process that mirrors closely that used to compare percepts in working memory (Hunt et al., Reference Hunt, Kolling, Soltani, Woolrich, Rushworth and Behrens2012; Jocham et al., Reference Jocham, Hunt, Near and Behrens2012). Although the bigger picture remains to be worked out, it appears that memory- and reward-based decisions may ultimately rely on common processes (Rushworth et al., Reference Rushworth, Noonan, Boorman, Walton and Behrens2011).
Overall, these results highlight our limited understanding of the substrates of reward-based decisions. In contrast to perceptual decisions, which are based on relatively well-understood neural representation of sensory stimuli, the study of neural representation of reward-based decisions is challenged by the difficulty defining the reward or other factors leading to the behavioral choice.
Summary: Putting it all together
The neuroscience of decision making was worked out on what are sometimes called perceptual judgments: identifying features of sensory stimuli based on their perceptual qualities. Much of the basic theoretical and empirical work made it possible to study the neuroscience of decision making and to understand how it works. Here, we have discussed two more complicated forms of decision making.
During the perceptual decision task, we were able to link firing rates of neurons residing in two interconnected cortical areas faithfully representing task relevant motion stimuli, areas MT and DLPFC, to comparison processes likely to provide the basis for perceptual reports. Interestingly, although neurons in both areas carried similar comparison signals, only activity recorded in the DLPFC could be convincingly linked to decisions made by the monkeys. This work, far from complete, shows that neurons processing sensory information have access to signals stored in working memory and that neurons linked to executive control and working memory can faithfully represent both current and remembered sensory signals. Thus, it is likely that the decision-making circuit underlying decisions based on sensory comparisons is likely to include neurons in both cortical areas, each making a distinct contribution to the task at hand.
We were also able to link changes in firing rates of neurons in dACC to switches in behavioral strategies. Although neuronal activity correlated with rewards themselves, across multiple paradigms, the single best explanatory factor for neuronal activity was the monkeys’ propensity to switch or adjust on the subsequent trial. Indeed, by examining the residual variation in firing rate after accounting for reward, a technique that is analogous to CP techniques, we are able to establish a correlative link between firing and switching. These results suggest a basic mechanism by which dACC responses can contribute to reward-based decisions.
Reward and working memory are not the only two factors that can make simple perceptual judgments more complicated and more realistic. Other factors that influence decisions are emotions, long-term learning, including category learning, internal states like hunger, context effects, strategic effects, social contexts, metacognitive factors, and many others. Future studies will need to incorporate each of these factors into our understanding of reward-based choices. Fortunately, as our understanding of the mechanisms of choice matures, we will develop more tools and techniques for asking these questions.
One of the most important problems, also not addressed here, will be to integrate our understanding of decision processes across multiple domains, such as reward, memory, multiple stimulus dimensions, social parameters, emotion, and so on. Current research tends to focus on one problem to the exclusion of others. Thus, work on reward-based choice tends to ignore situations in which perceptual discrimination is difficult and reward on perceptual choice tends to ignore situations in which reward functions are nontrivial. This strategy has undoubtedly been very productive. By focusing on a single dimension, scientists have been able to achieve great understanding of basic decision processes. However, a fuller and complete understanding of decision making will require understanding how multiple influences combine to affect decisions.
Several things make this problem particularly difficult. For example, factors that change motivation, including rewards, alter the strategy that subjects use to perform tasks and may even alter perceptual processes themselves. More generally, introducing additional complexity taxes decision systems and can strongly affect how those decisions get made. Another problem comes from the fact that these various factors must be integrated into a common representation. The locus of this integration, as well as the process, remains unknown.
Thus, one of the major goals for future studies will be to develop a comprehensive account of decision making that incorporates all possible influences on selection of actions. To do this, it will be essential to study decision makers in naturalistic environments subject to natural constraints. Such constraints include competing demands on time and energy, predation risk, competition for resources, and opportunities for mutually beneficial social interactions. In addition, we cannot be limited to a single technique.
Although single-unit recordings have been very informative, we must rely on complementary techniques as well. Such techniques include local-field potential recordings and spike-field coherence measures, neuroimaging in animals and humans, and lesion studies. One critical tool will be direct causal manipulation of neuronal activity. We have begun to make use of temporary local lesions induced by muscimol and of direct activation of neuronal activity by microstimulation. Such techniques provide the strongest evidence linking neuronal activity to a causal role in decision making. For example, we recorded neuronal activity in one poorly understood brain area, the posterior cingulate cortex (PCC) in a gambling task. We found that neuronal responses signaled outcomes of gambles that these outcome signals lasted until the next trial and that they correlated with variance in choice on the next trial (Hayden et al., 2008b). With microstimulation, we were able to show that direct activation of this tissue was sufficient to change preferences on subsequent choices. These results therefore provided much stronger evidence than even CP can provide in linking neuronal activity to the choice process. We hope that similar techniques on a larger scale can provide a new source of confirmation for theories linking neuronal activity to decisions.
Similarly, area MT has always been thought of as a region specialized in processing of current motion stimuli and not linked to the retention of these stimuli during the memory delay. However, the use of microstimulation and lesion approaches provided evidence of MT participation in maintenance and comparison of visual motion stimuli during discrimination tasks. The microstimulation study revealed that injecting current into MT during the memory delay disrupts the ability to perform direction comparisons (Bisley et al., Reference Bisley, Zaksas and Pasternak2001), whereas the lesion study showed that MT is involved in the retention of stimuli requiring motion integration (Bisley & Pasternak, Reference Bisley and Pasternak2000). These studies for the first time implicated area MT in more cognitive aspects of the perceptual decision process, highlighting the importance of applying multiple methodologies in establishing links between neural activity and perceptual decision.
Interpreting the data that arise from such situations will require care, and having a good solid understanding of the fundamentals will be critical. Thus, we see the study of memory and reward as two building blocks that can contribute to a larger understanding of decision making. Despite the difficulties, however, natural decision making, with all its various complexities, factors, and biases, is one of the chief functions our brains have evolved to accomplish. Achieving a comprehensive integrated account is an important goal for future studies. Doing so will benefit from the decades of research on the neural mechanisms of simpler types of decisions.
Acknowledgment
This work was supported by Grants from the National Institutes of Health, NEI 11749 (TP), T32 EY07125 and P30 EY01319 to the Center for Visual Science, and by grants from NIDA 027718 (BYH) and NSF BCS 1253576 (BYH).