
Introduction
Two-dimensional (2D) MoS2 has attracted considerable attention in recent years in various areas of applied physics. As a layered semiconductor, it shows good promise in future ultra-thin nanoelectronic devices. However, the nature of the substrate, surface roughness, and charged impurity scattering centers have been shown to substantially degrade carrier mobility in layered 2D semiconductors[Reference Wang, Kalantar-Zadeh, Kis, Coleman and Strano1, Reference Yu, Ong, Li, Xu, Zhang, Zhang, Shi and Wang2], hampering their applications in novel electronics. Engineering of the contact interface and/or top layer surface may open avenues for tailoring the electrical performance of MoS2[Reference English, Shine, Dorgan, Saraswat and Pop3, Reference Chuang, Battaglia, Azcatl, McDonnell, Kang, Yin, Tosun, Kapadia, Fang, Wallace and Javey4]. Plasma treatment is an effective and versatile method of modifying the properties of 2D materials, enabling a wide range of applications. In particular, oxygen plasma treatment has shown promise in effective surface doping of layered semiconductors in order to tune their electrical performance. This strategy has been used to implement rectifying diodes, multibit nonvolatile memory, electrocatalysts and ambipolar transistors based on 2D MoS2[Reference Chuang, Battaglia, Azcatl, McDonnell, Kang, Yin, Tosun, Kapadia, Fang, Wallace and Javey4–Reference Giannazzo, Fisichella, Greco, Di Franco, Deretzis, La Magna, Bongiorno, Nicotra, Spinella, Scopelliti, Pignataro, Agnello and Roccaforte8]. Such an approach to nanofabrication offers large-scale, on-substrate, and rapid functionalization of 2D materials at low costs. However, to harness the potential applications of plasma treatment for 2D nanodevices, a comprehensive understanding of charge transport in defective systems must be achieved, as atomic vacancies form readily during plasma treatment[Reference Giannazzo, Fisichella, Greco, Di Franco, Deretzis, La Magna, Bongiorno, Nicotra, Spinella, Scopelliti, Pignataro, Agnello and Roccaforte8, Reference Jadwiszczak, O'Callaghan, Zhou, Fox, Weitz, Keane, Cullen, O'Reilly, Downing, Shmeliov, Maguire, Gough, McGuinness, Ferreira, Bradley, Boland, Duesberg, Nicolosi and Zhang9].
In this paper, we report on the low-temperature electrical characterization of mechanically-exfoliated bilayer MoS2 field effect transistors (FETs) which had undergone treatment with O2:Ar (1:3) plasma over controlled short-time intervals. We study the effect of the plasma treatment on the effective Schottky barrier height (SBH) between the MoS2 and the electrode metal, and its effect on the emission current at different temperatures and gate biases. We find that the Efros–Shklovskii (ES) hopping mechanism governs the conduction behavior in the pristine device. At low temperatures, below T* ≈ 181 K, the defective plasma-treated MoS2 system undergoes an additional crossover to a mixed thermally-activated regime.
Experimental methods
MoS2 FETs were fabricated from mechanically exfoliated bilayer flakes (SPI Supplies, West Chester, PA, USA) in a back-gated geometry on 285 nm-SiO2/Si chips pre-cleaned with acetone and isopropyl alcohol. The thickness of the samples was confirmed by optical contrast microscopy against cross-calibrated atomic force microscope data. Electrical contacts were fabricated by thermal evaporation of a Ti adhesion layer (5 nm) followed by Au (40 nm) on areas pre-defined by electron beam lithography (EBL), utilizing poly(methyl methacrylate) as resist. Fabricated on-chip MoS2 devices were modified in a Fischione Instruments 1020 plasma cleaner operating on a 1:3 mixture of O2:Ar gas at a constant chamber pressure of ~5 mbar. The samples were always placed in the same position in the chamber (to within ±1 mm).
After each plasma exposure, the device was characterized electrically in a two-probe configuration in an in situ cryogenic stage environment (Kammrath & Weiss), cooled by liquid N2 inside a scanning electron microscope (SEM) chamber maintained at a pressure of 10−4 mbar. Tungsten nanomanipulator tips (Imina miBot) served as source and drain terminals powered by an Agilent B2912A dual channel source meter. The measurements were taken starting at 83 K and finishing at room temperature. Before each characterization at a new temperature, the system was left to equilibrate so that the temperature variation was <1 K for longer than 5 min. The samples were then removed from the system and exposed to the ambient when transferring to the plasma cleaner for further plasma treatment. High-resolution transmission electron microscopy (HRTEM) was performed in an FEI Titan 80–300 microscope at a beam energy of 300 keV and chamber pressure of ~10−7 mbar. The samples were first exfoliated onto SiO2 substrates and transferred onto TEM grids by stamping with poly(vinyl alcohol), followed by dissolution in water. They were then treated in the plasma cleaner while in the TEM sample holder and immediately placed into the microscope for imaging.
Results and discussion
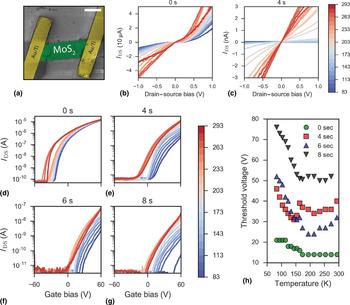
The morphology of the device was revealed by using a scanning electron microscope (SEM). Figure 1(a) shows a false-colored SEM micrograph of a typical bilayer device after EBL processing. The IV curves measured at zero gate bias shown in Figs. 1(b) and 1(c) demonstrate the effect of plasma treatment on the transport properties of the bilayer MoS2. Before treatment, the device outputs tens of microamps (I ds) at drain–source biases of V ds = ± 1 V, even at cryogenic temperatures. The semiconducting nature of the material is evident from the transport gap observed around the zero-point at low temperatures, and the non-linearity of the sweeps. After 4 s of plasma treatment, the output current has dropped several orders of magnitude (~nA) and subsequent treatments to 6 and 8 s drop the current levels to the noise floor of the instrument (see Supporting Information; Fig. S1). Importantly, for the 4-s treated sample, the output characteristics exhibit a clear linear relationship between the applied bias V ds and the output current I ds.
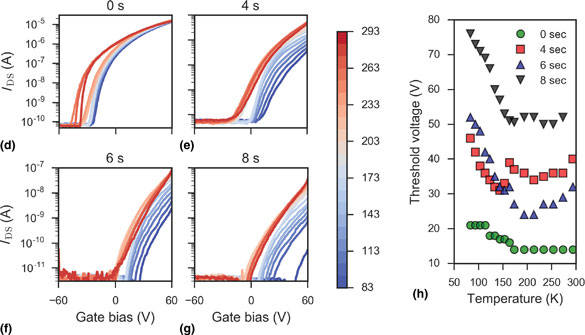
(a) False-colored SEM micrograph of contacted bilayer MoS2 device. Scale bar is 1 µm. (b) IV plots of the device before plasma treatment at different temperatures. (c) IV plots of the device after 4 s of plasma exposure. Curves are colored according to the temperature scale bar on the right (in Kelvin). (d)–(g) Gate curves taken at temperatures mapped to color scheme on the scale bar (in Kelvin) at plasma treatment times of 0, 4, 6, and 8 s, respectively. (h) Threshold voltage shift with the temperature at each of the exposure times.

The transfer characteristics of the same device were also tested at different temperatures and are presented in Figs. 1(d)–1(g). The untreated MoS2 gate sweeps follow standard literature observations, with inversion onset in the negative gate bias region, and a qualitative temperature dependence for the sweeps noted in both monolayers[Reference Jariwala, Sangwan, Late, Johns, Dravid, Marks, Lauhon and Hersam10] and bilayers[Reference Baugher, Churchill, Yang and Jarillo-Herrero11] of MoS2. After plasma exposures, the current magnitude drops significantly as exposure time increases while the threshold voltage, V th, is seen to drastically shift to larger positive gate biases with decreasing temperature. This dependence is charted in Fig. 1(h) for all exposure times, indicating an almost linear increase in V th after each exposure time below ~155 K. This scaling is in line with the approximate dependence often utilized for MOSFETs[Reference Filanovsky and Allam12], and may originate in the temperature-dependent charge carrier density variation in the 2D MoS2 channel.
Around 200 K a clear gap, ΔV th, develops in the gate sweeps, separating the blue (low temperatures) curves from the red (high temperatures) ones along the gate bias axis. At the same time, the treated devices are seen to deviate from standard MoS2 FET transfer characteristics. The different regions of the transfer curve cannot now be easily distinguished. With increasing plasma treatment time, the shape of the curves indicates that the channel cannot be strongly inverted in the tested gate bias range. This is especially evident at low temperatures. As this shift is also seen in the pristine sample, we do not attribute the origin of ΔV th to the plasma exposure process. It is, however, exacerbated with continuing plasma treatment and correlates with the increasing concentration of surface defects. The exact nature of this ΔV th observation in layered 2D semiconductors necessitates further investigation in the future; though it is known that the physical origin of V th is closely linked to the concentration of defects on the surface of 2D FETs[Reference Shu, Wu, Guo, Liu, Wei and Chen13].
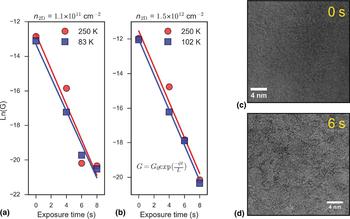
We track the conductance drop in the sample with increasing plasma exposure time at different carrier densities in the high- and low-temperature regimes in Figs. 2(a) and 2(b). From the semi-logarithmic plots, we find good linear fits confirming an exponential drop in conductance with increasing plasma exposure time. The layer number-normalized exponential drop in electron mobility over time, μ(t), in oxygen plasma-treated MoS2 has previously been reported to scale as[Reference Khondaker and Islam14]:
 $$\displaystyle{{\mu (t)} \over L}\; \propto {\rm e}^{ - \varphi t/L}, $$
where L is the MoS2 layer number, φ = μ′/μ and μ′ is the plasma-time derivative of the mobility. Following this convention, we can extract the plasma-time rate of change of the conductance, G, in our bilayer sample, with φ G = 2.02 s−1. The contribution of MoO3 species formed by the oxygen-containing plasma may lead to the formation of an effective semiconducting medium in the FET channel. This, in turn, may give rise to the exponential dependence of current tunneling through the newly-formed heterostructure-like interface[Reference Khondaker and Islam14, Reference Choudhary, Islam, Kang, Tetard, Jung and Khondaker15].
(a) Conductance, G, plotted on semi-log plot as a function of plasma treatment time at a carrier density of the order of 1011 cm−2. The solid lines are linear fits at high (red) and low (blue) temperatures. (b) Similar plot from data extracted at a carrier density of the order of 1012 cm−2. Both sets of data fit the exponential plasma time decay model (equation included on the plot), regardless of carrier density. (c) HRTEM image of MoS2 flake before plasma treatment. (d) HRTEM image of MoS2 flake following plasma treatment of 6 s. Noticeable amorphization occurs on the surface of the material due to the formation of molybdenum oxides.

We note that at this rate of plasma exposure, the bilayer MoS2 device becomes substantially damaged after 6 s of treatment, as field effect mobility values at 0 V gate bias drop below 1 cm2/(Vs) and output current at no gate bias is below the nA range (see Supporting Information; Fig. S1). Figures 2(c) and (d) are high-resolution transmission electron micrographs of the same few-layer MoS2 sample before and after 6 s of plasma treatment, respectively. Plasma-induced damage to the surface of MoS2 is evident from the contrast change after 6 s of treatment. The amorphous oxide which forms on the surface through a sulfur-replacing reaction creates severe defects in the material[Reference Cui, Brown and McKinley16]. It can then act as a source of short-range scattering which reduces the device conductance[Reference Khondaker and Islam14, Reference Islam, Kang, Bhanu, Paudel, Erementchouk, Tetard, Leuenberger and Khondaker17].
We go on to analyze the temperature-dependent emission current in the bilayer MoS2 system as it undergoes modification by the O2:Ar plasma. Charge injection from the metal electrode into the 2D semiconductor (at moderate doping levels) is mostly governed by thermionic emission over the Schottky barrier at sufficient temperatures. Furthermore, Fermi level pinning occurs near the bottom of the conduction band of the MoS2, independent of metal work function[Reference Kim, Moon, Lee, Choi, Ahmed, Nam, Cho, Shin, Park and Yoo18]. When considering current injection for this 2D system, the Richardson equation is modified as follows:
 $$I_{{\rm ds}} = A_{2{\rm D}}^* T^{3/2} \exp \left( {\displaystyle{{q\Phi _{\rm B}} \over {k_{\rm B} T}}} \right)\left[ {1 - {\rm exp}\left( {\displaystyle{{qV_{{\rm ds}}} \over {k_{\rm B} T}}} \right)} \right],$$
where  $A_{2{\rm D}}^* $ is the Richardson constant for a 2D system, T is the temperature, q is the Coulombic charge, k B is the Boltzmann constant, ΦB is the effective SBH and V ds is the drain–source bias. We note that effective ΦB can thus be extracted from the slope of the ln[I ds/T 3/2] versus 1000/T curve.
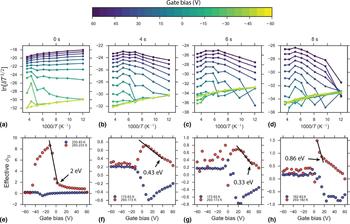
A series of such plots is presented in Figs. 3(a)–(d) as the device progresses through increasing plasma treatment. The data are color-mapped to the scale bar above to denote the gate bias at which the current was extracted. The 0 s data fit well to the linear model below 233 K, while at higher temperatures and gate biases between ~−50 and ~0 V a different slope is extracted in the regime corresponding to thermionic emission only. When the device is exposed to the plasma for 4 s and the amorphous oxidized regions start to form on the surface, a significant break in the temperature dependencies occurs beyond ~150 K at higher gate biases. In this region, both the tunneling and thermionic components begin to contribute to transport between the metal and the effective semiconducting medium of oxidized MoS2. Accompanied by decreased emission current even at higher gate biases, this break in the trend persists in the same temperature range after 6 and 8 s.
(a)–(d) Richardson plots for the MoS2 device as it progresses through plasma treatment. The curves are color-mapped to the extraction gate bias scale on the color bar above. (e)–(h) Plots of the effective SBHs (ΦB) extracted from the corresponding above Richardson plots across the whole gate bias range. The values were obtained in the low- and high-temperature ranges labeled on each plot. The end of the linear dependencies on each respective plot marks the SBH extracted at the flat-band voltage.

Figures 3(e)–(h) present effective SBHs at each gate bias derived in the high (red) and low (blue) temperature regimes as the reaction with plasma progress. Following the convention of Kim et al.[Reference Kim, Moon, Lee, Choi, Ahmed, Nam, Cho, Shin, Park and Yoo18], we extract the true barrier heights at the flat-band voltage (V fb) for each plasma time. At high temperatures, one can accurately extract the true SBH by considering the end of the linear region of the ΦB dependence on gate bias. For biases below the flat-band voltage, the contribution of tunneling to the injection current should be negligible, ensuring only thermionic emission over the true barrier height. At low temperatures, the tunneling component will be more significant, and so true SBH values cannot be readily extracted for a semiconductor with a significant band gap such as MoS2[Reference Kim, Moon, Lee, Choi, Ahmed, Nam, Cho, Shin, Park and Yoo18, Reference Wang, Yao, Huang, Zou, Liao, Chen, Fan, Zhang, Wu and Xiao19]. With increasing plasma exposure time, a significant shift of V fb occurs, naturally correlating with the positive V th shift recorded in the gate sweeps in Figs. 1(d)–1(g). At the same time, Schottky barrier lowering is experienced by the MoS2/Ti–Au interface with increasing plasma treatment. Altering of the SBH for MoS2/metal interfaces has previously been performed with pure O2 plasma, allowing for additional hole injection by effective depinning of the Fermi level[Reference Giannazzo, Fisichella, Greco, Di Franco, Deretzis, La Magna, Bongiorno, Nicotra, Spinella, Scopelliti, Pignataro, Agnello and Roccaforte8]. We do not observe ambipolar FET behavior in our devices across the tested sweep range of ±60 V, indicating that the argon-induced formation of sulfur vacancies is the dominant doping mechanism, and a much larger negative back gate voltage would be required to enter the hole branch on the transfer curves.
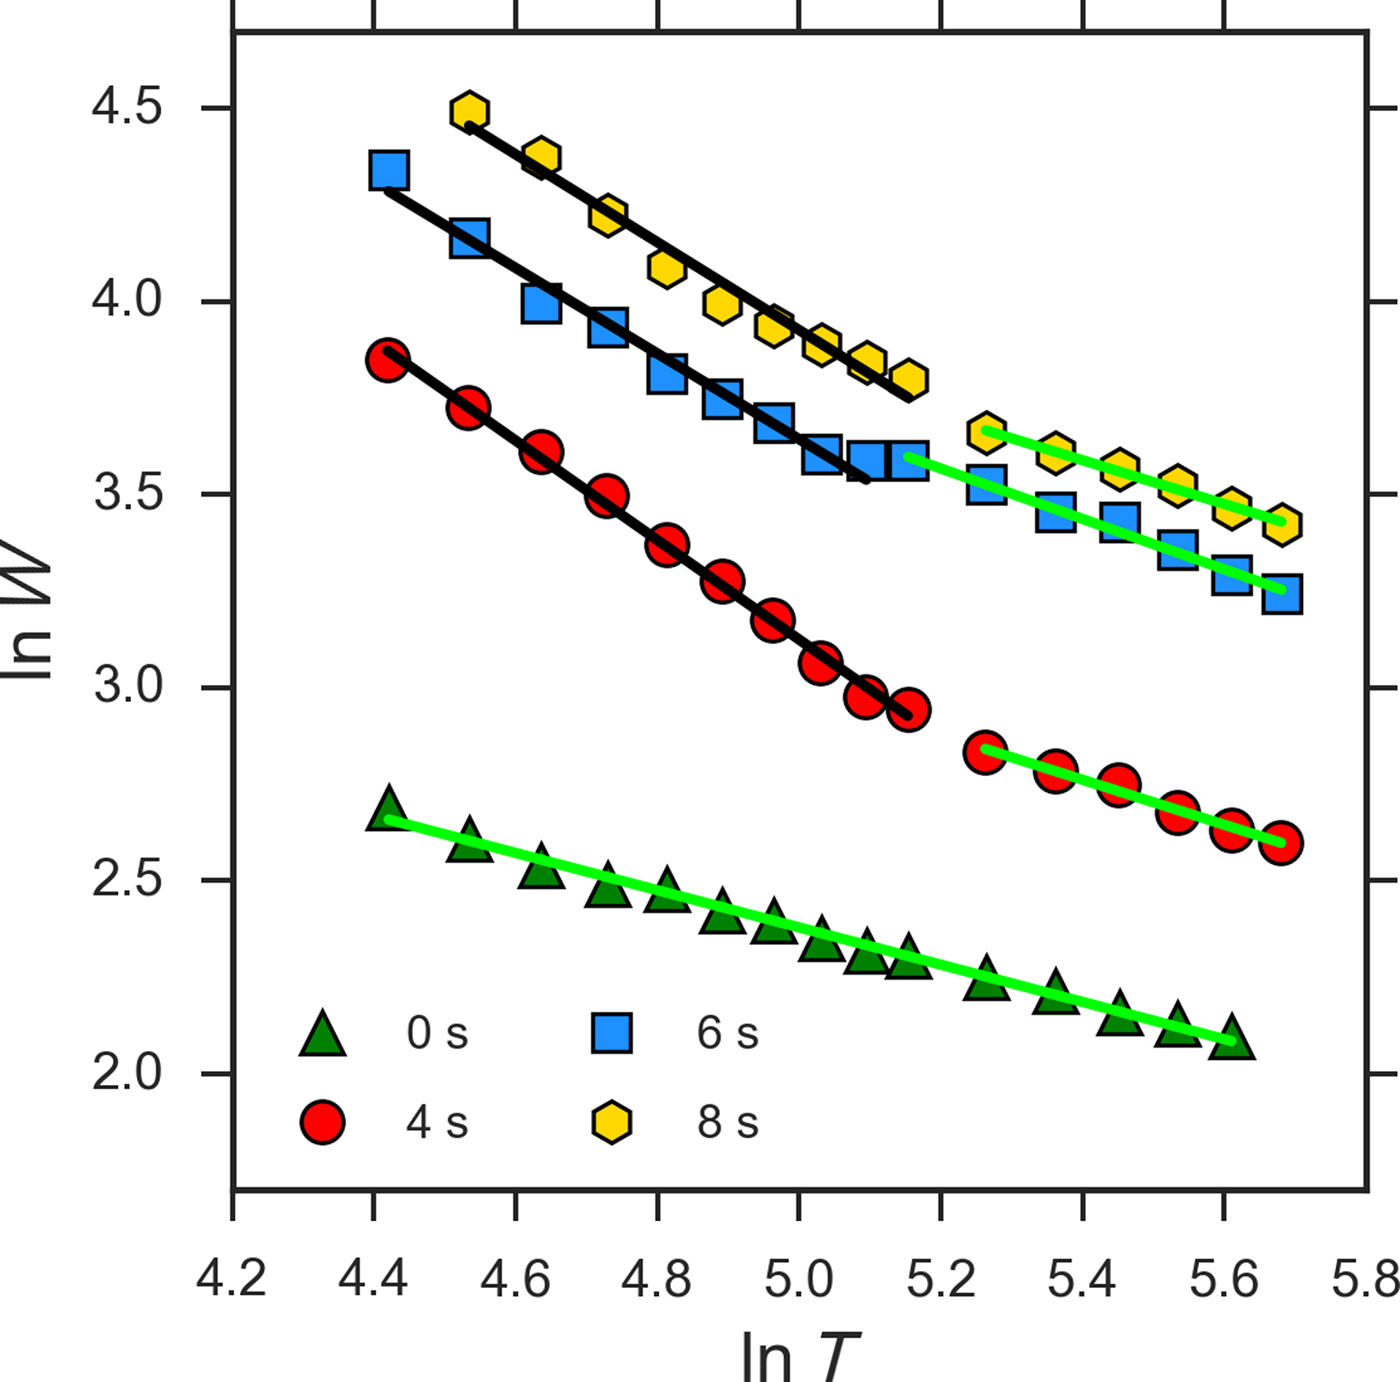
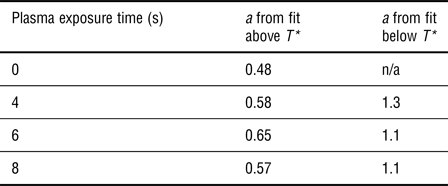
We investigate the temperature-dependent conductance mechanism for electrons in defective plasma-treated MoS2 in Fig. 4. By extracting the parameter, W = −∂ln(ρ)/∂ln(T), where ρ is the device resistivity and T is the measurement temperature, the conduction mechanism can be determined from the slope of the plot of ln(W) versus ln(T), due to the exponential dependence of conductivity on temperature and device dimensionality[Reference Yildiz, Serin, Serin and Kasap20–Reference Kim, Kim, Zhao, Kim, Lee, Jin, Choi, Moon, Bae, Lee and Lim22]. These plots are presented for the various plasma treatment times in Fig. 4. We note that negative slope values in these plots indicate semiconducting behavior for the sample after all treatment times. A good linear fit is found for the untreated sample with a slope indicating a conductance exponent of a = 0.48, i.e., conductance scales as T −0.48. Mott-like variable range hopping[Reference Jariwala, Sangwan, Late, Johns, Dravid, Marks, Lauhon and Hersam10, Reference Qiu, Xu, Wang, Ren, Nan, Ni, Chen, Yuan, Miao, Song, Long, Shi, Sun, Wang and Wang23], which scales as T −1/3, has been considered the main conductance mechanism at low temperatures in semiconducting MoS2. However, mixed transport[Reference Kim, Kim, Zhao, Kim, Lee, Jin, Choi, Moon, Bae, Lee and Lim22, Reference Stanford, Pudasaini, Gallmeier, Cross, Liang, Oyedele, Duscher, Mahjouri-Samani, Wang, Xiao, Geohegan, Belianinov, Sumpter and Rack24, Reference Matis, Garces, Cleveland, Houston and Baldwin25] regimes have been reported recently in polymorphic, defective, and encapsulated layered transition metal dichalcogenides, respectively, at various temperatures. The dependence we find for our mechanically-exfoliated bilayer is in line with ES hopping (T −1/2) which has recently been observed in polymorphic low-dimensional MoS2[Reference Papadopoulos, Steele and van der Zant21]. This may be indicative of a highly sulfur vacancy-rich sample, where electron–electron interactions reduce the density of states near the Fermi level according to the ES model[Reference Efros and Shklovskii26].
Plot of ln(W) as a function of ln(T) used to extract the conduction mechanism exponent a. The colored points are the experimental data for each exposure time, the green lines are linear fits to the data close to the ES regime, black lines are fits close to the T −1 regime. The extracted slopes are tabularized in Table 1.

As the sample is exposed to the plasma, a change in the conduction regime is observed, where the critical exponent a is now >0.5 at high temperatures (see Table 1). This indicates a mixing of the ES and nearest-neighbor hopping regimes. Below a critical temperature T* ≈ 181 K, the conduction mechanisms are fitted well with T −1.3, T −1.1, and T −1.1 dependencies for 4, 6, and 8 s, respectively. This scaling at low temperatures follows a quasi-Arrhenius relation, with an increased activation energy likely due to the presence of plasma-generated defective regions. A metal–insulator transition[Reference Radisavljevic and Kis27] due to electron–electron interactions is expected to occur at high carrier densities (n 2D ~ 1013 cm−2). We were not able to reach this order of n 2D in this experiment, as a top gate could not be fabricated without losing access to sample surface. We note here that although the conductivities were extracted at the same n 2D past the flat-band voltage, the break in the conductance regimes and the change in the SBH could not be decoupled for this analysis in the two-probe measurement scheme. The values of the exponent a for each temperature regime and plasma time are summarized in Table 1.
Summary of extracted a exponents in each temperature regime for every plasma treatment time.

This type of conduction mechanism shift has previously been studied in hydrogenated amorphous Si films, where a reverse dependence was found for the conduction regimes[Reference Yildiz, Serin, Serin and Kasap20]. We note that our case cannot be treated as a simple amorphization of the whole material, as the reaction with the plasma proceeds from the surface only. The underneath MoS2 layer in the bilayer system may not inherit as many defect centers, preserving a degree of crystallinity for the device and contributing to the unusual mixed transport regime. From Mathiessen's rule, it is known that the residual resistivity in semiconducting MoS2 at low temperatures is due to the impurity scattering term, (μ imp)−1, which comprises both the long-range and short-range Coulombic scattering components[Reference Cui, Lee, Kim, Arefe, Huang, Lee, Chenet, Zhang, Wang, Ye, Pizzocchero, Jessen, Watanabe, Taniguchi, Muller, Low, Kim and Hone28]. In encapsulated and pristine MoS2 FETs, this has been shown to dominate carrier transport below 100 K[Reference Baugher, Churchill, Yang and Jarillo-Herrero11, Reference Radisavljevic and Kis27, Reference Cui, Lee, Kim, Arefe, Huang, Lee, Chenet, Zhang, Wang, Ye, Pizzocchero, Jessen, Watanabe, Taniguchi, Muller, Low, Kim and Hone28]. In the presently-discussed case of plasma-modified 2D MoS2, the impurity concentration may be sufficient to allow for dominant contribution of disorder-born scattering at temperatures as high as 181 K. This may have its origin in the increased presence of amorphous molybdenum oxides on the surface of the flake, as well as sulfur vacancy traps originating from plasma-etched regions[Reference Jadwiszczak, O'Callaghan, Zhou, Fox, Weitz, Keane, Cullen, O'Reilly, Downing, Shmeliov, Maguire, Gough, McGuinness, Ferreira, Bradley, Boland, Duesberg, Nicolosi and Zhang9]. These mid-gap trap states reduce output current at zero gate bias, and shift V th to increasingly positive biases as plasma exposure progresses in time. A larger gate voltage is required to tune the Fermi level past the trap states and into the conduction band. This effective band gap increase has been reported previously with photoluminescence measurements in rapidly plasma-oxidized MoS2[Reference Ko, Jeong, Kim, Lee, Kim, Lee, Ryu, Park, Kim, Lee, Lee, Lee and Ryu29, Reference Dhall, Neupane, Wickramaratne, Mecklenburg, Li, Moore, Lake and Cronin30].
Conclusions
The effects of increasing oxygen:argon plasma treatment on bilayer MoS2 were studied as a function of temperature. The ES hopping regime of the untreated sample was seen to transition to a mixed ES/thermally-activated regime at high temperatures upon plasma treatment. Another crossover was observed in the defective system, below 181 K, to a strongly short-range Arrhenius regime. We attribute the crossover at such a high temperature to a critical defect density achieved by continuing plasma treatment. Investigation of the temperature-dependent emission current determined a significant lowering of the effective SBH for the bilayer MoS2 FET with plasma treatment while preserving the unipolar nature of the transistor. Increased understanding of transport properties in defective 2D materials is crucial to the success of future electronic devices fabricated using plasma treatment. This study is, to our knowledge, the first report on low-temperature electrical measurements of plasma-exposed MoS2, and is therefore of interest to groups working in the fields of solid-state physics and 2D nanodevices.
Supplementary material
The supplementary material for this article can be found at https://doi.org/10.1557/mrc.2018.72
Acknowledgments
We are grateful to members of staff at the Advanced Microscopy Laboratory, CRANN, Trinity College Dublin for their continued technical support. We thank Robert O'Connell for assistance with liquid nitrogen, and Daniel S. Fox for assistance with TEM. The work at the School of Physics and the Centre for Research on Adaptive Nanostructures and Nanodevices at Trinity College Dublin is supported by Science Foundation Ireland [grant No: 11/PI/1105, 12/TIDA/I2433 07/SK/I1220a].