Introduction
It is widely believed that depressive symptoms exist on a continuum of severity that includes subthreshold depression (SUBD), a condition described as a clinically relevant level of depressive symptoms without meeting full diagnostic criteria for a major depressive disorder (MDD) according to DSM or ICD criteria (Pietrzak et al. Reference Pietrzak, Kinley, Afifi, Enns, Fawcett and Sareen2013). Recent studies have shown that SUBD represents a large burden of disease (Barry et al. Reference Barry, Allore, Bruce and Gill2009) both in individual patients and at the community level (Johnson et al. Reference Johnson, Weissman and Klerman1992; Cuijpers et al. Reference Cuijpers, Smit, Oostenbrink, De Graaf, Ten Have and Beekman2007). This burden is due to a combination of a high prevalence, prevalence rates estimated around 10% of all older adults (Meeks et al. Reference Meeks, Vahia, Lavretsky, Kulkarni and Jeste2011), and its effects on quality of life (Chachamovich et al. Reference Chachamovich, Fleck, Laidlaw and Power2008), physical health (Beekman et al. Reference Beekman, Penninx, Deeg, Ormel, Braam and van Tilburg1997), disability (Chopra et al. Reference Chopra, Zubritsky, Knott, Have, Hadley, Coyne and Oslin2005), mortality (Cuijpers et al. Reference Cuijpers, Vogelzangs, Twisk, Kleiboer, Li and Penninx2013), and healthcare utilization (Cuijpers et al. Reference Cuijpers, de Graaf and van Dorsselaer2004).
Extensive literature is available documenting the effects of different strategies to prevent MDD (Schoevers et al. Reference Schoevers, Smit, Deeg, Cuijpers, Dekker, van Tilburg and Beekman2006). These focus on (a) the whole population (universal prevention), (b) those at risk due to exposure to known risk factors for MDD (selective prevention) and (c) those at even higher risk of MDD due to their exhibiting prodromal signs and symptoms of depression (indicated prevention). Several studies among all age groups have demonstrated that indicated prevention of depression is feasible, effective and cost-effective (Horowitz & Garber Reference Horowitz and Garber2006; Smit et al. Reference Smit, Ederveen, Cuijpers, Deeg and Beekman2006; Van't Veer-Tazelaar et al. Reference Van't Veer-Tazelaar, van Marwijk, van Oppen, van der Horst, Smit, Cuijpers and Beekman2011). Indicated prevention is delivered using low-cost psychological interventions, such as cognitive behavioural therapy, and may reduce the incidence of MDD at 6 months by 39%, yielding a number needed to treat (NNT) that was estimated at 10 (Cuijpers et al. Reference Cuijpers, Koole, van Dijke, Roca, Li and Reynolds2014). This compares favourably with preventative interventions elsewhere in medicine. For example, the NNT with any statin to prevent one case of cardiovascular disease over 5 years was estimated 33 and 37, for men and women, respectively (Hippisley-Cox & Coupland, Reference Hippisley-Cox and Coupland2010).
Nonetheless, the availability and actual use of indicated prevention of MDD remains very limited in most countries. A recent study has shown that it requires much effort to reach eligible persons with depressive symptoms who are interested in accepting treatment (Van Beljouw et al. Reference Van Beljouw, Heerings, Abma, Laurant, van't Veer-Tazelaar, Baur, Stek, van Marwijk and Van Exel2015). Improving the selection of those older people, in whom preventative intervention may be feasible, may encourage the field to adopt prevention as a mainstream strategy.
SUBD may represent a prodromal state and important risk indicator for the later development of MDD (Meeks et al. Reference Meeks, Vahia, Lavretsky, Kulkarni and Jeste2011), a chronic mild depression or a transient, self-limiting mood state (Beekman et al. Reference Beekman, Geerlings, Deeg, Smit, Schoevers, de Beurs, Braam, Penninx and van Tilburg2002; Hermens et al. Reference Hermens, van Hout, Terluin, van der Windt, Beekman, van Dyck and de Haan2004). One implication of these findings is that the majority of those older patients eligible for indicated prevention would not develop MDD, thus wasting resources or even harming patients through iatrogenic effects. Psychological harm may arise from anticipated discomfort towards prevention programmes or as a consequence of being labelled as ‘sick’ or ‘at risk’ (Marshall, Reference Marshall1996). Consequently it is crucial to distinguish between people who are truly at risk for MDD from those who are not. This requires detailed knowledge about the long-term prognosis of late-life SUBD and predictors of outcome, which are largely lacking. The reported risks in previous studies were mainly based on follow-up periods of approximately 1 or 2 years (Meeks et al. Reference Meeks, Vahia, Lavretsky, Kulkarni and Jeste2011). The time-frame at which MDD develops from SUBD in late life is not known, but this might well be longer than 2 years. In order to enhance indicated prevention strategies, studies with longer follow-up periods are needed to examine the long-term prognosis of late-life SUBD more precisely and examine predictors of its outcome.
A useful framework for understanding the aetiology of depressive episodes in older community-dwelling adults has been the dynamic stress-vulnerability model (DSVM; Ormel et al. Reference Ormel, Oldehinkel and Brilman2001), which implies that interplay between vulnerability and stress factors determines the risk of developing MDD, where pathogenic effects of stress are more pronounced when people are more vulnerable. According to this theory, variations in exposure to vulnerability and stress factors may account for differences in the long-term prognosis of SUBD.
In the present study, we investigate a wide range of vulnerability and stress-related variables in a longitudinal design with up to 17 years of follow-up to identify both predictors of MDD and recovery in a population-based sample of older people with SUBD. We hypothesize that a substantial group of older adults with SUBD has short-lived and self-limiting symptoms, likely to be determined by concurrent psychosocial circumstances (stress related); and those more at risk of developing MDD are more likely to exhibit longstanding vulnerability for mood disorders.
Method
Sampling
Data were used from the Longitudinal Aging Study Amsterdam (LASA), an ongoing prospective cohort study on determinants and consequences of changes in functioning in relation to ageing of community-dwelling older people in The Netherlands. Sampling, response and procedures are described in detail elsewhere (Huisman et al. Reference Huisman, Poppelaars, van der Horst, Beekman, Brug, van Tilburg and Deeg2011). In short, at the first LASA cycle in 1992 and 1993, a representative sample stratified by age, sex and degree of urbanization of N = 3107 community-dwelling older people aged 55–85 years was interviewed. Since then, follow-up cycles have been conducted roughly every 3 years until 2008/2009, resulting in an observation period up to 17 years. Participants were interviewed at their homes, by well-trained interviewers. Written informed consent was obtained prior to study enrolment, in accordance with legal requirements in The Netherlands.
For the current study, data from the first (1992/1993), second (1995/1996) and third (1998/1999) cycles were used to compose a study sample of N = 341 eligible participants with SUBD. Data for the predictor variables were taken from the corresponding incident cycle. Fig. 1 shows the recruitment of participants with SUBD. Eligible for inclusion were participants aged 55–85 years identified as having SUBD on either of the first three LASA cycles and having at least one follow-up measurement after enrolment in this study. Participants were able to skip a follow-up interview and then rejoin the study. The proportion of the SUBD sample that was retained after 3 years of follow-up was 89.4%, after 6 years 66.9%, after 9 years 49.9%, after 12 years 34.4% and after 15 years 24.1%.
Sampling subthreshold depression (SUBD) by using a two-stage-screening design in the Longitudinal Ageing Study Amsterdam; CES-D, Center of Epidemiological Studies Depression Scale; DIS, Diagnostic Interview Schedule.

Measures
Prognosis of SUBD
The prognosis of late-life SUBD was based on the three outcome variables: ‘subthreshold depression (SUBD)’, ‘major depressive disorder (MDD)’ and ‘recovery from SUBD’.
SUBD
A two-stage-screening design was used to identify SUBD as follows. First, the Center for Epidemiologic Studies Depression Scale (CES-D) was applied to identify participants with clinically relevant depressive symptoms (cut-off score of CES-D ⩾ 16) (Radloff, Reference Radloff1977; Berkman et al. Reference Berkman, Berkman, Kasl, Freeman, Leo, Ostfeld, Cornoni-Huntley and Brody1986). The psychometric properties of CES-D were found to be good (Beekman et al. Reference Beekman, van Limbeek, Deeg, Wouters and van Tilburg1994). Second, the Diagnostic Interview Schedule (DIS) was scheduled for participants that screened positive in the first stage (CES-D ⩾ 16) and took place 2–8 weeks after the CES-D interview. Participants with clinically relevant depressive symptomatology (CES-D ⩾ 16) but without MDD diagnosis were indicated as having SUBD.
MDD
The DIS, a structured interview designed for epidemiological research, was used at baseline and follow-up to diagnose dysthymic or MDD in a reliable and valid manner according to DSM-III (Robins et al. Reference Robins, Helzer, Croughan and Ratcliff1981). Participants had to have a past-year diagnosis of MDD during follow-up. Timing of the MDD episode was calculated as the time point half way that year, thus follow-up time until the interview minus 6 months.
Recovery from SUBD
Recovery was defined as a combination of (i) a relevant decline in depressive symptomology (⩾5 CES-D points) between two measurements during follow-up thereby crossing the CES-D cut-off score (CES-D = 16), and (ii) remaining non-depressed (CES-D < 16) throughout the rest of the study. The difference of 5 CES-D points for a relevant decline fits in with the definition of a reliable change (Jacobson & Truax, Reference Jacobson and Truax1991); which takes into account the reliability, average score and standard deviation (s.d.) of the CES-D in LASA (Geerlings et al. Reference Geerlings, Beekman, Deeg and Van Tilburg2000); and with the principle of a medium effect size according to Cohen (Reference Cohen1988). A similar definition and CES-D score of a relevant change was used in earlier studies (Geerlings et al. Reference Geerlings, Beekman, Deeg and Van Tilburg2000; Beekman et al. Reference Beekman, Geerlings, Deeg, Smit, Schoevers, de Beurs, Braam, Penninx and van Tilburg2002).
Predictors
Based on current literature (Vink et al. Reference Vink, Aartsen and Schoevers2008) 29 putative predictors of MDD were selected from biological, psychological and social domains of functioning and subdivided into vulnerability and stress related variables according to DSVM.
Among the vulnerability related variables; information on age and gender was derived from the population registries. Level of education was based on the number of years of education (range 5–18 years). We opted for educational level as our socioeconomic status indicator. Educational level has been the best indicator of lifetime socioeconomic status across age and over time and is causally prior to other socioeconomic indicators such as occupational status and income (Crimmins & Saito, Reference Crimmins and Saito2001). The degree of urbanization was assessed by using the classification of Statistics Netherlands, based on the postal codes of The Netherlands and was dichotomized into living in a city (>1000 no. addresses/km2) or rural (<1000 no. addresses/km2) (Den Dulk et al. Reference Den Dulk, Van De Stadt and Vliegen1992). Both psychiatric and familial history of major depression were assessed with the DIS and used as a dichotomized variable (positive/negative). Neuroticism was measured by self-report with a subset of 25-items from the 36-item Dutch Personality Questionnaire (DPQ; Luteijn et al. Reference Luteijn, Starren and Dijk HVan1975). Scale scores range from 0 to 50 points with higher scores indicating a high neuroticism. Neuroticism is a major personality trait characterized by a reduced threshold to experience a broad range of negative emotions and the inability to cope with, including fear, sadness or depression and self-dissatisfaction. High scorers are socially ill at ease and feel they cannot easily relate to other people and are more vulnerable to stress (Steunenberg et al. Reference Steunenberg, Beekman, Deeg and Kerkhof2010). Mastery (locus of control) was measured by self-report with a translated and abbreviated Dutch version of the Pearlin Mastery Scale (PMS; Pearlin & Schooler, Reference Pearlin and Schooler1978). Scale scores range from 5 to 25 points with higher scores indicating a high mastery. The presence of an adverse early childhood event before the age of 6 years was assessed with the DIS and included six items: death of a parent; severe self-disease; physical abuse; (emotional) neglect; sexual abuse; and traumatic war experiences. A dichotomized variable was made indicating the presence or absence of any adverse life event during early childhood. General cognitive functioning was measured by the Mini Mental State Examination (MMSE; Folstein et al. Reference Folstein, Folstein and McHugh1975). Scores range from 0 to 30 points with higher scores indicating better cognitive functioning. The presence of a partner in or outside the household was assessed. The personal network size was defined as the total number of network members with whom the participant had important and regular contact (range 0–75 members) (Knipscheer et al. Reference Knipscheer, Dykstra, van Tilburg and de Jong-Gierveld1998).
Among the stress related variables; the number of chronic diseases in a person was included as an indicator of co-morbid somatic disease since the number of people with particular medical diseases, such as diabetes mellitus, was too low to perform meaningful statistical analyses. The number of chronic diseases was based on self-report, concerning seven major chronic diseases: chronic obstructive pulmonary disease, cardiac disease, stroke, peripheral arterial disease, diabetes mellitus, cancer, and rheumatoid arthritis or osteoarthritis (Kriegsman et al. Reference Kriegsman, Penninx, Van Eijk, Boeke and Deeg1996). The number of functional limitations were assessed with three questions about daily life functioning: to walk up and down a staircase of 15 steps without resting, to cut one's toenails, and to use one's own or public transportation. The number of limitations were summed and ranged from 0 to 3 (Smits et al. Reference Smits, Deeg and Jonker1997). The severity level of depressive symptoms was measured with the CES-D. Anxiety symptoms were measured with a subscale from the Hospital Anxiety and Depression scale (HADS-A; Zigmond & Snaith, Reference Zigmond and Snaith1983) which consists of seven items, resulting in a sum score ranging from 0 to 21 with higher scores indicating more anxiety symptoms. Sleep problems was measured with a three-item questionnaire (Pluijm et al. Reference Pluijm, Tromp, Smit, Deeg and Lips2000); scores were summed to a total (range 3–12 points) with higher scores indicating more sleep problems. Reported pain was measured with a five-item questionnaire based on a subscale from the Nottingham Health Profile (NHP) pain scale (Pluijm et al. Reference Pluijm, Tromp, Smit, Deeg and Lips2000); with total scores ranging from 5 (no pain) to 10 (severe pain). Self-perceived health was assessed by self-report and included as a single question, with a 5-point scale which was dichotomized (Netherlands Central Bureau of Statistics, Reference Netherlands1989). Use of alcohol was included as the standardized number of alcohol units consumed per day, corrected for gender, and classified as a categorical variable with three groups: abstainer (0 units/day), moderate (men, 1–3 units/day; women, 1–2 units/day) and excessive consumption (men: ⩾ 4 units/day, women: ⩾ 3 units/day) (Netherlands Central Bureau of Statistics, Reference Netherlands1989). Smoking was dichotomized (yes/no). Body mass index (BMI) was calculated as measured weight (kg) divided by measured height (m2). The number of recent negative life events, experienced between baseline and follow-up, were adapted from the life-event inventory developed by Tennant & Andrews (Reference Tennant and Andrews1976) consisting of: death or divorce of partner, death of a close relative, death of a grandchild, illness of partner, illness of relative, serious conflict with others, relocation, and being a victim of crime. The exchange of instrumental and emotional support was rated from 0 (never) to 4 (often) (Guiaux et al. Reference Guiaux, Van Tilburg and Van Groenou2007). Loneliness was assessed with the 11-item Loneliness scale (De Jong-Gierveld & Kamphuis, Reference De Jong-Gierveld and Kamphuis1985) with scores ranging from 0 to 11 points with higher scores indicating a higher level of loneliness. All scales were either previously validated in comparable samples in The Netherlands, or in LASA pilot studies (Knipscheer et al. Reference Knipscheer, Deeg and van1993; Huisman et al. Reference Huisman, Poppelaars, van der Horst, Beekman, Brug, van Tilburg and Deeg2011).
Statistical analysis
The incidence rate was calculated as the number of events (MDD) divided by the total time in years that people were at risk in the sample. Cox proportional hazards regression models were conducted as main method for inferential statistics. In order to predict MDD from SUBD, participants who had MDD at follow-up were labelled as ‘cases’. Those that remained chronic SUBD, recovered from SUBD or dropped-out (death or loss to follow-up) were all treated as ‘censored’. In order to predict recovery from SUBD, participants that recovered from SUBD at follow-up were labelled as ‘cases’. Participants that remained chronic SUBD, developed MDD or dropped out of the study were all treated as ‘censored’. Multiple imputation was performed in SPSS with five iterations (relative efficacy >95%) to optimize study power in multivariate analyses (Van Buuren et al. Reference Van Buuren, Boshuizen and Knook1999). There was no marked difference between the original and imputed dataset regarding the means and standard deviations. Predictors with a p ⩽ 0.20 in bivariate analyses were included in multivariate analyses and analyzed through stepwise backward method analyses (p out ⩾ 0.05). According to the TRIPOD statement, backward stepwise selection procedures represent the best modelling procedure to identify the strongest predictors (Moons et al. Reference Moons, Altman, Reitsma, Ioannidis, Macaskill, Steyerberg, Vickers, Ransohoff and Collins2015). The goodness of fit of both models was evaluated with the -2 log likelihood (-2LL) method yielding a χ². We compared the -2LL of the fitted model to the -2LL of the null model (no predictors) and evaluated changes in the -2LL during the process of backward stepwise elimination. Statistical analyses were performed with SPSS v. 22.0 (IBM Corp., USA).
Ethical standards
The authors assert that all procedures contributing to this work comply with the ethical standards of the relevant national and institutional committees on human experimentation and with the Helsinki Declaration of 1975, as revised in 2008.
Results
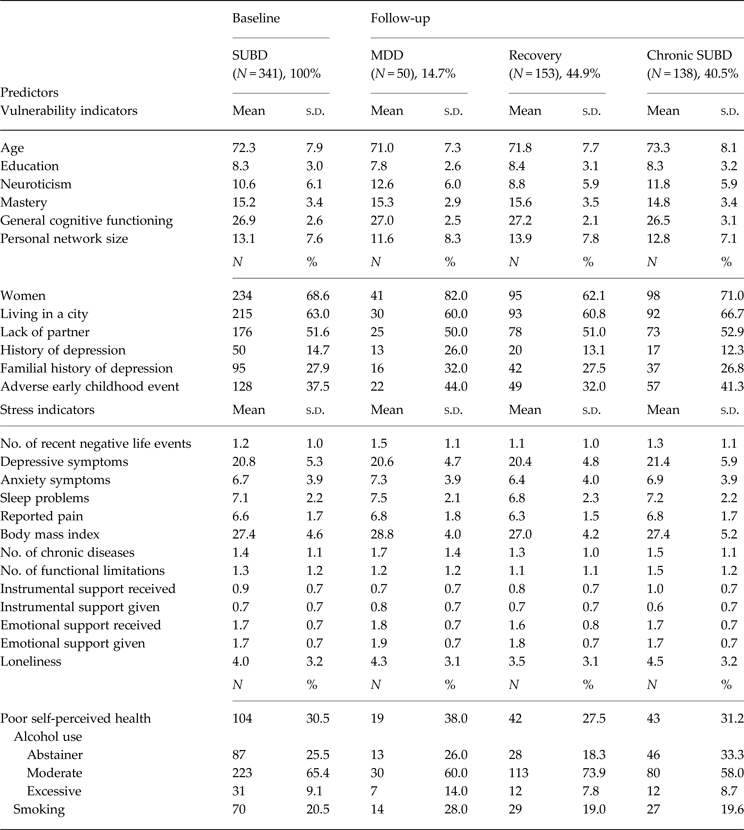
Baseline and follow-up characteristics of the SUBD sample are presented in Table 1. The mean (s.d.) age at baseline was 72.3 (7.9) years. Women predominated and accounted for 68.6%. N = 50 (14.7%) participants had a prior diagnosis of major depression. The median (IQR) follow-up time of the entire study sample was 10.2 (5.5) years. The total number of person-years at risk was 3307.8 person-years.
Sample characteristics of SUBD at baseline and follow-up (N = 341)

SUBD, Subthreshold depression; MDD, major depressive disorder; s.d., standard deviation.
Prognosis of SUBD
The largest proportion recovered from SUBD (N = 153, 44.9%), another substantial part remained chronically SUBD (N = 138, 40.5%), and a minority of people developed MDD (N = 50, 14.7%). From those developing MDD, 26% of respondents reported a previous episode of major depression, 32% reported a positive family history of major depression and 10% reported both. The median (IQR) time to recovery from SUBD was 2.8 (0.3) years. The median (IQR) time to onset of MDD was 5.7 (5.8) years. The incidence rate of MDD from late-life SUBD was 15.1/1000 person-years (95% confidence interval 11.3–19.8).
Predictors of MDD
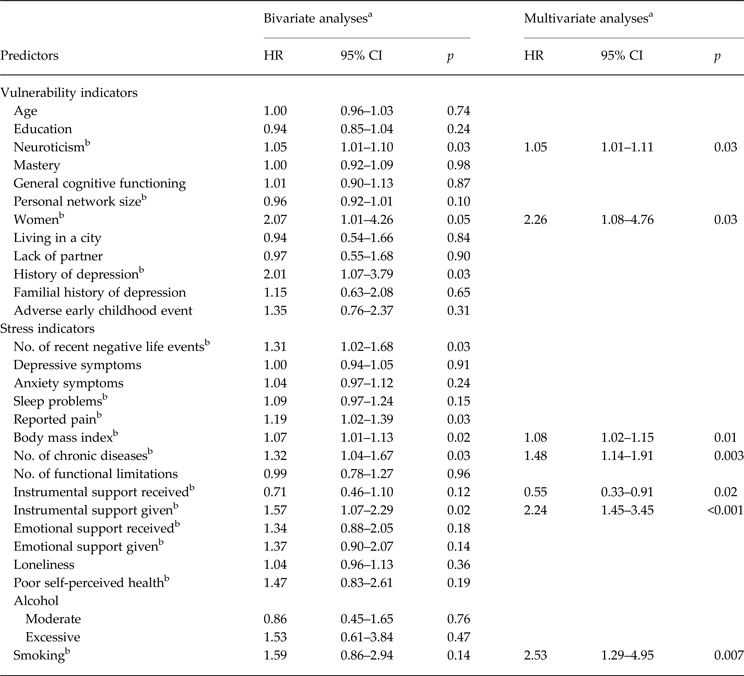
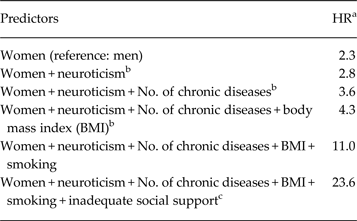
Table 2 gives results of the Cox proportional hazards regression model. Fifteen putative predictors were preselected by bivariate analyses and included in multivariate analyses. In multivariate analyses (goodness of fit: χ2 = 38.064, df = 7, p < 0.001), women, high neuroticism, more chronic diseases, high BMI, smoking and lack of social support remained stable predictors of MDD. These predictors were assessed for their cumulative effects of conversion to MDD. Table 3 shows point estimated hazard ratios (HRs) with up to tenfold increased risks for MDD conversion if predictors were cumulatively added to the Cox regression equation. For example, it demonstrates that vulnerable people with SUBD, such as neurotic women with chronic diseases (HR 3.6), are particularly at risk of converting to MDD in presence of bad lifestyle behaviours, such as smoking and high BMI (HR 11.0), and lack of social support (HR 23.6).
Cox regression models for major depressive disorder from SUBD in later life

SUBD, Subthreshold depression; HR, hazard ratio; CI, confidence interval.
Bold type indicates significance, p < 0.05.
a Cox proportional hazards regression analyses were conducted. Predictors were preselected from bivariate analyses (p in ⩽ 0.20) and included in multivariate stepwise backward analyses (p out ⩾ 0.05).
b Indicates a predictor with a p value ⩽ 0.20 in bivariate analyses.
Point estimated HRs for cumulative predictors of MDD from SUBD

HR, Hazard ratio; MDD, major depressive disorder; SUBD, subthreshold depression.
a We completed the Cox regression equation for cumulative predictors that were gained from multivariate analyses for MDD (Table 2).
b The presence of a continuous predictor was defined as the third quartile value (Q3) of that predictor: Q3 neuroticism = 15; Q3no. of chronic diseases = 2; Q3BMI = 30.
c Inadequate social support was defined as a combination of Q 1 instrumental support received = 0.25 and Q 3 instrumental support given = 1.1.
Predictors of recovery from SUBD
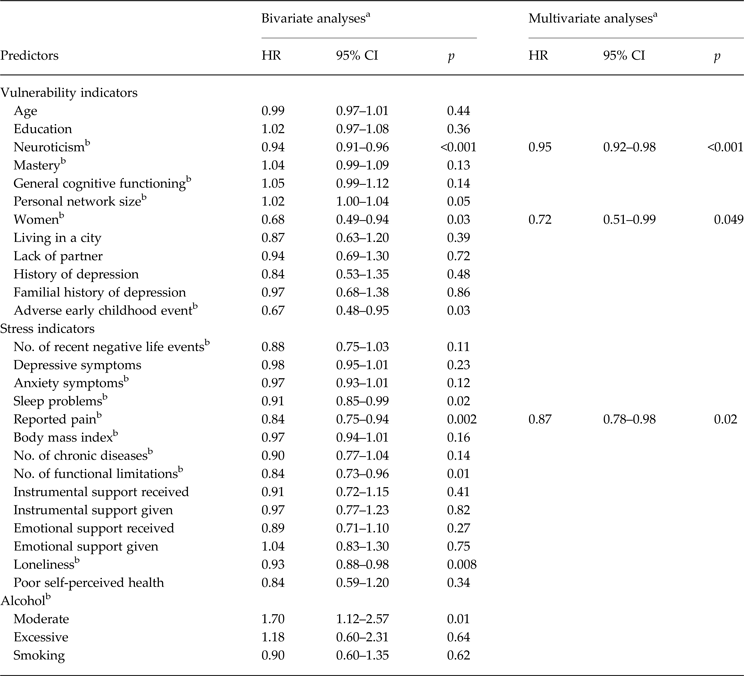
Table 4 gives results of the Cox proportional hazards regression model. Fifteen putative predictors were preselected and included in multivariate analyses (goodness of fit: χ2 = 29.883, df = 3, p < 0.001). Men, low neuroticism, and low levels of pain predicted recovery from SUBD.
Cox regression models for recovery from SUBD in later life

SUBD, subthreshold depression; HR, hazard ratio; CI, confidence interval.
a Cox proportional hazards regression analyses were conducted. Predictors were preselected from bivariate analyses (p in ⩽ 0.20) and included in multivariate stepwise backward analyses (p out ⩾ 0.05).
b Indicates a predictor with a p value ⩽ 0.20 in bivariate analyses.
Additional information
Antidepressants were used at baseline by N = 7 (4.6%) that recovered from SUBD, N = 3 (2.2%) that remained chronically SUBD, and N = 2 (4.0%) that developed MDD. A psychiatrist was consulted for treatment within 6 months before baseline by N = 4 (2.6%) that recovered from SUBD, N = 7 (5.1%) that remained chronically SUBD, and N = 2 (4.0%) that developed MDD.
Discussion
The most important results from our study were that the majority of people with SUBD in later life recovered from SUBD (44.9%) or remained chronically in a state of SUBD (40.5%). A substantial minority of people affected with SUBD subsequently developed MDD (14.7%). However, the found incidence rate of MDD from SUBD in later life (15.1/1000 person-years) is twice the incidence rate of MDD from the general older population (7.0/1000 person-years) (Luijendijk et al. Reference Luijendijk, van den Berg, Dekker, van Tuijl, Otte, Smit, Hofman, Stricker and Tiemeier2008). Despite the fact that our study confirms previous findings that late-life SUBD is an at-risk state for MDD, we had expected more conversions to MDD based on the current literature (8–10% per year) (Meeks et al. Reference Meeks, Vahia, Lavretsky, Kulkarni and Jeste2011). A possible explanation for fewer conversions found in our study may be that 3-year time intervals are insufficient to detect short episodes of MDD, risking an underestimation of the true incidence of MDD, instead of studies that focused on short-term prognosis with more frequent measurements. On the other hand, our research question focused on the long-term follow-up and predictors of long-term outcome. The median onset time at which MDD developed from SUBD in our study was 6 years, suggesting that previous studies with shorter follow-up may likely yield more inaccurate and pessimistic outcomes of SUBD.
Using rich data from a well-characterized longitudinal study of ageing, we were in a unique position to investigate a wide array of risk factors for MDD, representing both vulnerability and stress-related factors. The unrevealed risk factors for MDD from SUBD in this study resemble known risk factors for MDD from the general population, such as being a woman, high neuroticism, more chronic diseases, bad lifestyle behaviours (smoking, high BMI) and lack of social support (Blazer & Hybels, Reference Blazer and Hybels2005; Vink et al. Reference Vink, Aartsen and Schoevers2008). In addition, we showed that people with SUBD in presence of cumulative and largely modifiable predictors were at increased risk of MDD conversion, all important for indicated prevention programmes. For example, vulnerable neurotic women with chronic diseases had an almost sevenfold increased risk of conversion to MDD if modifiable stressors were also present, such as smoking, overweight and lack of social support. Conversely, people who recovered from SUBD may be characterized by lacking vulnerability, such as being a man and having low levels of neuroticism. Moreover, those who recovered reported less pain, suggesting that experiencing pain may be an obstacle for older people with SUBD to recover.
An important clinical implication is that further targeting indicated prevention to people with SUBD in later life at very high risk seems feasible and necessary. Depression in later life is harmful and has been associated with adverse health outcomes, such as disability (Chopra et al. Reference Chopra, Zubritsky, Knott, Have, Hadley, Coyne and Oslin2005), excess mortality (Cuijpers et al. Reference Cuijpers, Vogelzangs, Twisk, Kleiboer, Li and Penninx2013) and an increased risk of dementia (Cherbuin et al. Reference Cherbuin, Kim and Anstey2015). The majority of people with late-life SUBD spontaneously recovers, therefore ‘watchful waiting’ seems adequate in this group, especially in men and people with low neuroticism. Clinicians might also pay attention to pain and its management, as our results suggest that pain may be an obstacle to recover from SUBD. People with SUBD that are at (very) high risk of conversion to MDD may be selected for indicated prevention programs, including low-cost psychological interventions (Van't Veer-Tazelaar et al. Reference Van't Veer-Tazelaar, van Marwijk, van Oppen, van Hout, van der Horst, Cuijpers, Smit and Beekman2009). Furthermore, clinicians should focus their treatments on the adequate management of comorbid chronic diseases, influence bad lifestyle behaviours – stop smoking and increase physical activity to reduce weight – and improve social support if necessary. These recommendations has also been reported by others (Cui et al. Reference Cui, Lyness, Tang, Tu and Conwell2008).
Our study has several strengths. To our knowledge, this is the first study that was able to include up to 17 years follow-up on SUBD. Second, we performed the same two-stage screening procedure to identify those with SUBD and MDD, employing both an established symptom rating scale and diagnostic interview, yielding accurate estimates of the long-term development of SUBD.
An important limitation of our study was the sample size. In particular the number of MDD events was small (N = 50), relative to the number of predictor variables we wanted to analyse. We addressed this limitation by preselecting variables from bivariate analyses and include them in multivariate analyses. This reduced the number of predictor variables from 29 to 15. Multinomial regression analyses were performed as a sensitivity check, because of a small chance that we found some spurious findings (type one error) due to multiple comparisons. We observed that the results of multinomial regression analyses were largely in agreement with those of the Cox regression models, but that only the associations of experiencing pain and received instrumental support were removed from the final model. Furthermore, time to onset of MDD may be potentially overestimated because both MDD could have started earlier and short MDD episodes might have been missed before the past-year diagnostics. In the design of the study we deliberately chose not to investigate risk factors associated with the group that remained chronically SUBD. However, considering the size of the group (40.5%), there might also be an important opportunity here to decrease the overall health burden of depression. More proper research is needed to elucidate the risk factors that are associated with the group that remained chronically SUBD.
In conclusion, SUBD in later life is a highly prevalent and heterogeneous condition. Although older people with SUBD are clearly at risk of developing MDD, the majority did not. Further targeting indicated prevention to those at very high risk is feasible, given the risk factors found. More precise identification of older adults in whom preventative intervention is likely successful reduces both costs and the numbers of older people exposed to intervention, while simultaneously improving the number needed to treat in preventative psychiatry.
Acknowledgements
We thank participants and interviewers of the LASA study. The Longitudinal Aging Study Amsterdam is financed primarily by The Netherlands Ministry of Health, Welfare and Sports.
Declaration of Interest
None.