





Dementia is a life-limiting condition characterised by complex care needs. It is the leading cause of death in the UK, 1 with the number living and dying with dementia expected to increase in the coming years. Adapting the healthcare system to be efficient and providing high-quality care to everyone with dementia from diagnosis until the end of life are public health priorities. Reference Parker and Baker2 People with dementia tend to use more healthcare services, including unplanned hospital use, compared with the general population. Reference Voss, Brandling, Taylor, Black, Buswell and Cheston3,Reference Watson, Green, Giebel, Darlington-Pollock and Akpan4 However, there is considerable variability in healthcare needs and use among people with dementia, influenced by biological, social and environmental factors Reference Murtagh, Bausewein, Petkova, Sleeman, Dodd and Gysels5 (e.g., dementia type, Reference Williamson, Leniz, Chukwusa, Evans and Sleeman6 comorbidities, Reference Mondor, Maxwell, Hogan, Bronskill, Gruneir and Lane7 age, gender Reference Leniz, Higginson, Stewart and Sleeman8 and the availability and accessibility of appropriate services). Reference Williamson, Leniz, Chukwusa, Evans and Sleeman6,Reference Frost, Walters, Aw, Brunskill, Wilcock and Robinson9 To understand variations in healthcare use and care quality among people with dementia, prior studies have considered quality indicators such as the frequency of dementia reviews, out-patient visits, the incidence of unplanned hospital admissions and the location of death. Reference Yorganci, Stewart, Sampson and Sleeman10–Reference Connolly, Iliffe, Gaehl, Campbell, Drake and Morris12 However, exploring patterns and costs of care in people with dementia has mostly focused on people who were newly diagnosed or limited to a single service. Reference Beeber, Thorpe and Clipp13–Reference Blumenthal and Abrams15 The number and type of services accessed concurrently and how healthcare use changes from diagnosis to the end of life remain unknown. Patterns and determinants of social care use and end-of-life care outcomes have been examined elsewhere. Reference Teggi16
The period following a dementia diagnosis and the last year of life have been identified as critical points for improving care. Reference Sivananthan and McGrail17,Reference Gungabissoon, Perera, Galwey and Stewart18 The period following diagnosis offers opportunities for a holistic needs assessment, care planning and preventative interventions. Reference Williamson, Sleeman and Evans19 During the last year of life, many people with dementia experience frequent unplanned healthcare use, Reference Yorganci, Stewart, Sampson and Sleeman10 which may be of limited benefit, burdensome for individuals and costly. Reference Yorganci, Sampson, Gillam, Aworinde, Leniz and Williamson11,Reference Leniz, Evans, Yi, Bone, Higginson and Sleeman20 People with dementia face barriers to receiving optimal care and access to specialist services. Reference Williamson, Sleeman and Evans19,Reference Sampson, Candy, Davis, Gola, Harrington and King21 The development of effective interventions for people with dementia to reduce hospital use and improve access to appropriate services requires knowledge of who may be most at risk. Reference Phelan, Debnam, Anderson and Owens22 Understanding how patterns of healthcare use vary from diagnosis to death could help inform service planning.
This study aimed to (a) identify subgroups within a large sample of people with dementia, characterised by healthcare use in the year after diagnosis and the last year of life, (b) describe biopsychosocial factors associated with service use subgroups and (c) explore moves between subgroups over time.
Method
Study design
This was a retrospective cohort study assembled using a linkage between a clinical data-set (South London and Maudsley National Health Service (NHS) Foundation Trust Biomedical Research Centre’s (SLaM BRC) Clinical Record Interactive Search (CRIS)) and administrative data-sets (Hospital Episode Statistics (HES) data-sets, Office for National Statistics (ONS) death registry) (Supplementary Fig. 1).
CRIS provides research access to a repository of anonymised data from electronic health records within SLaM. Reference Perera, Broadbent, Callard, Chang, Downs and Dutta23 SLaM provides mental healthcare services, including dementia assessment and management, to 1.2 million residents in four London boroughs in the UK. Generally, in the UK, people who are suspected to have dementia are identified in primary care and then referred to a specialist dementia diagnostic service, Reference Davis, Mueller, Ashworth, Broadbent, Jewell and Molokhia24 which provides a formal dementia diagnosis.
Cohort
The cohort was extracted from SLaM. All dementia diagnoses recorded in CRIS were determined from structured fields of International Classification of Diseases, 10th Revision (ICD-10) diagnosis codes (F00x–03x). The sample included people who were diagnosed with dementia at age 50 or older, between 2006 and 31 March 2020, and died. We included those lived for at least 2 years after receiving their dementia diagnosis to ensure at least 1 year of follow-up for each time period.
Indicators of latent classes
We quantified healthcare use based on:
-
(a) number of unplanned hospital admissions
-
(b) number of planned hospital admissions
-
(c) combined duration of hospital in-patient episodes
-
(d) number of accident and emergency (A&E) attendances
-
(e) number of out-patient appointments
-
(f) number of community mental health nurse visits
-
(g) number of community mental health allied health professionals (therapists) visits
-
(h) number of other face-to-face mental healthcare appointments.
These variables were used as the latent class indicators (Supplementary Table 2). Each indicator was measured over two time periods: within 1 year following the first recorded dementia diagnosis date and 1 year before death.
Biopsychosocial characteristics associated with latent classes
We considered a range of sociodemographic, environmental and disease-related factors based on their reported associations with healthcare use in people with dementia and models of healthcare use. Reference Murtagh, Bausewein, Petkova, Sleeman, Dodd and Gysels5,Reference Leniz, Higginson, Stewart and Sleeman8 These included age, sex, ethnicity, neighbourhood-level socioeconomic status estimated using the Index of Multiple Deprivation (IMD), 25 dementia type, dementia severity (Mini-Mental State Examination (MMSE) Reference Folstein, Folstein and McHugh26 ); the Health of the Nation Outcome Scales (HoNOS) Reference Burns, Beevor, Lelliott, Wing, Blakey and Orrell27 (a clinical outcome measure used routinely in English mental healthcare); receiving a care package or a general social care intervention; the number of medications with strong anticholinergic effects; Reference Bishara, Harwood, Sauer and Taylor28 and living alone (Supplementary Material 3). We also extracted the place of death from HES, categorised as died in hospital/died elsewhere.
Statistical analyses
We described the cohort using summary statistics (frequencies for categorical variables; means and standard deviations (s.d.s) for continuous variables). We used latent class analysis (LCA) to identify subgroups based on healthcare use measures separately in the year following diagnosis and the last year of life. For a clear interpretation of which indicators are above or below the sample means, we used the z-standardised mean scores in figures for healthcare use indicators. Reference Spurk, Hirschi, Wang, Valero and Kauffeld29 We tested associations between subgroup membership and each biopsychosocial characteristic using multinomial logistic regression models, adjusted for age and sex. We reported coefficients from the regression models as relative risk ratios (RRRs) accompanied by 95% CIs. In line with recommendations, Reference White, Royston and Wood30 multiple imputation, with 20 sets, was used in models for the HoNOS cognitive problems, HoNOS physical problems, ethnicity and IMD variables, proportionate to missing (1.9%–4.9%). Complete case analyses for the year after diagnosis and the last year of life subgroups were conducted as a sensitivity analysis (Supplementary Material 4).
Finally, we used latent transition analysis (LTA) to consider changes in healthcare use over time (Supplementary Material 5 for additional methods). We considered estimated latent class models with between one and six classes. The final model was chosen based on fit indices and based on clinical interpretability. Data preparation, descriptive analyses and multinomial regression models were undertaken in Stata 16 for Windows (StataCorp, College Station, Texas, USA; https://www.stata.com/stata16/ ). Latent variable modelling was undertaken in Mplus 8 for Windows (Muthén & Muthén, Los Angeles, California, USA; https://www.statmodel.com/).
Patient and public involvement
Patients and public representatives were long-standing collaborators. This study Reference Yorgancı31 is part of the Empowering Better End of Life Dementia Care (EMBED-Care) research programme, which was developed and designed with people with dementia and their family carers. The lead researcher (EY) met with patient and public representative groups with different experiences (e.g., SLaM users, end-of-life care experiences) to discuss the study.
Results
From the initial extraction of information for 14 469 decedents diagnosed with dementia, we excluded 5846 who were diagnosed with dementia for less than 2 years. Excluded individuals tended to be diagnosed with dementia at an older age (84.4 (s.d. 7.5) v. 81.5 (s.d. 7.7), p < 0.001) and have a higher proportion of people with vascular dementia (23.4% v. 18.8%, p < 0.001).
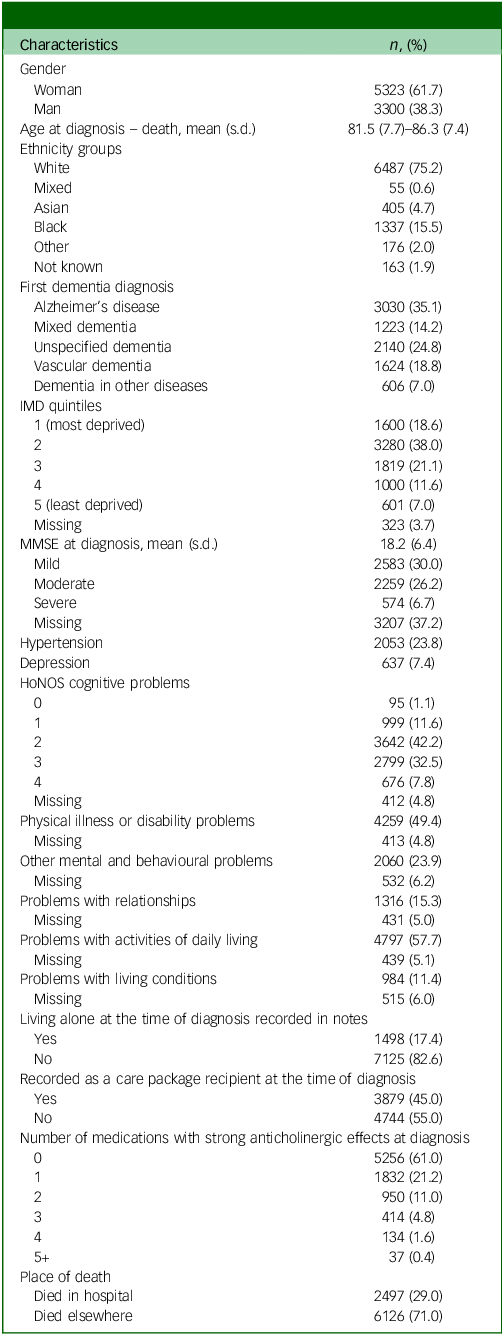
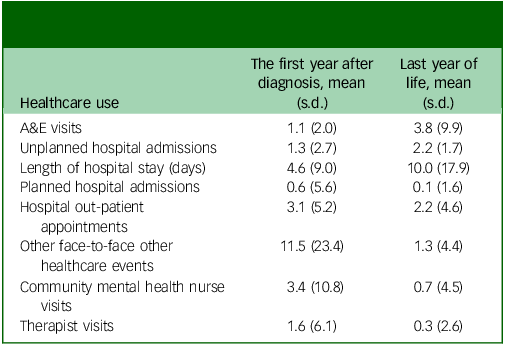
The analytical sample comprised 8623 individuals with dementia, summarised in Tables 1 and 2. The majority were female (61.7%) and reported White ethnicity (75.2%). Around one-third (35.1%) had Alzheimer’s disease as their primary dementia diagnosis. Healthcare service use differed between the year after diagnosis and the last year of life. Compared with the last year of life, during the year after diagnosis, participants had higher use of specialist mental healthcare, higher planned hospital use, lower unplanned hospital use and shorter combined hospital stays.
Sample characteristics (N = 8623)

Table 1 Long description
A table summarizing characteristics of individuals with dementia. The table has 30 rows and 2 columns. The first column lists various characteristics and the second column provides corresponding percentages or values. Row 1: Gender, Woman, 5323 (61.7 percent). Row 2: Gender, Man, 3300 (38.3 percent). Row 3: Age at diagnosis - death, 81.5 (7.7-86.3 (7.4)). Row 4: Ethnicity groups, White, 6487 (75.2 percent). Row 5: Ethnicity groups, Mixed, 55 (0.6 percent). Row 6: Ethnicity groups, Asian, 405 (4.7 percent). Row 7: Ethnicity groups, Black, 1337 (15.5 percent). Row 8: Ethnicity groups, Other, 176 (2.0 percent). Row 9: Ethnicity groups, Not known, 163 (1.9 percent). Row 10: First dementia diagnosis, Alzheimer’s disease, 3030 (35.1 percent). Row 11: First dementia diagnosis, Mixed dementia, 1223 (14.2 percent). Row 12: First dementia diagnosis, Unspecified dementia, 2140 (24.8 percent). Row 13: First dementia diagnosis, Vascular dementia, 1624 (18.8 percent). Row 14: First dementia diagnosis, Dementia in other diseases, 606 (7.0 percent). Row 15: IMD quintiles, 1 (Most deprived), 1600 (18.6 percent). Row 16: IMD quintiles, 2, 3280 (38.0 percent). Row 17: IMD quintiles, 3, 1819 (21.1 percent). Row 18: IMD quintiles, 4, 1000 (11.6 percent). Row 19: IMD quintiles, 5 (Least deprived), 601 (7.0 percent). Row 20: IMD quintiles, Missing, 323 (3.7 percent). Row 21: MMSE at diagnosis mean (s.d), Mild, 2583 (30.0 percent). Row 22: MMSE at diagnosis mean (s.d), Moderate, 2259 (26.2 percent). Row 23: MMSE at diagnosis mean (s.d), Severe, 574 (6.7 percent). Row 24: MMSE at diagnosis mean (s.d), Missing, 3207 (37.2 percent). Row 25: Hypertension, 2053 (23.8 percent). Row 26: Depression, 637 (7.4 percent). Row 27: HoNOS cognitive problems, 0, 95 (1.1 percent). Row 28: HoNOS cognitive problems, 1, 999 (11.6 percent). Row 29: HoNOS cognitive problems, 2, 3642 (42.2 percent). Row 30: HoNOS cognitive problems, 3, 2799 (32.5 percent).
MMSE, mini-mental state examination; IMD, index of multiple deprivation. HoNOS scores were dichotomised (scores 0 and 1 – no or minor problems, scores 2 to 4 – mild to severe problems) to facilitate interpretation.
Healthcare use of people with dementia in the first year after diagnosis and the last year of life (N = 8,623)

Table 2 Long description
A table comparing healthcare use of people with dementia in the first year after diagnosis and the last year of life. The table has 8 rows and 3 columns. The columns are labeled ‘The first year after diagnosis’, ‘Last year of life’, and the row labels are ‘A&E visits’, ‘Unplanned hospital admissions’, ‘Length of hospital stay (days)’, ‘Planned hospital admissions’, ‘Hospital outpatient appointments’, ‘Other face-to-face other healthcare events’, ‘Community mental health nurse visits’, and ‘Therapist visits’. Row 1: A&E visits, 1.1 (2.0), 3.8 (9.9). Row 2: Unplanned hospital admissions, 1.3 (2.7), 2.2 (1.7). Row 3: Length of hospital stay (days), 4.6 (9.0), 10.0 (17.9). Row 4: Planned hospital admissions, 0.6 (5.6), 0.1 (1.6). Row 5: Hospital outpatient appointments, 3.1 (5.2), 2.2 (4.6). Row 6: Other face-to-face other healthcare events, 11.5 (23.4), 1.3 (4.4). Row 7: Community mental health nurse visits, 3.4 (10.8), 0.7 (4.5). Row 8: Therapist visits, 1.6 (6.1), 0.3 (2.6).
A&E, accident and emergency.
Subgroups of healthcare use in the year after dementia diagnosis
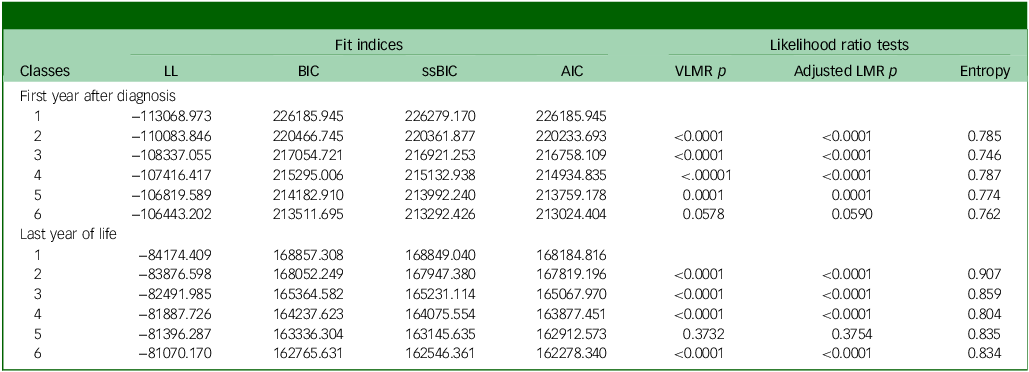
For the year after diagnosis, a three-class model gave the optimal model fit (Table 3) and clinical interpretability. Posterior probabilities for class membership ranged between 81 and 95%.
Fit indices for latent class models with 1–6 classes (N = 8623)

Table 3 Long description
A table comparing fit indices for latent class models with 1-6 classes. The table has 12 rows and 10 columns. The columns are labeled LL, BIC, ssBIC, AIC, VLMR p, Adjusted LMR p, and Entropy. The rows are grouped into two sections: First year after diagnosis and Last year of life. Each section contains data for 1-6 classes. Row 1: First year after diagnosis, 1, -113068.973, 226185.945, 226279.170, 226185.945,, , , 0.785. Row 2: First year after diagnosis, 2, -110083.846, 220466.745, 220361.877, 220233.693, <0.0001, <0.0001, <0.0001, 0.785. Row 3: First year after diagnosis, 3, -108337.055, 217054.721, 216921.253, 216758.109, <0.0001, <0.0001, <0.0001, 0.787. Row 4: First year after diagnosis, 4, -107416.417, 215295.006, 215132.938, 214934.835, <0.0001, <0.0001, <0.0001, 0.787. Row 5: First year after diagnosis, 5, -106819.589, 214182.910, 213992.240, 213759.178, 0.0001, 0.0001, 0.0001, 0.774. Row 6: First year after diagnosis, 6, -106443.202, 213511.695, 213292.426, 213024.404, 0.0578, 0.0590,, 0.762. Row 7: Last year of life, 1, -84174.409, 168857.308, 168849.040, 168184.816,, , , 0.907. Row 8: Last year of life, 2, -83876.598, 168052.249, 167947.380, 167819.196, <0.0001, <0.0001, <0.0001, 0.907. Row 9: Last year of life, 3, -82491.985, 165364.582, 165231.114, 165067.970, <0.0001, <0.0001, <0.0001, 0.859. Row 10: Last year of life, 4, -81887.726, 164237.623, 164075.554, 163877.451, <0.0001, <0.0001, <0.0001, 0.804. Row 11: Last year of life, 5, -81396.287, 163336.304, 163145.635, 162912.573, 0.3732, 0.3754,, 0.835. Row 12: Last year of life, 6, -81070.170, 162765.631, 162546.361, 162278.340, <0.0001, <0.0001, <0.0001, 0.834.
LL, log-likelihood; BIC, Bayesian information criterion; ssBIC, sample size adjusted BIC; AIC, Akaike information criterion; VLMR, Vuong-Lo-Mendell-Rubin; LMR, Lo-Mendell-Rubin.
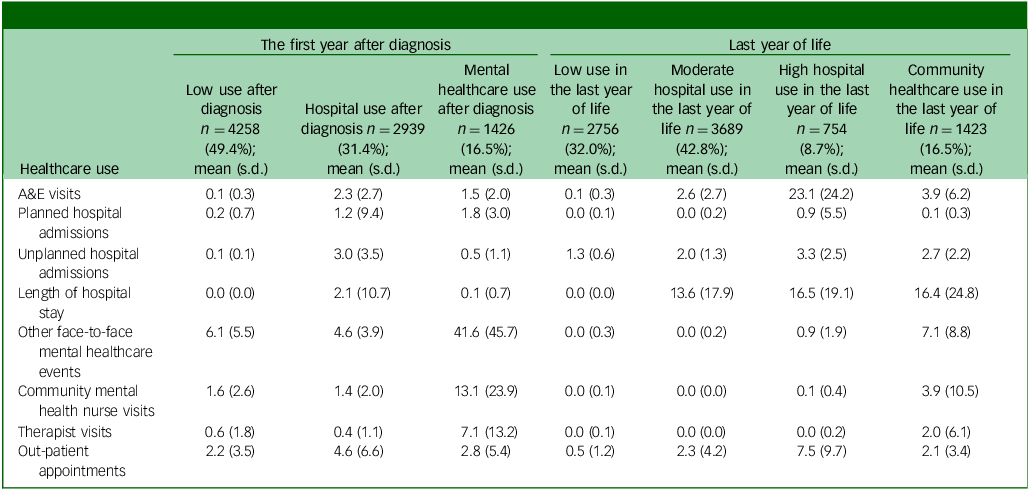
Figure 1 is a radar plot visualising healthcare service use across eight domains (latent class indicators) for three subgroups, each in a different colour. For each axis, distance from the centre reflects the average level of use of that service in the year after dementia diagnosis; larger spikes indicate higher use and points near the centre indicate low use. The subgroups were as follows (Tables 4 and 5; Supplementary Material 5 for the descriptive table).
Radar plot showing healthcare use subgroups of people with dementia in the year after diagnosis.

Fig. 1 Long description
The radar plot displays healthcare use among people with dementia in the year after diagnosis. It includes three subgroups: low use after diagnosis, hospital use after diagnosis, and mental healthcare use after diagnosis. The axes represent different types of healthcare use, including accidents and emergency visits, unplanned hospital admissions, planned hospital admissions, length of hospital stay, outpatient appointments, community mental health nurse home visits, therapist home visits, and other face-to-face mental healthcare events. Each subgroup is represented by a different colored line: blue for low use, red for hospital use, and green for mental healthcare use. The plot shows variations in healthcare use among the subgroups, with hospital use after diagnosis having the highest values in several categories.
Healthcare use of people with dementia in the first year after diagnosis and the last year of life (n = 8623)

Table 4 Long description
The table presents data on healthcare service use across various periods and subgroups. It has 8 columns and 7 rows, including headers and row labels. The columns are: Mean (s.d.), Low use after diagnosis (n = 4258), Hospital use after diagnosis (n = 2399), Mental healthcare use after diagnosis (n = 1426), Low use in the last year of life (n = 2756), Moderate hospital use in the last year of life (n = 3689), High hospital use in the last year of life (n = 754), and Community healthcare use in the last year of life (n = 1423). The rows include: A&E visits, Planned hospital admissions, Unplanned hospital admissions, Length of hospital stay, Other face-to-face mental healthcare, Community mental health nurse visits, Therapist visits, Outpatient appointments. Each cell contains numerical values representing the mean and standard deviation of healthcare service use. Notable trends include varying levels of healthcare use across different periods and subgroups, with some subgroups showing higher use in specific categories.
A&E, accident and emergency.
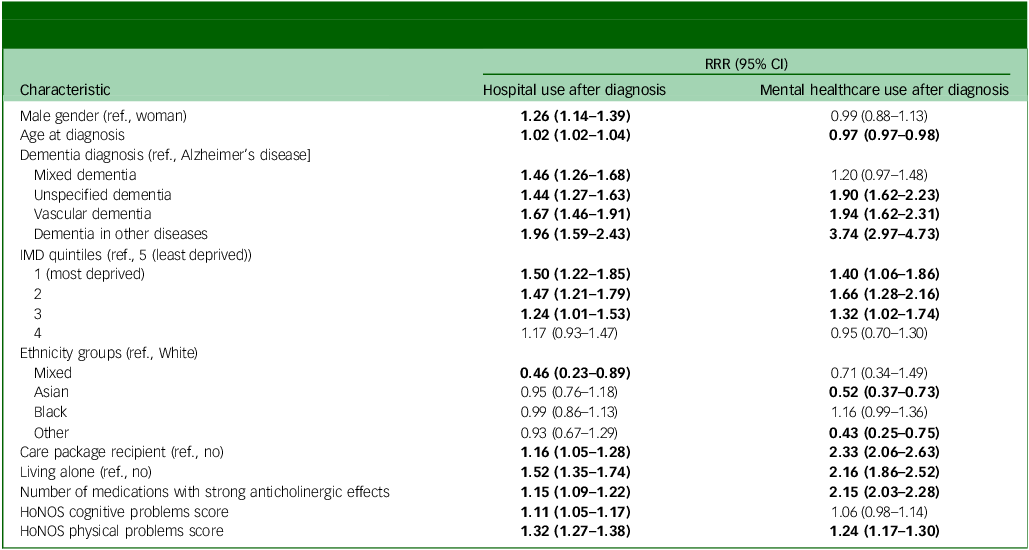
Multinomial logistic regression with mutually adjusted coefficients showing patient characteristics associated with the year after diagnosis subgroups

Table 5 Long description
A table with 21 rows and 3 columns. The columns are labeled ‘Characteristic’, ‘Hospital use after diagnosis’, and ‘Mental healthcare use after diagnosis’. The table presents relative risk ratios (RRR) with 95% confidence intervals (CI) for various patient characteristics associated with healthcare use after dementia diagnosis. Row 1: Male gender (ref, woman), 1.26 (1.14–1.39), 0.99 (0.88–1.13). Row 2: Age at diagnosis, 1.02 (1.02–1.04), 0.97 (0.97–0.98). Row 3: Mixed dementia, 1.46 (1.26–1.68), 1.20 (0.97–1.48). Row 4: Unspecified dementia, 1.44 (1.27–1.63), 1.90 (1.62–2.23). Row 5: Vascular dementia, 1.67 (1.46–1.91), 1.94 (1.62–2.31). Row 6: Dementia in other diseases, 1.96 (1.59–2.43), 3.74 (2.97–4.73). Row 7: IMD quintiles (ref, 5 (least deprived)), 1.50 (1.22–1.85), 1.40 (1.06–1.86). Row 8: 2, 1.47 (1.21–1.79), 1.66 (1.28–2.16). Row 9: 3, 1.24 (1.01–1.53), 1.32 (1.02–1.74). Row 10: 4, 1.17 (0.93–1.47), 0.95 (0.70–1.30). Row 11: Ethnicity groups (ref, White), Mixed, 0.46 (0.23–0.89), 0.71 (0.34–1.49). Row 12: Asian, 0.95 (0.76–1.18), 0.52 (0.37–0.73). Row 13: Black, 0.99 (0.86–1.13), 1.16 (0.99–1.36). Row 14: Other, 0.93 (0.67–1.29), 0.43 (0.25–0.75). Row 15: Care package recipient (ref, no), 1.16 (1.05–1.28), 2.33 (2.06–2.63). Row 16: Living alone (ref, no), 1.52 (1.35–1.74), 2.16 (1.86–2.52). Row 17: Number of medications with strong anticholinergic effects, 1.15 (1.09–1.22), 2.15 (2.03–2.28). Row 18: HoNOS cognitive problems score, 1.11 (1.05–1.17), 1.06 (0.98–1.14). Row 19: HoNOS physical problems score, 1.32 (1.27–1.38), 1.24 (1.17–1.30).
Reference class: Class 1: Low use after diagnosis (N = 8623). RRR (95% CI), relative risk ratio (95% CI); ref., reference class; IMD, index of multiple deprivation; HoNOS, Health of the Nation Outcome Scales. Bold findings are statistically significant (p < 0.005).
Low use after diagnosis (n = 4258, 49%): characterised by very low unplanned hospital use (mean 0.1, s.d. (0.1, unplanned hospital admissions) and community mental healthcare use (community mental health nurse visits, mean 1.6, s.d. 2.6); interactions with healthcare mainly through face-to-face SLaM (mean 6.1, s.d. 5.5) and out-patient appointments (mean 2.2, s.d. 3.5); a higher proportion of people diagnosed with Alzheimer’s disease and a younger age.
Hospital use after diagnosis (n = 2939, 34%): characterised by a high number of unplanned hospital visits, including A&E visits and unplanned hospital admissions (mean 3.0, s.d. 3.5). Compared with the ‘low use after diagnosis’ group, people in this group are more likely to have any other dementia diagnosis than Alzheimer’s disease, less likely to be from a Mixed (RRR 0.46 95% CI (0.23–0.89)) ethnicity, more likely to be diagnosed at an older age (1.02 (1.02–1.04)) with more physical impairments (1.32 (1.27–1.38)). They are more likely to be male (1.26 (1.14–1.39)), living alone (1.52 (1.35–1.74)) and prescribed a higher number of medications with strong anticholinergic effects (1.15 (1.09–1.22)). A gradient effect was observed between the area-level deprivation (IMD) of where people lived and likelihood of group membership, where people from the most deprived areas were more likely to be in this subgroup compared with those who lived in the least deprived areas (IMD 5 versus IMD 1: 1.50 (1.22–1.85)).
Mental healthcare use after diagnosis (n = 1426, 17%): characterised by frequent contact with mental healthcare services (e.g., community mental health nurse visits mean 13.1, s.d. 23.9) and moderate hospital use (e.g., planned hospital admissions mean 1.8, s.d. 3.0). Compared with the ‘low use after diagnosis’ group, they are more likely to be diagnosed with vascular dementia (RRR 1.90 95% CI (1.62–2.23)), unspecified dementia (1.94 (1.62–2.31)) and dementia in other diseases (3.74 (2.97–4.73)). They are less likely to be from Asian (RRR 0.52, 95% CI (0.37–0.73)) or other ethnicities (0.43 (0.25–0.75)). They are more likely be receiving a social care package (2.33 (2.06–2.63)), living alone (2.16 (1.86–2.52)), receiving a higher number of medications with strong anticholinergic effects (2.15 (2.03–2.28)) and experiencing physical problems (1.24 (1.17–1.30). People who lived in the most deprived three IMD quintiles were more likely to be in this subgroup (IMD 5 versus IMD 1: 1.40 (1.06–1.86)).
Subgroups of healthcare use in the last year of life
For the last year of life, the model structure, response probabilities and class prevalence were not similar to those identified for the year after diagnosis. The model fit criteria and discussion within the clinical and research teams indicated that a four-class model fit most appropriately for the last year of life healthcare use (Table 3). Posterior probabilities for class membership ranged between 79 and 94%. The ‘low healthcare use’ subgroup was taken as the base for the regression analysis.
Figure 2 is a radar plot visualising the healthcare service use across eight domains (latent class indicators) for three subgroups, each in a different colour. For each axis, distance from the centre reflects the average level of use of that service in the last year of life; larger spikes indicate higher use and points near the centre indicate low use. The last year of life subgroups were as follows (Tables 4 and 6; Supplementary Material 5 for the descriptive table).
Radar plot showing healthcare use subgroups of people with dementia in the last year of life.

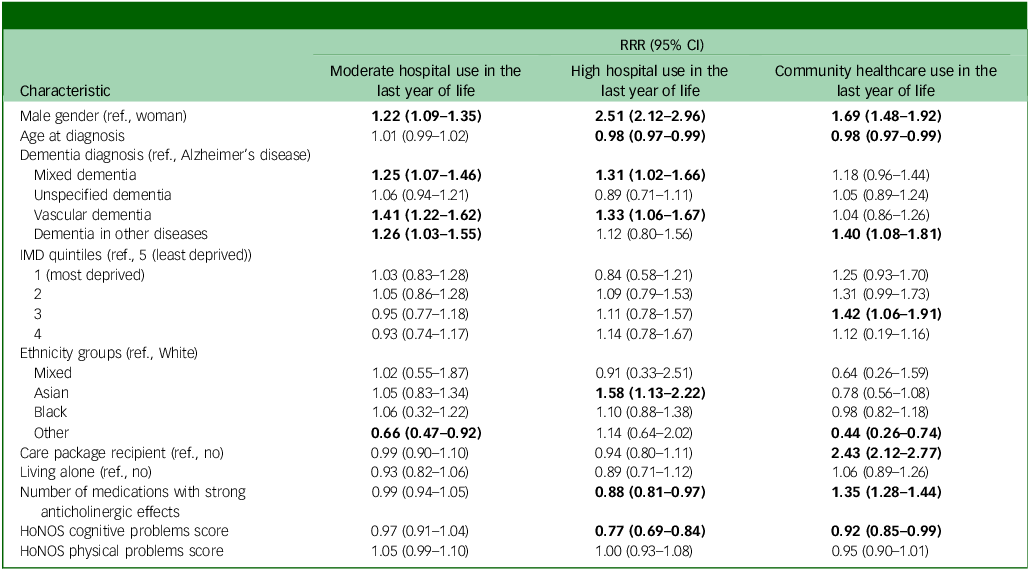
Patient characteristics associated with the last year of life class

Table 6 Long description
A table with 20 rows and 10 columns comparing patient characteristics with healthcare use in the last year of life. The columns are labeled: Characteristic, Moderate hospital use in the last year of life, High hospital use in the last year of life, and Community healthcare use in the last year of life. The rows are labeled with various characteristics such as Male gender, Age at diagnosis, Dementia diagnosis, IMD quintiles, Ethnicity groups, Care package recipient, Living alone, Number of medications with strong anticholinergic effects, HoNOS cognitive problems score, and HoNOS physical problems score. Each row provides relative risk ratios (RRR) with 95% confidence intervals (CI) for different levels of healthcare use. For example, Row 1: Male gender, 1.22 (1.09-1.35), 2.51 (2.12-2.96), 1.69 (1.48-1.92). Row 2: Age at diagnosis, 1.01 (0.99-1.02), 0.98 (0.97-0.99), 0.98 (0.97-0.99).
Reference class: Class 1: Low use in the last year of life (N = 8623). RRR (95% CI), relative risk ratio (95% CI); ref., reference class; IMD, index of multiple deprivation; HoNOS, Health of the Nation Outcome Scales. Bold findings are statistically significant (p < 0.005).
Low use in the last year of life (n = 2756, 32%): characterised by low contact with hospital (A&E visits mean 0.1, s.d. 0.3) and mental healthcare services (face-to-face mental healthcare events mean 0.0, s.d. 0.3). Almost everyone (99%) in this group died outside of a hospital.
Moderate hospital use in the last year of life (n = 3689, 43%): characterised by low mental healthcare use (e.g. other face-to-face mental healthcare events mean 0.0, s.d. 0.2), but moderate unplanned hospital use (e.g. unplanned hospital admissions mean 2.0, s.d. 1.3), in addition to moderate out-patient appointments. Compared with those in the ‘low use in the last year of life’ group, membership of this group was associated with male gender (RRR 1.22, 95% CI (1.09–1.35)), mixed dementia (1.25 (1.07–1.46)), vascular dementia (1.41 (1.22 –1.62)) and dementia in other diseases (1.26 (1.03–1.55)). Forty-one per cent of people in this group died in a hospital.
High hospital use in the last year of life (n = 754, 9%): characterised by high hospital use, a very high number of A&E visits and higher unplanned and planned hospital admissions compared with the other groups. Compared with those in the ‘low use in the last year of life’ group, people in this subgroup are more likely to be men (2.51 (2.12–2.96)) and diagnosed at a younger age (0.98 (0.97–0.99)). They are more likely to have a mixed (1.31 (1.02–1.66)) or a vascular dementia diagnosis (1.33 (1.06–1.67)). They are more likely to be of Asian ethnicity (1.58 (1.13–2.22)). They are less likely to receive medications with strong anticholinergic effects (0.88 (0.81–0.97)) and less severe cognitive problems at diagnosis (0.77 (0.69–0.84)). Half (51%) of people in this group died in a hospital.
Community healthcare use in the last year of life (n = 1423, 17%): characterised by higher use of mental healthcare services while having moderate use of hospital services. Compared with those in the ‘low use in the last year of life’ group, people in this subgroup are more likely to be men (RRR 1.69, 95% CI (1.48–1.92)) and diagnosed at a younger age (0.98 (0.97–0.99)). They are more likely to have dementia in another disease (1.40 (1.08–1.81)). They are likely to be receiving a care package (2.43 (2.12–2.77)), more likely to be receiving more medications with strong anticholinergic effects (1.35 (1.28–1.44)) but have less severe cognitive problems (0.92 (0.85–0.99)) and less severe physical problems (RRR 0.92 95%CI (0.96–0.98)). Two in five (40%) of people in this group died in a hospital.
Transitions between subgroups over time
Transitions between the subgroups between two periods are visualised in Fig. 3. There were no clear patterns to the moves between subgroups between the two time periods (e.g. of those in the ‘low use after diagnosis’ subgroup, 33% transitioned to the ‘low use in the last year of life’, 40% to the ‘moderate hospital use in the last year of life’, 11% to the ‘high hospital use in the last year of life’, and 16% to the ‘community healthcare use in the last year of life’).
Sankey diagram for describing the transitions between the distinct subgroups observed in the year after diagnosis and the subgroups observed in the last year of life. The percentages given in the figure refer to the percentages of people with dementia who transitioned from that year after diagnosis subgroup to the last year of life subgroup where each line terminates (e.g. 33% transitioned from low use after diagnosis to low use in the last year of life subgroup).

Fig. 3 Long description
A Sankey diagram representing transitions between distinct subgroups of healthcare use among people with dementia. The diagram includes three sets: Low use after diagnosis, Hospital use after diagnosis, and Mental healthcare use after diagnosis, each transitioning to four subgroups in the last year of life: Low use, Moderate hospital use, High hospital use, and Community healthcare use. Each set is represented by colored bands that flow into the corresponding subgroups in the last year of life. The percentages indicate the proportion of people transitioning from one subgroup to another. For example, 33 percent transitioned from low use after diagnosis to low use in the last year of life, while 31 percent moved from hospital use after diagnosis to moderate hospital use in the last year of life. The diagram highlights the variability in healthcare use patterns among people with dementia over time.
Notable transitions between two time periods relevant to clinical practice and policy are described below (Supplementary Material 6 for relevant tables).
The transition from ‘low use after diagnosis’ subgroup to ‘high hospital use in the last year of life’ subgroup: 11% of people with dementia who were in the ‘low use after diagnosis’ subgroup transitioned to the ‘high hospital use in the last year of life’. Compared with the other people who were in the ‘low use after diagnosis’, the group of people who experienced this transition included a larger proportion of males, a smaller proportion of people with an Alzheimer’s disease diagnosis and a larger proportion of people with mixed and vascular dementia diagnoses. They were diagnosed at a younger age and died at a younger age compared with those who transitioned to the ‘low use in the last year of life’ and ‘moderate healthcare use in the last year of life’ subgroups, and a smaller proportion had a care package in place in the year after their diagnosis.
Transition from the ‘hospital use after diagnosis’ subgroup to the ‘low use in the last year of life’ subgroup: 31% of the people with dementia who were in the ‘hospital use after diagnosis’ subgroup transitioned to the ‘low use in the last year of life’ subgroup. Compared with the other people who were in the ‘hospital use after diagnosis’ subgroup, the group of people who experienced this included a larger proportion of females, a larger proportion of people with an Alzheimer’s disease diagnosis, a larger proportion of people who were White and were diagnosed at an older age, yet lived with a dementia diagnosis for a longer time and died at an older age.
Transition from the ‘mental healthcare use after diagnosis’ subgroup to the ‘community healthcare use in the last year of life’ subgroup: 31% of the people with dementia who were in the ‘mental healthcare use after diagnosis’ subgroup transitioned to the ‘community healthcare use in the last year of life’ subgroup. Compared with the other people who were in the ‘mental healthcare use after diagnosis’ subgroup, the group of people who experienced this transition included a larger proportion of males, a larger proportion of people with dementia diagnoses in other diseases, a larger proportion of depression as reported in HoNOS at diagnosis, a higher number of medications with strong anticholinergic effects and a larger proportion of care package recipients.
Discussion
In this study of healthcare use among people with dementia followed from diagnosis to death, using data linkage across five data-sets, we observed distinct subgroups and associations with biopsychosocial characteristics. We identified three subgroups based on healthcare use in the year after diagnosis and four subgroups based on healthcare use in the last year of life. Notably, we identified a group who had extremely high use of emergency hospital services in the last year of life.
In line with the literature, we show that male gender was associated with higher unplanned hospital use in both periods. Reference Watson, Green, Giebel, Darlington-Pollock and Akpan4,Reference Leniz, Higginson, Stewart and Sleeman8 We found that Asian ethnicity and younger age were associated with being in the ‘high hospital use’ subgroup in the last year of life, but not in the year after diagnosis. Regarding illness-related factors, we identified a higher likelihood of hospital use in both periods among people diagnosed with mixed and vascular dementia. These associations may be due to the higher prevalence of co-existing physical conditions associated with these diagnoses or the availability of better management and support for Alzheimer’s disease in community settings. Reference Parasrampuria, Bijelic, Bott, Driessen, Lipp and Ling32 Difficulties in identifying deterioration patterns in dementia types other than Alzheimer’s disease may also hinder timely recognition of healthcare needs, increasing reliance on hospital care. Reference Teggi33
Our findings showed a reversal of the association between cognitive impairment and healthcare use from the year following diagnosis to the last year of life. While more severe cognitive problems were associated with ‘hospital use after diagnosis’, less severe cognitive issues and physical problems were associated with hospital use in the last year of life. The latter finding might reflect the possibility that people with dementia who have more severe cognitive issues are likely to reside in care homes.
Social factors such as living alone and receiving a care package were associated with a higher likelihood of receiving specialist mental healthcare. A higher proportion of care package recipients in this subgroup may be due to the identification of complex needs by specialist mental healthcare teams. Reference Salzberg, Hayes, McCarthy, Radley, Abrams and Shah34 Living alone and living in the most deprived areas were associated with hospital use and community mental healthcare use in the year after diagnosis. These may be explained by the differential access to services (i.e. unplanned access to hospitals in response to an emergency versus referral- and assessment-based access to specialist mental healthcare) and difficulties observed in access to dementia diagnosis and subsequent treatments among more deprived groups. Reference Hoang, Kåreholt, von Koch, Xu, Secnik and Religa35 In contrast to other studies, we did not find an association between area-level lower socioeconomic deprivation and high hospital use at the end of life. Reference Williamson, Leniz, Chukwusa, Evans and Sleeman6,Reference Hoang, Kåreholt, von Koch, Xu, Secnik and Religa35,Reference Naseer, Agerholm, Fastbom, Schön, Ehrenberg and Dahlberg36 Further research from an intersectional lens is needed to understand the combined effects of the identified characteristics.
In this study, no clear pattern was observed in the transition of people with dementia from subgroups characterised using healthcare services in the year after diagnosis to those characterised by healthcare use in the last year of life. Dynamic moves throughout the dementia care trajectory and similar subgroup structures have been observed previously, where people who were in the last year of their lives were not included. Reference Watson, Green, Giebel, Darlington-Pollock and Akpan4
Strengths and limitations
This study is novel in its use of a linkage between a specialist mental health service and hospital care, and access to a rich repository of information about the biopsychosocial characteristics of people with dementia. While previous studies have explored latent classes and transitions among people diagnosed with dementia or decedents, this study progresses our understanding by bringing these two significant periods and the use of multiple healthcare services together. The use of routine data provided a large sample size and minimised biases such as recall bias, which are often associated with survey data.
In terms of limitations, there may be a risk of bias in the approach to the classification of individuals into subgroups, which may attenuate the estimates. Reference Bray, Lanza and Tan37 Most studies applying methods to reduce bias have a small number of covariates and often use survey or simulation data, which are more suited to complex adjustment compared with real-life data; Reference Clark and Muthén38 classification bias in this study was also minimised by the large sample size. Reference Bray, Lanza and Tan37 We aimed to describe the characteristics of people with dementia associated with subgroup membership. However, treating class assignments as fixed may bias the estimated regression coefficients. Reference Vermunt39 Previous studies have identified distinct differences in healthcare use among people with dementia in their last year of life, depending on whether they live at home or in a long-term care facility. Reference Elyn, Gardette, Renoux, Sourdet, Nourhashemi and Sanou40 We did not have access to place of residence information or any other social care service receipt. In England, most dementia care is provided by informal carers and social care. Reference Wittenberg, Hu, Jagger, Kingston, Knapp and Comas-Herrera41 Having dementia is one of the strongest determinants of high formal long-term care use among older people towards the end of life. Reference Teggi16 Our findings are more likely to be representative of people with dementia who live in the urban regions of England. The cohort may differ from people with dementia managed solely in primary care, highlighting possible inequities in access to specialist care. A previous study found that people with dementia of Black ethnicity were under-represented in the CRIS-only records compared with those recorded in primary care data. Reference Davis, Mueller, Ashworth, Broadbent, Jewell and Molokhia24 As spatial differences in healthcare use exist, Reference Watson, Green, Giebel, Darlington-Pollock and Akpan4,Reference Elyn, Gardette, Renoux, Sourdet, Nourhashemi and Sanou40 future studies should explore the validity of the classes identified in this study in other regions and countries.
Implications for research, clinical practice and policy
Our findings describe differences in the experiences of people with dementia, who are often grouped and treated as a homogeneous group in healthcare and policy. Qualitative studies are needed to unpick the underlying reasons for the observed patterns and associations. Additionally, research using data linkage with other key health (e.g. primary care, palliative care) and social care services (e.g. social care funding receipt and care home residency) is needed. Reference Watson, Giebel, Green, Darlington-Pollock and Akpan42 Finally, a better understanding of proximity to death and healthcare use subgroups, and other services and characteristics that may influence transition probabilities, should be explored.
Reducing unplanned hospital use among people with dementia and improving post-diagnostic dementia care are policy priorities. 43 We found that a third of people who were in the ‘hospital use’ group in the year following their diagnosis had transitioned to the low healthcare use group by the last year of their life. This may signal the detection of needs earlier on the dementia trajectory during or following the hospital stay, which may have reduced the need for hospital care in the last year of life. Identifying people with dementia who are likely to experience high levels of emergency hospital care should be prioritised in care to ensure adequate and timely support is provided and potentially unnecessary hospital visits are minimised. Greater systemic prioritisation of dementia as a life-limiting condition, alongside improved palliative care referral pathways and stronger support for family carers, could help reduce reliance on emergency hospital care by enabling essential post-diagnostic support from diagnosis through to the end of life. Reference Williamson, Sleeman and Evans19,Reference Teggi, Dixon and Dickson44
We found that almost one in ten people with dementia experience high emergency hospital use in the last year of life and that people in this group (high hospital use in the last year of life) are more likely to be men, have mixed and vascular dementia, be of Asian ethnicity and receive a lower number of anticholinergic medications. People demonstrating similar patterns to those identified in the high hospital use in the last year of life group may benefit from more community support, including specialist involvement. A large proportion of people with dementia (moderate hospital use in the last year of life, 43%) visiting hospitals in the last year of life also underscores calls for improving hospital environments and care for people with dementia and investing in social care services such as nursing homes, which may reduce A&E attendance. Reference Williamson, Leniz, Chukwusa, Evans and Sleeman6
We found that approximately one in five (17%) people with dementia receive specialist mental healthcare in the year following dementia diagnosis, and a similar proportion regularly receive specialist mental healthcare in the last year of life (including out-patient and community settings). As it is often difficult to understand when individuals with dementia may be approaching the end of life, it is important to monitor and ensure the integration of dementia palliative and end-of-life skills in specialist mental healthcare services. Funding plans for mental health services must take dementia-specific services and the training needs of health and care professionals into account.
This study identified the extent to which people with dementia use multiple community and acute healthcare services during the year following diagnosis and the last year of life, and that these two periods are characterised by different patterns of healthcare use. Identification of people with dementia who experience high levels of emergency hospital care should be prioritised to ensure adequate and timely support is provided. As healthcare systems adapt to meet the needs of the growing number of people with dementia, how different services can work together to provide care should be explored.
Supplementary material
The supplementary material is available online at https://doi.org/10.1192/bjo.2026.12117
Data availability
Data is not publicly available. Authors will consider providing supplementary information about the methods, codes and study protocol upon reasonable request.
Acknowledgements
The authors would like to thank Dr Daisy Kornblum and Hitesh Shetty for their support in data extraction. The authors would also like to thank the EMBED-Care public and patient involvement (PPI) group for their contributions (who include Frank Arrojo, Helen Findlay, Roberta McKee-Jackson, Rita Meek, Christine Reddall and Jane Ward), the CRIS Service User and Carer Advisory Group (SUCAG), the Cicely Saunders Institute PPI group and SLaM Old Age Psychiatry group. No artificial intelligence (AI) tools have been used in the research or writing process for this manuscript.
Author contributions
E.Y. was responsible for conceptualisation, methodology, data curation, data cleaning, analysis, interpretation and writing – original draft. R.S. was responsible for conceptualisation, interpretation, writing – review and editing, supervision and funding acquisition. E.L.S. was responsible for conceptualisation, interpretation, writing – review and editing, supervision and funding acquisition. E.C. was responsible for methodology, interpretation and writing – review and editing. K.E.S. was responsible for conceptualisation, interpretation, writing – review and editing, supervision and funding acquisition.
Funding
This project is funded by the Economic and Social Research Council (ESRC) and the National Institute for Health and Care Research (NIHR) through the ESRC/NIHR Dementia Initiative 2018 (grant reference number ES/S010327/1). ESRC is part of UK Research and Innovation (UKRI). R.S. is part-funded by (a) the NIHR Maudsley Biomedical Research Centre at South London and Maudsley NHS Foundation Trust and King’s College London; (b) the NIHR Applied Research Collaboration South London (NIHR ARC South London) at King’s College Hospital NHS Foundation Trust; (c) the DATAMIND HDR UK Mental Health Data Hub (MRC grant MR/W014386); (d) the UK Prevention Research Partnership (Violence, Health and Society; MR-VO49879/1), an initiative funded by UK Research and Innovation Councils, the Department of Health and Social Care (England) and the UK devolved administrations and leading health research charities. E.C. is part-funded by the NIHR Maudsley Biomedical Research Centre at South London and Maudsley NHS Foundation Trust and King’s College London. K.E.S. is the Laing Galazka Chair in Palliative Care at King’s College London, funded by an endowment from Cicely Saunders International and the Kirby Laing Foundation. The views expressed are those of the author(s) and not necessarily those of the ESRC, UKRI, NHS, the NIHR or the Department of Health and Social Care.
Declaration of interest
None.
Ethical standards
The source database is approved for secondary analysis (Oxfordshire Research Ethics Committee C, reference 23/SC/0257).




 Open access


eLetters
No eLetters have been published for this article.