Implications
Too short a forage chop length may lead to digestive upsets in dairy cows, whereas a long chop length may reduce intake and performance. Dairy cows were fed short or long chop grass silage (GS) either alone or mixed with maize silage (MS). When fed the short compared with the long chop GS, the cows produced more milk, but there was no effect on reticular pH. Intake, milk production and milk protein content were all higher when cows were fed diets that contained both grass and MS.
Introduction
The increased milk production of dairy cows in many Western countries such as the UK has required an increase in the level of concentrate supplementation and the production of high-quality forages, with a trend towards lower dietary fibre levels (March et al., Reference March, Haskell, Chagunda, Langford and Roberts2014). The consequences of these dietary changes include an increased risk of metabolic disorders such as sub-acute ruminal acidosis (SARA), displaced abomasum, milk fat depression, laminitis, reduced fibre digestion and fat cow syndrome (Plaizier et al., Reference Plaizier, Krause, Gozho and McBride2008). The particle size (PS) of the diet has been proposed as a key factor, along with forage fibre and non-forage carbohydrate concentration, to ensure a healthy rumen function and maintain animal performance (Zebeli et al., Reference Zebeli, Aschenbach, Tafaj, Boghun, Ametaj and Drochner2012). In addition, optimal rumen fermentation can lead to an increase in the microbial protein and metabolisable protein supply to the small intestine and therefore enhance milk protein yield (Sinclair et al., Reference Sinclair, Garnsworthy, Mann and Sinclair2014).
A short forage PS when included in total mixed rations (TMR) based on lucerne and MS has been shown to increase dry matter (DM) intake (DMI) and milk protein yield (Tafaj et al., Reference Tafaj, Zebeli, Baes, Steingass and Drochner2007; Zebeli et al., Reference Zebeli, Aschenbach, Tafaj, Boghun, Ametaj and Drochner2012), but may result in a reduction in rumination, eating and total chewing time, as well as rumen pH (Tafaj et al., Reference Tafaj, Zebeli, Baes, Steingass and Drochner2007). In contrast, a longer PS produced a higher milk fat content (Mertens, Reference Mertens1997), but can also promote feed sorting, resulting in some cows receiving excess concentrates and others insufficient (Kononoff and Heinrichs, Reference Kononoff and Heinrichs2003). However, the effects of PS in GS based TMR on intake and milk production are inconsistent, mainly due to differences in the PS and physically effective fibre (peNDF; particles long enough to stimulate rumination, Mertens, Reference Mertens1997) measurement procedure.
In a recent study to determine the range of PS of grass and MS and TMR fed to dairy cows on commercial farms in the UK (Tayyab et al., Reference Tayyab, Wilkinson, Reynolds and Sinclair2017), it was reported that the TMR fed on UK dairy herds had more longer (>19 mm) particles than recommended for North American diets, and that the difference in PS distribution was principally due to the inclusion of GS (Tayyab et al., Reference Tayyab, Wilkinson, Reynolds and Sinclair2017). However, there is a lack of information on the effects of PS of GS-based diets on dairy cow performance. Additionally, the greater inclusion of wheat and barley that are more commonly fed in Europe (Agriculture and Horticulture Development Board, 2017) and are rapidly degraded in the rumen (Offner et al., Reference Offner, Bach and Sauvant2003) enhances the risk of SARA and increases the importance of PS and peNDF. The hypothesis of the current study was that dairy cows fed diets with a short compared with a long PS of GS when fed with or without MS would decrease rumen pH and milk fat content, but increase intake and milk production. The objectives of the study were to determine the effect of chop length of GS when fed at different ratios of GS:MS on the intake, performance, reticular pH, diet digestibility, metabolism and eating behaviour in Holstein-Friesian dairy cows.
Material and methods
Animals, housing, forages, diets and experimental routine
In total, 16 early lactation (60±10.6 days in milk) multiparous Holstein-Friesian dairy cows producing 41.9±3.86 kg (mean±SD) of milk per day and weighing 675±60.9 kg at the beginning of the study were used in a 4×4 Latin square design with four periods each of 28-days duration, with measurements undertaken during the final 12 days of each period. At the start of the experiment, cows were blocked according to milk yield and randomly assigned to one of four dietary treatments. The cows were housed in a building containing free stalls fitted with mattresses and had free access to water.
A first cut perennial ryegrass (Lolium perenne) sward was mown at a leafy stage on the 25 May 2016, wilted for 24 h and then alternate windrows harvested using a precision chop self-propelled forage harvester (John Deere 7840i, Nottinghamshire, UK) at two different settings to provide a theoretical chop length of 10 mm (short chop) or 44 mm (long chop). An additive (Axphast Gold; Biotal, Worcestershire, UK) was applied at the rate of 2 l/tonne to each GS which were ensiled in separate roofed concrete clamps. Maize silage (Zea mays) was harvested on 10 October 2016 using the same forage harvester as the GS to provide a theoretical chop length of 15 mm. A silage additive (Maizecool Gold; Biotal) was applied at 2 l/tonne, and the MS ensiled in a concrete clamp.
The two GS (short or long) and two ratios of GS:MS (100:0 or 40:60 respectively, DM basis) were used to formulate four diets (Table 1). The dietary treatments were: long chop GS (LG); short chop GS (SG); LG and MS (LM) and SG and MS (SM). All diets were fed as a TMR with a forage: concentrate ratio of 54:46 (DM basis) to provide similar metabolisable energy and protein content (Thomas, Reference Thomas2004). Diet mixing and feeding protocol were adopted after Sinclair et al. (Reference Sinclair, Edward, Errington, Holdcroft and Wright2015) using 16 Hokofarm roughage intake feeders (RIC feeders, Marknesse, the Netherlands). Fresh feed was offered daily at 1000 h at the rate of 1.05 of ad-libitum intake, with refusals collected three-times per week before feeding. Forages were sampled twice weekly; one sample was oven dried at 105°C and the ratio of GS to MS adjusted to the desired level, whereas the second sample was stored at −20°C for subsequent analysis. Samples of all four TMR were collected daily during the final week of each period and stored at −20°C for subsequent analysis.
Dietary inclusion (kg/kg dry matter (DM)) and predicted nutrient composition for diets fed to cows that contained long chop grass silage (LG), short chop grass silage (SG), long chop grass and maize silages (LM) or short chop grass and maize silages (SM)

ME=metabolisable energy; MPN=metabolisable protein-rumen nitrogen limited; MPE=metabolisable protein-rumen energy limited.
1 A rumen-protected source of fat (Volac, Royston, UK).
2 A rumen-protected source of soybean (NWF Agriculture, Cheshire, UK).
3 Mineral/vitamins premix (KW Alternative Feeds, Leeds, UK) providing (g/kg) 220 calcium, 30 phosphorus, 80 magnesium, 80 sodium, (mg/kg) 760 copper, 30 selenium, 1 000 000 IU vitamin A, 300 000 IU vitamin D3, 3000 IU vitamin E, 2.5 mg/kg vitamin B12, 135 mg/kg biotin.
Cows were milked twice daily at 0700 and 1700 h with milk yield recorded at each milking and samples taken during the final week of each period (two morning and two evening milkings) for subsequent analysis. Body condition score (Ferguson et al., Reference Ferguson, Galligan and Thomsen1994) and live weight were recorded after the evening milking during the week before commencing the study and then at the end of each period. Whole tract apparent digestibility was estimated using acid insoluble ash as an internal marker (Van Keulen and Young, Reference Van Keulen and Young1977) with faecal samples collected at 1000 and 1600 h for 5 consecutive days during the final week of each period, and stored at −20°C before subsequent analysis.
Reticular pH and blood collection
To determine reticular pH, pH boluses (eCow®; Devon Ltd, Exeter Devon, UK) were administered orally to all cows 1 week before data collection. Boluses were calibrated before administration by immersing in warm water (39°C) for 30 min according to the manufacturers’ instructions. Data were recorded every 15 min and downloaded at the end of each period. A second set of pH boluses were administered to all cows during the 1st week of the 3rd period to monitor reticular pH during periods 3 and 4. Blood samples were collected from 12 cows (three per treatment) by jugular venepuncture over 2 days during the collection week at 0900, 1100, 1230 and 1400 h, centrifuged at 3000×g for 15 min, the plasma extracted and stored at −20°C before subsequent analysis.
Particle size distribution and eating behaviour
The PS distribution of the fresh TMR was measured by collecting samples 5 min post feeding on days 20 to 25 of each period and using a modified Penn State Particle Separator with five sieve screens of size 44, 26.9, 19, 8 and 4 mm (Tayyab et al., Reference Tayyab, Wilkinson, Reynolds and Sinclair2017). A manual shaking procedure was adopted (Kononoff et al., Reference Kononoff, Heinrichs and Lehman2003), and each diet was separated into six fractions: >44, 26.9 to 44, 19 to 26.9, 8 to 19, 4 to 8 and <4 mm. Jaw movement (eating, ruminating and idling) was visually recorded for 48 h commencing at 0530 h on the day 18 of each period by instantaneous scan monitoring of all cows at 5 min intervals (Martin and Bateson, Reference Martin and Bateson2007). All observers were trained for 1 h before the start of the study with a 96% similarity index achieved. Observations were conducted using two observers for a duration of 4 h to minimise fatigue and enhance accuracy (Martin and Bateson, Reference Martin and Bateson2007).
Chemical analysis
Forage and TMR samples were analysed according to Association of Official Analytical Chemists (2012) for DM (934.01), CP (988.05; intra-assay CV of 2.3%) and ash (942.05), whereas NDF (using heat-stable α-amylase; Sigma, Gillingham, UK), ADF and ADL were analysed according to Van Soest et al. (Reference Van Soest, Robertson and Lewis1991) and expressed exclusive of residual ash (intra-assay CV of 1.4% and 1.3% for NDF and ADF, respectively). Starch concentration was analysed using the procedure described by McCleary et al. (Reference McCleary, Gibson and Mugford1997). Milk samples were analysed using a Milkoscan Minor analyser (Foss, Hillerød, Denmark). Plasma samples were analysed for glucose, β-hydroxybutyrate (3-OHB) and urea (Randox Laboratories, County Antrim, UK; kit catalogue no. GL1611, RB1008 and UR221 with an intra-assay CV of 0.6%, 4.5% and 2.3%, respectively) using a Cobas Miras Plus autoanalyser (ABX Diagnostics, Bedfordshire, UK). Faecal samples were pooled for each cow within each period, dried and analysed for acid insoluble ash (Van Keulen and Young, Reference Van Keulen and Young1977), nitrogen, NDF and ADF. Forage pH was determined using a pH metre (HI 2210; Hanna Instruments, Bedfordshire, UK) after suspending 50 g forage in 100 ml distilled water for 30 min. Milk and feed fatty acids (FA) analysis are provided in the Supplementary Material S1.
Calculations and statistical analysis
Calculations for forage PS are presented in the Supplementary Material S2. All data were tested for normality using the general descriptive statistics and analysed as a Latin Square design with a 2×2 factorial treatment structure using GenStat 17.1 (VSN International Ltd, Oxford, UK), with main effects of chop length (C), forage ratio (F) and their interaction (C×F). The model used was: Y=μ+C i + F j + C × F ij + P j + A k + € ijk , where Y is the observation, μ the overall mean, C i is the chop length effect, F j is the forage ratio effect, C×F ij is the interaction between chop length and forage ratio, P j the fixed period effect, A k the random effect of animal and € ijk the residual error. Blood plasma, rumen pH and sorting activity data were analysed as repeated measures ANOVA. Results were reported as treatment means with SED, with the level of significance set at P<0.05 and a tendency stated at P<0.1.
Results
Preliminary results of this study have previously been presented (Tayyab et al., Reference Tayyab, Wilkinson, Reynolds and Sinclair2018).
Forage and feed composition
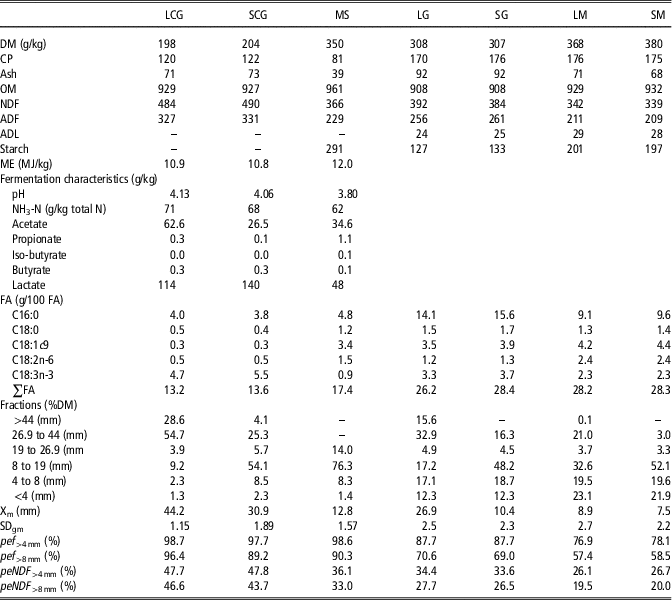
The nutrient composition of the LG and SG were similar with a mean DM, CP and NDF concentration of 201, 121 and 487 g/kg DM respectively, whereas the GS had a lower DM concentration, but a higher NDF and CP concentration than the MS (Table 2). The mean PS (X m) of the LG was 13.3 mm more than the short GS, with the MS having the shortest X m. The MS-based diets (LM and SM) had a higher DM compared with the GS-based diets (LG and SG), but all four diets had a similar CP content, with a mean value of 174 g/kg DM. The GS-based diets had higher ash, NDF and ADF content compared with the MS-based diets. The mean X m of the GS-based diets was 10.5 mm greater than the MS-based diets and was 9 mm less for the short chop than the LG-based diets. The peNDF >4mm was also higher for the GS than the MS-based diets.
Nutrient composition (g/kg dry matter (DM)), fatty acid (FA) profile and particle size of grass silage (long chop, LCG and short chop, SCG), maize silage (MS) and diets fed to cows that contained long chop grass silage (LG), short chop grass silage (SG), long chop grass and maize silages (LM) or short chop grass and maize silages (SM)

OM=organic matter; NH3-N=ammonia nitrogen; ME=metabolisable energy; X m=geometric mean particle size; SDgm=SD of X m ; pef=physical effectiveness factor; peNDF=physically effective fibre.
Production performance
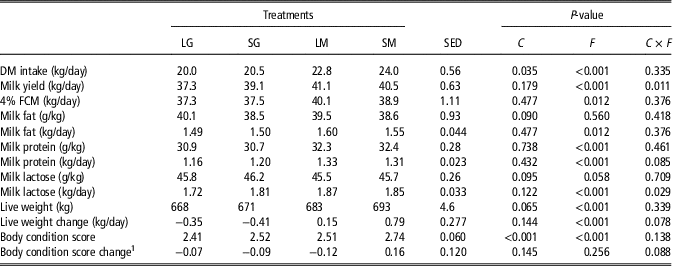
Average DMI was 3.2 kg/day lower (P<0.001) in cows when fed the GS than the MS-based diets (Table 3). The short chop length diets resulted in a 0.9 kg DM/day higher (P=0.035) intake in cows compared with the long chop length diet. Cows fed the GS-based diets produced 2.4 kg/day less (P<0.001) milk than when fed diets containing GS and MS (Table 3). There was an interaction (P=0.011) between chop length and forage ratio on milk yield, with a short chop length increasing yield in cows when fed GS but not MS-based diets. There was a tendency (P=0.09) for a higher milk fat content in cows when fed the long chop length diets. Live weight change was 0.85 kg/day higher (P<0.001) in cows when fed the MS compared with the GS-based diets, and there was a tendency (P=0.065) for a lower live weight gain in cows when fed long chop compared with the short chop length diets.
Intake and performance of dairy cows fed diets containing long chop grass silage (LG), short chop grass silage (SG), long chop grass and maize silages (LM) or short chop grass and maize silages (SM)

C=chop length; F=grass to maize silage ratio; C×F=interaction between C and F; DM=dry matter; FCM=fat-corrected milk.
1 Change over the 28-day period.
Whole tract digestibility
There was an interaction for DM (P=0.019) and OM (P=0.022) digestibility, where the short chop length increased digestibility in cows when fed the GS but not the MS-based diets (Table 4). There was also an interaction (P=0.003) for N digestibility, where a short chop length increased N digestibility when cows were fed the GS-based diets, and decreased digestibility when fed the MS-based diet. Digestibility of NDF was 0.228 kg/kg higher (P<0.001) in cows when fed the GS compared with the MS-based diets, and there was an interaction (P=0.014) between chop length and forage ratio on ADF digestibility, where a shorter chop length GS increased digestibility for the GS-based diet, and decreased digestibility for the MS-based diet.
Diet digestibility (kg/kg) in dairy cows fed diets containing long chop grass silage (LG), short chop grass silage (SG), long chop grass and maize silages (LM) or short chop grass and maize silages (SM).

C=chop length; F=grass to maize silage ratio; C×F=interaction between C and F; DM=dry matter; OM=organic matter; N=nitrogen.
Reticular pH and eating behaviour
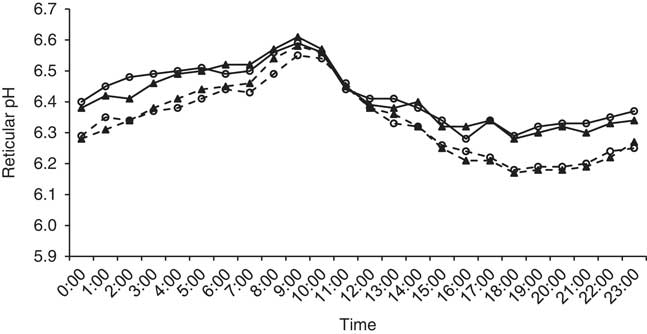
Reticular pH was highest before the morning feeding in all treatments and then declined with time (P<0.001; Figure 1). There was a time×forage ratio interaction on reticular pH, which was lower in cows fed MS for most of the day except around fresh feed delivery, but there was no effect of GS chop length. When cows were fed the GS-based diets, the mean minimum reticular pH was 0.1 higher (P=0.001) than when fed the MS-based diet (Table 5). Cows fed the MS-based diets also spent a longer time at reticular pH levels below pH 6.2 and 6.5 (P=0.003) compared with the GS-based diets. Cows spent 1.1 h/day longer eating (P<0.001) when offered the GS compared with the MS-based diets and 0.9 h/day longer (P=0.003) eating the long chop compared with the SG (Table 5). Similarly, eating time (ET) was 4.7 min/kg DM higher when cows were fed the GS compared with the MS-based diets (P<0.001), and 2.4 min/kg DMI higher (P<0.05) when fed the longer compared with the shorter GS. There was an interaction (P<0.05) for rumination time (RT; h/day), with the shorter chop length increasing the RT in cows when fed the GS but not the MS-based diets, whereas when expressed on a min/kg DMI, a shorter chop length increased RT on the GS and decreased RT on the MS-based diets. The PS distribution of fractions 8 to 19 and 4 to 8 mm decreased (P<0.05) with time post-feeding, and the DM proportion of the 26.9 to 44 mm fraction was higher (P<0.001) for diets that contained LG or when mixed with MS (Supplementary Table S1).
Hourly reticular pH in cows fed diets containing long chop grass (LG; --o--); short chop grass silage (SG, --▲--); long chop grass and maize silages (LM; --o--), or short chop grass and maize silages (SM;--▲--) (SED 0.042; time, P<0.001; forage ratio, P=0.003; time×F, P<0.001).

Reticular pH and eating behaviour of dairy cows fed diets containing long chop grass silage (LG), short chop grass silage (SG), long chop grass and maize silages (LM) or short chop grass and maize silages (SM)

C=chop length; F=forage ratio; C×F=interaction between C and F; DMI=dry matter intake.
1 Average percentage of time cows spent below each pH level.
Milk fatty acids and blood metabolites
Cows fed the short chop length diets had a 0.04/100 g higher milk fat C18 : 3n-3 concentration (P<0.001); whereas, those receiving the long chop length diets had a 0.05/100 g higher concentration of cis-9, trans-11 conjugated linoleic acid (P=0.032; Supplementary Table S2). For cows fed the GS-based diets, milk concentrations of C16:0, C16:1n-7, C18:1c9 and C18:3n-3 were higher (P<0.05), compared with when the MS-based diets were fed. In contrast, milk from cows fed the MS-based diets had a higher (P<0.01) concentration of C10:0, C12:0, C14:1, C18:0, C18:1trans-8, C18:1trans-9, C18:1trans-12, C18:2n-6 and total polyunsaturated FA (P=0.015) compared with when fed the GS-based diets.
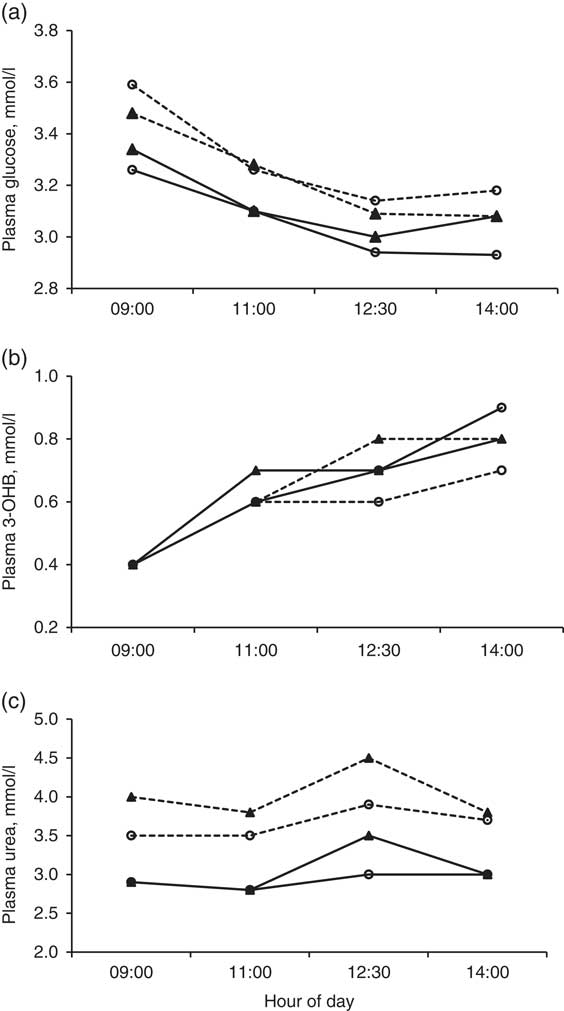
Plasma glucose concentration decreased (P<0.001) post feeding (Figure 2a) and was 0.17 mmol/l higher (P=0.008) in cows when fed the MS compared with the GS-based diets. Plasma 3-OHB concentrations increased (P<0.001) with time post-feeding, but there was no effect of chop length or forage ratio (Figure 2b). Similarly, plasma urea concentration increased (P=0.004) post-feeding to a maximum at 1230 h, with cows fed the MS-based diets having a 0.86 mmol/l higher (P<0.001) concentration than when fed the GS-based diet (Figure 2c).
Plasma glucose (a), plasma β-hydroxybutyrate (3-OHB) (b) and plasma urea (c) concentrations in cows fed diets containing long chop grass (LG; --o--); short chop grass silage (SG,--▲--); long chop grass and maize silages (LM; --o--), or short chop grass and maize silages (SM;--▲--). For plasma glucose, SED 0.108; time, P<0.001; F, P=0.008. For plasma 3-OHB, SED 0.112; time, P<0.001. For plasma urea, SED 0.265; time, P=0.004; chop length, P=0.093; forage ratio, P<0.001.

Discussion
Nutrient composition and particle length
The current study was conducted to determine the effect of chop length of GS when fed alone or mixed with MS on cow performance, rumen pH, eating behaviour and blood metabolites. The PS of the long chop length GS and MS used in the current study were similar to the mean values fed on UK dairy farms reported by Tayyab et al. (Reference Tayyab, Wilkinson, Reynolds and Sinclair2017; 43 and 11 mm respectively), whereas the short chop length GS was within the shortest 5% of the GS surveyed. The DM of the GS was lower than typically reported for 1st cut GSs (Sinclair et al., Reference Sinclair, Edward, Errington, Holdcroft and Wright2015), although the chemical composition of both chop length GS was similar, a finding in agreement with previous studies that have altered forage chop length before ensiling (Kononoff and Heinrichs, Reference Kononoff and Heinrichs2003; Yang and Beauchemin, Reference Yang and Beauchemin2007). The lactic acid content was, however, higher and the acetic acid content lower in the short chop compared with the long chop length GS, a finding in agreement with others who have reported that a shorter chop length can enhance consolidation in the clamp and improve the fermentation profile (McDonald et al., Reference McDonald, Henderson and Heron1991).
Animal performance
The increase in DMI when cows were fed the MS compared with the GS-based diets is in agreement with previous studies that have investigated the effect of including MS (O’Mara et al., Reference O’Mara, Fitzgerald, Murphy and Rath1998; Hart et al., Reference Hart, Huntingdon, Wilkinson, Bartram and Sinclair2015). Mulligan et al. (Reference Mulligan, Quirke, Rath, Caffrey and O’Mara2002) reported an increase in intake of 3.5 kg/day DM when GS was replaced by MS in the diet of late lactation dairy cows, whereas a linear increase in DMI was observed when MS replaced GS in the diet of mid-lactation dairy cows (Kliem et al., Reference Kliem, Morgan, Humphries, Shingfield and Givens2008). However, a higher acetate content of the LG coupled with its low DM content may have resulted in lower quality and subsequently decreased DMI and production (McDonald et al., Reference McDonald, Henderson and Heron1991). Feeding cows with diets containing a short chop length GS increased DMI in the current study, possibly due to less time required for chewing before swallowing, a finding in accordance with other studies that have investigated the effect of chop length (MS or alfalfa) on DMI in dairy cows (Nasrollahi et al., Reference Nasrollahi, Imani and Zebeli2015). The increase in the DMI of cows fed the short chop length diets in the current study could be attributed to a reduced rumen fill and lower rumen retention time, both of which are associated with an increased intake (Zebeli et al., Reference Zebeli, Tafaj, Weber, Dijkstra, Steingass and Drochner2007).
The current finding of higher milk yield in cows when MS replaced GS is in agreement with O’Mara et al. (Reference O’Mara, Fitzgerald, Murphy and Rath1998) and Hart et al. (Reference Hart, Huntingdon, Wilkinson, Bartram and Sinclair2015) and is most likely to be the result of the higher DMI in cows fed the MS-based diets. There was an interaction between chop length and forage ratio on milk yield in the current study, with a short chop length GS increasing yield in cows when GS was the sole forage, but not when GS was fed along with MS. This difference may be explained by the mean PS of the diets, with the LG diet having a substantially longer PS than any of the other three diets. Longer particles in LG may have passed out of the rumen at a slower rate, resulting in a lower DMI and subsequent milk production (Kononoff and Heinrichs, Reference Kononoff and Heinrichs2003; Zebeli et al., Reference Zebeli, Aschenbach, Tafaj, Boghun, Ametaj and Drochner2012). Milk fat production was not affected by chop length in the current study, possible due to a sufficient dietary peNDF >4 mm content of all four diets (minimum of 26%), as it has been suggested that milk fat content is only influenced by chop length when dietary peNDF levels are lower than the recommended level of 18% to 22% DM (Zebeli et al., Reference Zebeli, Aschenbach, Tafaj, Boghun, Ametaj and Drochner2012). Cows receiving the MS-based diets in the present study gained live weight whereas when they received the GS-based diets, they lost weight, which may be attributed to differences in DM and ME intake as a consequence of feeding mixed forage diets as suggested by O’Mara et al. (Reference O’Mara, Fitzgerald, Murphy and Rath1998). In contrast, chop length did not significantly alter BW or BW change, a finding in agreement with that reported by Kononoff and Heinrichs (Reference Kononoff and Heinrichs2003), and reflects that in the current study DMI was less affected by chop length than the GS:MS ratio.
The digestibility coefficients of the dietary components in the current study were similar to previous studies that have evaluated GS and MS in the diet of dairy cows (Sinclair et al., Reference Sinclair, Edward, Errington, Holdcroft and Wright2015). In a review of the literature, Khan et al. (Reference Khan, Peiqiang, Mubarak, Cone and Hendricks2015) concluded that increasing stage of maturity was one of the major factors influencing fibre digestibility in MS, and the comparatively high DM of the MS used in the current study (350 g/kg DM) may have resulted in a more resistant fibre structure, reducing the digestibility of the fibre in the MS compared with the GS diets. Alternatively, the decreased rumen pH due to the higher concentration of non-structural carbohydrates in the MS diets may have had a negative impact on the fibre degrading microbiota, decreasing diet digestibility (Nasrollahi et al., Reference Nasrollahi, Imani and Zebeli2015; Tafaj et al., Reference Tafaj, Zebeli, Baes, Steingass and Drochner2007).
Reticular pH and eating behaviour
Similar to previous studies (Yang and Beauchemin, Reference Yang and Beauchemin2007), the highest reticular pH was recorded before feeding, with a nadir reached at approximately 9 h after fresh feed delivery. Cows fed the MS compared with the GS-based diets had a lower mean and minimum reticular pH, which may be associated with the higher concentration of starch and lower concentration of peNDF >8 mm in the MS diets (130 v. 199 g starch/kg DM and 27.1% v. 19.1% peNDF >8 mm , for the GS- and MS-based diets, respectively). In contrast, chop length had no effect on reticular pH, a finding in agreement with Tafaj et al. (Reference Tafaj, Zebeli, Baes, Steingass and Drochner2007). In contrast, Yang and Beauchemin (Reference Yang and Beauchemin2007) reported an increase in mean rumen pH when a longer chop length forage was fed, although the results were based on lucerne silage rather than the GS used in the current study.
Chop length did influence ET in the current study, with cows spending more time eating the long than the short chop diets, a finding in agreement with Kammes and Allen (Reference Kammes and Allen2012) who reported a tendency for a longer daily ET when cows were offered a long v. short chop length orchard grass. Kammes and Allen (Reference Kammes and Allen2012) reported no effect of chop length on RT, but in the current study the effect of chop length was unclear, with a decrease in RT/kg DMI in cows when fed GS, and increase when fed the MS-based diets, although there was a clear effect of forage source, with cows fed the MS diets (which had the shortest PS), spending significantly less time ruminating.
Metabolism and milk fatty acids
The higher plasma glucose concentration in cows fed the MS diets in the current study may be due to the higher dietary content of sugar and starch (Oba and Allen, Reference Oba and Allen2003), whereas the lower plasma urea concentration in cows fed the GS-based diets may reflect a lower content of rumen degradable N as a greater proportion of dietary N was from rumen-protected protein sources in these diets, although all diets were formulated to have a similar excess of rumen degradable nitrogen. Alternatively, the GS-based diets may have resulted in a more suitable rumen microbial environment for the capture of degraded N, as demonstrated by the higher reticular pH.
Overall, the inclusion of MS in the diet altered the FA profiles of the milk more than the GS chop length. Chilliard et al. (Reference Chilliard, Ferlay, Mansbridge and Doreau2000) reviewed the literature on diet and milk FA profile and concluded that cows fed MS-based diets had a higher concentration of C10:0, C12:0 and C18:2n-6, due to the higher concentrations in MS compared with GS, a finding in agreement with the current results. Hart et al. (Reference Hart, Huntingdon, Wilkinson, Bartram and Sinclair2015) also reported a 0.99/100 g higher milk fat content of C16:0 in cows when fed a 70:30 (DM basis) grass to MS-based diets compared with those receiving a 30:70 GS:MS diets, a finding in agreement with the current findings. Soita et al. (Reference Soita, Fehr, Christensen and Mutsvangwa2005) reported no effect of chop length on milk FA, but in the current study a shorter GS chop length increased the milk fat proportion of C18:3n-3, which may be related to a lower rate and extent of biohydrogenation in the rumen, possibly due to a shorter rumen retention time.
Conclusions
The short chop length GS used in the current study was within the shortest 5% of that fed in the UK but had no effect on reticular pH compared with an average chop length GS, but increased intake and milk performance when fed as the sole forage. Milk performance can also benefit from replacing a proportion of GS with MS in a TMR when fed to high producing dairy cows, irrespective of the chop length of the GS, but with a reduction in reticular pH and fibre digestion. The effects of a shorter chop length GS when fed at a high concentrate: forage ratio, or with a greater dietary content of rapidly fermentable starch, requires further investigation.
Acknowledgements
The authors would like to thank AHDB-Dairy for financial support. Special thanks are due to S. Williams, C. Cianchi, C. Gauld, E. Forrest, E. Greenfield, M. Holmes and L. Rowland for their support in collecting the data.
Declaration of interest
None.
Ethics statement
All the procedures involving animals were conducted in accordance with the UK Animals Scientific Procedures Act (1986; amended 2012) and received local ethical approval.
Software and data repository resources
None.
Supplementary material
To view supplementary material for this article, please visit https://doi.org/10.1017/S1751731118001568