INTRODUCTION
Nitrogen fertilizer is one of the most important inputs for improving food production worldwide. In China and other rice-cultivating countries, N fertilizer is applied to paddy soils in large quantities to achieve high yields of rice. The use efficiency of N fertilizer is as low as 0·30–0·35 in most agricultural practices, due to losses to the natural environment in many ways (Zhu & Wen Reference Zhu, Wen, Zhu, Fen and Feeney1992). Losses due to ammonia volatilization have been estimated as between 0·00 and 0·60 (Fillery et al. Reference Fillery, Simpson and De Datta1986) and between 0·09 and 0·42 (Cai & Zhu Reference Cai and Zhu1995). Therefore, it is important to control ammonia volatilization loss in order to improve nitrogen use efficiency in paddy soils.
Many measures and strategies have been proposed and applied to control ammonia volatilization from paddy fields, including deep application of N fertilizer, coated or control release fertilizer and chemical additions. The addition of surface film-forming material (SFFM) can reduce ammonia volatilization loss from water effectively in pan and field experiments (Cai et al. Reference Cai, Freney, Humphreys, Denmead, Samson and Simpson1987; Yin et al. Reference Yin, Shen and Zhu1996). However, SFFM materials using alcohol are expensive (Cai et al. Reference Cai, Freney, Humphreys, Denmead, Samson and Simpson1987) and alcohol-soluble SFFM contains a volatile solvent reducing the short-term efficiency of the surface film. Thus, a new SFFM was developed with emulsifiers to improve its stability and reduce its cost (Zhuang et al. Reference Zhuang, Yin and Zhu2002). A pan experiment was conducted to investigate the effect of the proposed SFFM on ammonia volatilization loss from water solutions in pans and in a field experiment use to test the effectiveness of SFFM using model estimation (Zhuang et al. Reference Zhuang, Yin and Zhu2002).
Previous studies have shown that an SFFM can reduce the ammonia volatilization loss from paddy fields (Cai et al. Reference Cai, Freney, Humphreys, Denmead, Samson and Simpson1987; Yin et al. Reference Yin, Shen and Zhu1996), but the effect of application rate on ammonia volatilization loss has not been investigated systematically. Obviously, it is necessary to consider both cost and efficiency when determining the application rate in practice. In the present pan experiment, the effect of different application rates of SFFM was assessed.
Simulation models are used extensively to visualize and describe important individual processes in a system. Modelling takes into account the interactions between individual cases in order to simulate the interactions of the processes and to estimate general responses to the processes. Therefore, the Jayaweera–Mikkelsen ammonia volatilization (J–M) model was employed in the present study to determine the effectiveness of SFFM in a paddy rice field (Jayaweera & Mikkelsen Reference Jayaweera and Mikkelsen1990a, Reference Jayaweera and Mikkelsonb; Jayaweera et al. Reference Jayaweera, Mikkelsen and Paw1990). Moreover, this method can be evaluated as a tool for screening a new SFFM to mitigate NH3 pollution from paddy systems.
The present study was designed to investigate the effect of an SFFM on NH3 volatilization from a paddy rice field, by model estimation using parameters from evaporative pan experiments.
MATERIALS AND METHODS
Pan experiment for SFFM application
The evaporative pan experiment was conducted in square pans made of polyvinyl chloride (PVC) (0·8×0·8 m, depth 0·12 m). The SFFM adopted in the experiment was a mixture of 16–18-octadecanols emulsified with sodium dodecyl sulphate and polyalkoxylated polyol (Yin et al. Reference Yin, Shen and Zhu1996; Zhuang et al. Reference Zhuang, Yin and Zhu2002). Before application of the SFFM, each pan was filled with a (NH4)2SO4 solution to give 100 mg/l of NH4+ and pH adjusted to 10 with NaOH. Six rates of SFFM addition (0, 0·5, 1, 2, 4 or 8 g/m2 of the pan surface were set in triplicate and incubated in the pans. The SFFM was stirred and diluted with double distilled water (DDW) to a ratio of 1:100; the emulsified solution was spread evenly on the water surface through an injector within a few minutes. The experiment began at 09·00 h and samples were collected every hour until 15·00 h. The initial volume of each pan was approximately 64 litres and each sample collected was 50 ml.
Ammonia concentration in the water was determined by the indophenol colorimetric method (Bundy & Meisinger Reference Bundy, Meisinger, Weaver, Angle, Bottomley, Bezdicek, Smith, Tabatabia and Wollum1994). The pH in the solutions was measured by an electronic pH meter (Orion 818 USA). Water depth (WD) was measured by a ruler (±1 mm). Wind speed (WS) was recorded using an anemometer with data log (VOESA 1817 PD China) at a height of 2·5 m. Air and water temperatures were measured using an electronic thermometer (TESTO 106/T1 Germany) every hour.
Field experiment of SFFM application
The field experiment was conducted at the Ecological Station of the Chinese Academy of Sciences located at Changshu City, Jiangsu Province of China (120°48′E, 31°35′N). Rice plants were transplanted on 27 June 2002. Base fertilization (225 kg N/ha as urea) was done 1 h before rice transplantation. Two treatments, with and without SFFM addition, were set up in four replications. The application rate of SFFM was 3·5 g/m2 and each plot area was 30 m2 (6×5 m with 20 rows of rice seedlings). After rice transplantation, SFFM was spread on the paddy water surface. The surface WD was maintained at 60 mm by using a ditch with stable WD. Samples of the paddy field surface water were collected by combining six points from each plot at 09·00 h every day during the 6-day observation period. Ammonia concentration in the water samples was determined and, at the same time, WS and temperature were also recorded.
Measurement of NH3 volatilization in the field
Ammonia volatilization was measured by a continuous airflow enclosure method using a chamber in each plot (Lin et al. Reference Lin, Fan, Hu, Zhao and Luo2007). The volume of the NH3 volatilization headspace (200 mm in diameter) could be adjusted with the chamber depth where the chamber frame was inserted into soil. The air exchange rate, generated by a pump, was set to 15–20 chamber volumes/min according to the volume of the volatilization headspace (Tian et al. Reference Tian, Cao, Cai and Ren1998). The ammonia volatilization rate was measured twice daily in the morning from 07·00 to 09·00 and 15·00 to 17·00. For each measurement, the air flowed continuously for 2 h and then the chambers were removed to eliminate the differences in conditions between the inside and outside of the chambers. Flasks filled with 50 ml of 20 g/l boric acid were used to absorb the ammonia gas for 2 h and the liquid was then titrated with 0·005 M H2SO4 to calculate ammonia volatilization (Tian et al. Reference Tian, Cao, Cai and Ren1998).
Parameter introduced to fit the condition of SFFM treatments
The NH3 volatilization process is directly influenced by five primary factors, namely NH4+-N concentration ([NH4+]), pH, temperature (T), depth of floodwater (WD) and WS (Jayaweera & Mikkelsen Reference Jayaweera and Mikkelsen1990a). Jayaweera & Mikkelsen (Reference Jayaweera and Mikkelsen1990a) derived the following expression to determine the rate of NH3 volatilization from a flooded system by chemical kinetics using the above five factors:
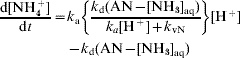
where AN is the ammonium N concentration, [NH3]aq is the aqueous NH3 concentration, [H+] is the hydrogen ion concentration in floodwater at equilibrium and k vN is the volatilization rate constant for NH3.
When a surface film is added to the water surface, the resistance of NH3 volatilizing from liquid to air will be changed. In order to simplify the effect of surface film on NH3 volatilization, the parameter k f was used to represent the resistance from the surface film. The effect of a surface film only adds and assumes a resistance to NH3 volatilizing from the liquid phase without influencing the five primary factors, hence the overall liquid phase coefficient for NH3, K LN, can be modified and expressed as follows:

where k lN and k gN are the exchange constants of NH3 in gas and liquid phases, respectively, and HnN is the non-dimensional Henry's law constant for NH3.
The overall mass transfer coefficient for NH3, K ON, which is numerically equal to the overall liquid phase coefficient for NH3, K LN, can be obtained from the following expression:

All parameters in eqn (3) can be computed from the model of Jayaweera–Mikkelsen (J–M), but the parameter k f related to SFFM is difficult to measure and compute. Thus, the value of k f was calculated from the experimental data, as discussed in the following section.
According to the J–M model, NH3 loss over a period can be described as follows:

where [NH4+] is the ammonium concentration in the liquid, T is the temperature of water, WD is the depth of water layer, WS is the wind speed above the water surface and t is the volatilization period. With SFFM added, the process of NH3 volatilization loss is controlled by k f. Equation (4) can thus be modified as the following expression:

RESULTS
Ammonia volatilization with SFFM addition in the pan experiment
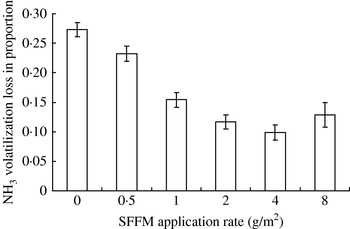
Under the experimental conditions, NH3 losses from volatilization showed large differences between the SFFM application rates (Fig. 1). Compared with the control treatment, the application of SFFM effectively reduced NH3 volatilization losses from the solution. The efficiency in reducing NH3 loss increased with increasing SFFM application rate up to a rate of 4 g/m2. However, at an application rate of 8 g/m2, the reduction efficiency was lower than that at 4 g/m2.
Effect of SFFM on NH3 volatilization from a water solution within 6 h (different letters represent significance at P<0·05).

Ammonia volatilization from the paddy field
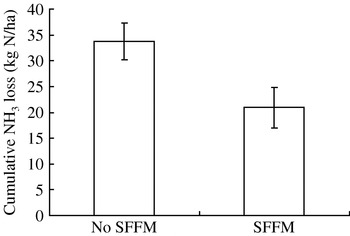
The cumulative NH3 volatilization loss from the paddy field was 20·9 kg/ha with SFFM application and 33·7 kg/ha without during the observation period (Fig. 2). The results show that the application of SFFM was significantly (P<0·01) effective in reducing NH3 volatilization in practice.
Cumulative NH3 loss in the paddy field with or without SFFM application after 6 days.

Ammonia volatilization with SFFM addition
The relationship between the application rate of SFFM and percentage reduction in NH3 volatilization is non-linear. The NH3 volatilization loss is lowest at the SFFM application rate of 4 g/m2, but it is increased at 8 g/m2 SFFM (Fig. 1). It is possible to reduce NH3 volatilization loss from the paddy field with a reasonable SFFM application.
Computation and discussion of kf
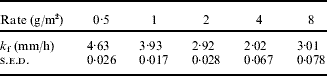
When the five primary parameters and the loss of NH3 are given, k f can be computed from the modified J–M NH3 volatilization model eqn (5) (Table 1). It was assumed that the value of k f remained constant under different environmental conditions and for different periods. The k f value versus the rate of SFFM application shows a trend similar to that of NH3 volatilization loss versus SFFM application rate (Fig. 1).
Values of kf at different SFFM application rates
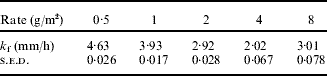
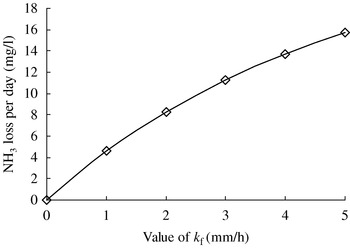
In order to predict the effect of k f value on NH3 volatilization loss, the NH3 volatilization was calculated assuming the following conditions: AN=25 mg/l, pH=8·5, T=25°C, WD=100 mm and WS=6 m/s, where AN is the concentration of ammonia N, and WS is the wind speed at a height of 8 m. Obviously, NH3 volatilization loss is increased with increasing k f values (Fig. 3). The application of SFFM shows a large effect on the NH3 volatilization loss. Hence, the value of k f can be used as an indicator to assess the effect of new SFFM. However, k f is not stable with the application time due to bio-decomposition and the material instability. Based on the effect of SFFM on water evaporation, the half-life of SFFM was estimated by the model from Zhuang et al. (Reference Zhuang, Yin and Zhu2001), which is modified as follows:
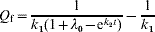
where Q f is the effective application rate of SFFM, k 1 and k 2 are process parameters, λ0 is the initial water evaporation ratio and t is the time after SFFM application.
NH3 volatilization loss at different k f values.

Sensitivity analysis of the model with SFFM
The magnitude of NH3 loss from the standing water can be predicted by simultaneously taking into account all five primary factors that determine the NH3(aq) concentration and the volatilization rate constant for NH3 (k vN). Thus, it is suggested that k f parameters should be combined in the prediction of NH3 volatilization loss when SFFM is added. As in the modified Jayaweera and Mikkelsen model, the NH3 volatilization loss was simulated incorporating k f=2·02 mm/h (i.e. SFFM application rate is 4 g/m2) under the following initial conditions: AN=25 mg/l, pH=8·5, T=25°C, WD=100 mm and WS=6 m/s.
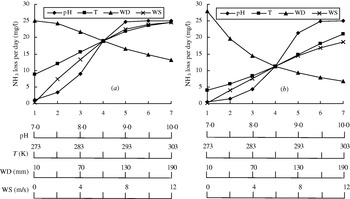
The ammonia volatilization loss per day (vertical axis of Fig. 4) was calculated assuming that only one factor varied, while the other three factors remained constant both in the absence of SFFM and the presence of SFFM. The ranges tested were pH 7–10; temperature 273–303 K; WD 10–190 mm and WS 0–12 m/s. Ammonia volatilization loss increased with increasing pH, temperature and WS, but decreased with increasing WD (Fig. 4a, b). The steepness of the curves can be taken to indicate the sensitivity of ammonia volatilization to the factors. Thus, volatilization was most responsive to pH, both in the absence and presence of SFFM. Compared with the control treatment, the factor of WD is more sensitive, but T and WS become less sensitive when SFFM is present.
Calculated NH3 volatilization (a) without SFFM (control) and (b) with SFFM.

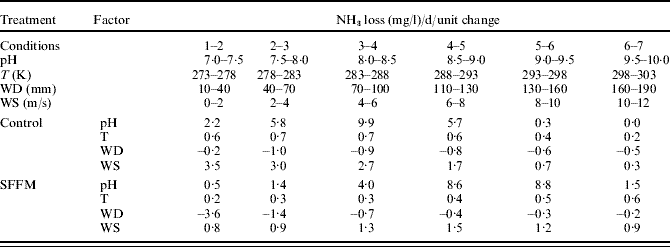
Further sensitivity analysis with respect to pH, T, WD and WS was conducted under the different conditions, shown in Table 2. The most sensitive phase of NH3 volatilization (i.e. the sections with the steepest slope) for the control samples occurs at pH 8·0–8·5 (i.e. 9·9 mg/l/d NH3 loss/d/unit change, but 4·0 mg/l/d in the presence of SFFM), temperature of 278–288 K (0·7 mg/l/d NH3 loss without SFFM decreasing to 0·3 mg/l/d with SFFM) and WS of 0–2 m/s (3·5 mg/l/d NH3 loss without SFFM decreasing to 0·8 mg/l/d with SFFM) (Table 2, Fig. 4). However, when 4 g/m2 SFFM was applied, the sensitivity phase of NH3 volatilization at the rate shifts to pH 9·0–9·5 temperature of 288–293 K and WS interval of 6–8 m/s (Table 2 and Fig. 4b). The effect of WD on NH3 volatilization loss showed a complex interaction with the absence or presence of SFFM.
Calculated increments of ammonia loss rates to increments of pH, T, WD and WS in the absence (control) and presence of SFFMFootnote *
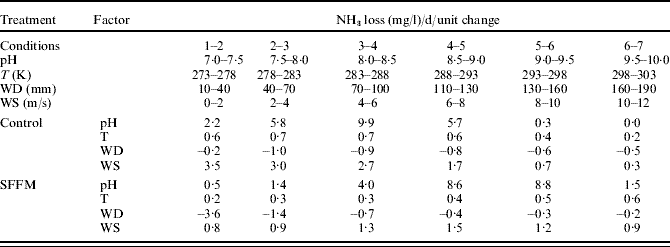
* The initial condition and intervals are the same as indicated in Fig. 4.
DISCUSSION
Ammonia volatilization from the paddy field and model simulation
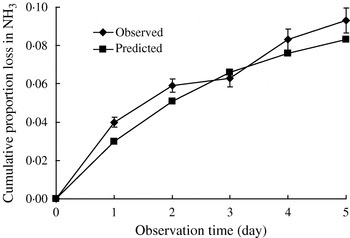
According to the relationship between SFFM application rate and k f obtained from the pan experiment, the original k f value in the field (at SFFM addition of 3·5 g/m2) can be calculated as k f=2·07 mm/h and the variations of its values with time also are calculated with eqn (6). Thus, the NH3 volatilization from the paddy field is simulated and predicted as shown in Fig. 5. Obviously, a better prediction for NH3 volatilization can be obtained with the J–M modified model (Fig. 5). Field observation of NH3 concentration in the surface water can be expressed as the predicted concentration as: Observed[NH3]=1·063×Predicted[NH3] (R 2=0·9454; P<0·01). The predicted value is slightly less than the field observation because the effect of SFFM is influenced by complex environmental factors. The simulated pan experiment can only partially explain the effects. Therefore, the J–M model method is effective in the simulation of short-term NH3 volatilization from the paddy field. The modified model method is useful to screen and verify new SFFM for further study.
Observed and predicted levels of NH3 volatilization from the paddy field.

As indicated by the J–M model simulation, SFFM application can be an effective technique to reduce NH3 volatilization from flooded rice fields under the conditions of high temperature and WS. The simulation method can be employed to screen more effective materials for surface films in order to improve nitrogen use efficiency and mitigate its environmental pollution. However, the inhibition effect of SFFM on NH3 emission in the paddy field is slightly lower than that in the pan experiments. This J–M simulation model is only capable of assessing the application rate of SFFM to reduce NH3 volatilization effectively in the pan experiment for a short time and limited k f values. High rates of SFFM self-agglomeration (i.e. at 8 g/m2) may account for the reduction of NH3 loss inhibition effect. Meantime, NH3 volatilization loss also increases with time due to the degradation and decomposition of SFFM (Cai et al. Reference Cai, Freney, Humphreys, Denmead, Samson and Simpson1987). Thus, the present SFFM experiments were conducted over a short time (6 h) rather than using a prolonged reaction time for the calculation of SFFM effectiveness. Together with the calculation of k f changes, a better prediction of NH3 volatilization with prolonged reaction time, new SFFM compounds and applicability to paddy fields merit further study.
The authors thank the National Natural Science Foundation of China (40671109) for their financial support.