A case of coronavirus disease 2019 (COVID-19) reported in the state of Washington on January 21, 2020 heralded the arrival of the pandemic in the United States (U.S.), but neighboring states were spared for over a month. While Idaho borders Washington, it and 4 other contiguous western states—North Dakota, South Dakota, Montana, and Wyoming—did not report a single case until 49 d later. 1 All 5 states are sparsely populated with 74% of the population living in a “frontier” region that is at least 60 min away from an urban area. 2–4 Due to demographic heterogeneity, and the division of power between federal and state governments, the reaction to various phases of the pandemic have differed in type and timing by region, resulting in dissimilar patterns of disease spread around the country. Reference Bergquist, Otten and Sarich5 More regional studies are needed to assess the variation in the spatial heterogeneities of the transmission of the severe acute respiratory syndrome coronavirus 2 (SARS-CoV-2) and the distribution of disease burden. In this study, we will analyze the disease pattern in North Dakota, South Dakota, Idaho, Montana, and Wyoming to provide insight for epidemiologists and to help policy-makers with future decision-making processes.
Orders from the executive branch of federal and state governments and state health officer orders regarding the COVID-19 pandemic included social distancing, quarantine and isolation, mask mandates, closure of businesses, and COVID-19 testing requirements. These were implemented in different time frames across this 5-state region. Evaluating the existing data to explore the impact of policy implementation on COVID-19 pandemic may provide insight on the policies with high impact in reducing the transmission of SARS-CoV-2 infection, morbidity and mortality. Quantifying epidemiologic characteristics of the COVID-19 pandemic in these states, so that we can document the potential effect of policies and nonpharmaceutical interventions that reduce COVID-19 transmission and mortality, may make us better prepared for the emergence of future infectious disease epidemics.
Central to the description of an epidemic’s transmission potential is the reproduction number. The basic reproduction number, also called R 0 , shows the transmissibility of an infectious agent at the beginning of an outbreak; it is calculated as the average number of secondary cases generated by a primary case in a completely susceptible population, before any behavioral changes or public health interventions. Reference Vynnycky and White6 On the other hand, the time-varying reproduction number, also known as R t , is a time-dependent estimate of the average number of secondary cases that are generated from 1 case at time t, after there are behavioral changes, depletion of the susceptible population, and implementation of disease control policies. Reference Thompson, Stockwin and van Gaalen7,Reference Cori, Ferguson and Fraser8
An R t larger than 1 indicates sustained transmission and the epidemic is expected to expand in the population. An R t less than 1 indicates that the epidemic is declining. Therefore, it is used as an indication of the effectiveness for infection control measures. Reference Vynnycky and White6,Reference Thompson, Stockwin and van Gaalen7 Calculating R t over the course of pandemic, from March 2020 through January 2021, this study aims to investigate the time-dependent variability in transmission potential of SARS-CoV-2 in these 5 states in different time periods, and explore their relationship with the changes in the states’ public health policies.
Methods
We used time-series data for the COVID-19 pandemic during March 10, 2020 to January 10, 2021, in the states of North Dakota, South Dakota, Idaho, Montana, and Wyoming. A detailed list and description of all counties (North Dakota’s 53 counties, South Dakota’s 66 counties, Idaho’s 44 counties, Montana’s 56 counties, and Wyoming’s 23 counties) are provided in Supplementary Table 1.
Data Acquisition
We downloaded the cumulative confirmed case count during March 10, 2020, to January 10, 2021, for all 5 states, including the counties located in each state from the New York Times GitHub data repository. 9 The first case of each state was reported during the same week, on March 10 (South Dakota), March 11 (North Dakota and Wyoming), and March 13 (Idaho and Montana), respectively. Our cutoff point for all 5 states was January 10, 2021. Our timeframe covered nearly 10 mo from the first reported case in those states. We obtained the daily number of newly confirmed COVID-19 cases from the reported cumulative case count numbers (Supplementary Materials Appendix A). We also retrieved 2019 county-level estimated population data and average population density by square kilometer for all 5 states from the US Census Bureau. 10,11
We collected and assessed the executive orders from the governors’ offices of the 5 states and identified the timing of the orders to implement and the announcements permitting relaxation of public health interventions in each state, respectively (Supplementary Table 2).
Statistical Analysis
We estimated the time-varying reproduction number, R t , using the instantaneous reproduction number method with parametric definition of the serial intervals as proposed by Cori et al. Reference Cori, Ferguson and Fraser8 as implemented in the R package “EpiEstim” version 2.2-3. The instantaneous reproduction number is 1 of a few definitions of R t . It is an estimate of the transmissibility of the disease at current time t, assuming that it is the same as the transmissibility of prior cases that result in the number of their secondary cases at current time t. An average R t can be estimated using a fixed sliding window or non-overlapping time windows defined by the user. R t is a time varying measure of transmissibility and defined as the ratio between the number of incident cases at the time t, and the total infectiousness of all infected individuals at the time t accounted during their infectious periods. As county-level data may give information of health inequities, or information in differences in COVID-19 transmission rate, Reference Richmond, Tome and Rochani12 we conducted our analysis based on county level data. We first reconstructed the date of infection according to Gostic et al., Reference Gostic, McGough and Baskerville13 by shifting the time series by 9 d backward (assuming a mean incubation period of 6 d and a median delay to testing of 3 d). 14 We assumed the serial interval distribution with a mean of 4.60 d and a standard deviation of 5.55 d. Reference You, Deng and Hu15 Besides using the default 7-d sliding window, we also estimated R t by the nonoverlapping time periods when different combinations of nonpharmaceutical interventions (ie, face masking, social distancing, school, and business closure, etc.) have been implemented (we call them policy change R t thereafter). The policy change R t is the average of the daily R t over the nonoverlapping time period between 2 major policy changes.
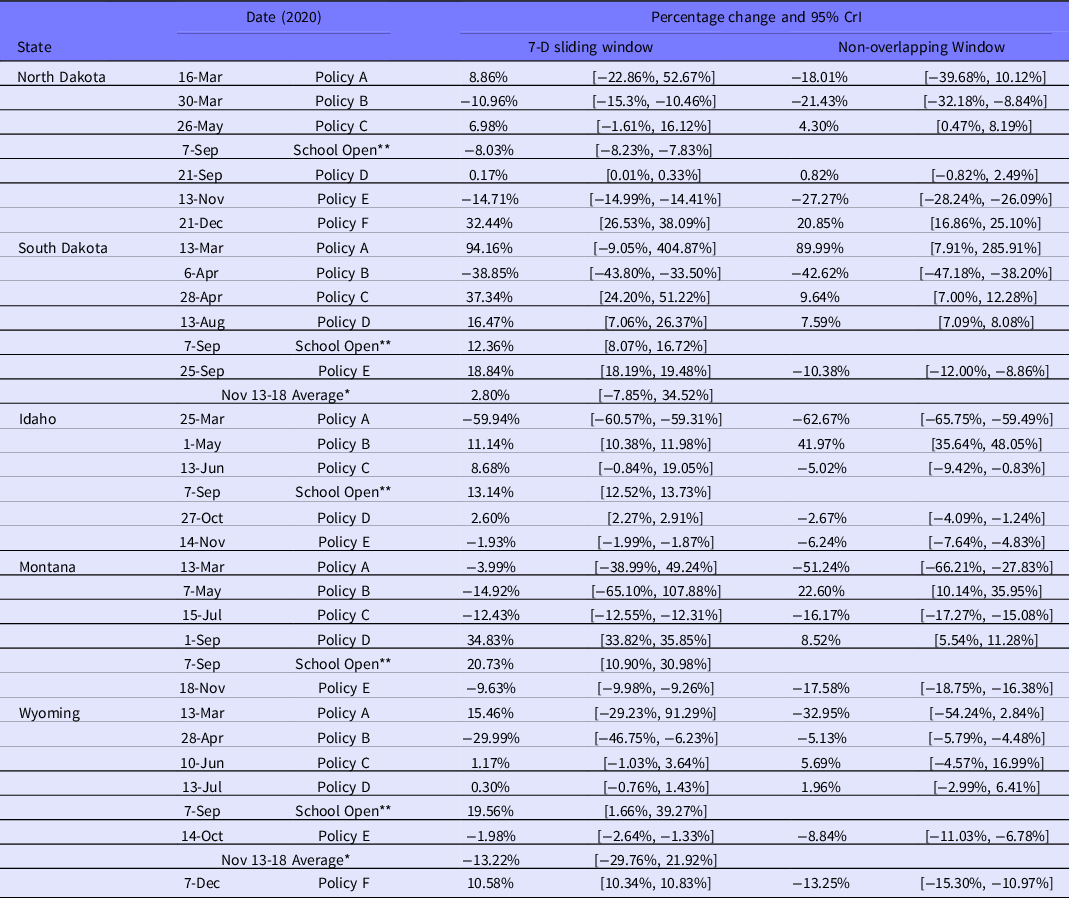
Percentage change is often used to help identify the magnitude and direction of change in a statistic. We calculated percentage change for both the 7-d sliding window R t and the policy change R t (Table 1). This was calculated using percentage change = (t 2 – t 1)/t 1 ×100, at the date of each policy implementation and face-to-face school resumption. For 7-d sliding window R t , each date of interest is considered time 2 (t2) and the previous 7-d period was used as time 1 (t1); for the policy change R t , each time window was compared with the previous window. We used EpiEstim “sample from the posterior R distribution” function to sample 1000 estimates of R t for each t1 and t2 then estimate the 95% credible intervals (2.5 and 97.5 percentile) of the calculated percentage change through bootstrapping.
Percentage change of Rt and 95% credible intervals (CrI) at policy implementation and important dates calculated with both 7-d sliding window and non-overlapping window

* Neither South Dakota nor Wyoming had any policy change during this time-period of interest so bootstrapping was performed on the average of the 6-d range of policy implementation from the other 3 states.
** As of September 7, 2020, all states had resumed face-to-face K-12 education.
Note: Policy labels: North Dakota: A = Schools closed; B = Promote physical distancing; C = Testing order; D = Lifted travel and quarantine order; E = Mask order; F = Allow all restaurants and bars to resume normal hours. South Dakota: A = State of Emergency declared; B = Minnehaha and Lincoln stay at home order; C = All citizens shall implement ‘back to normal plan’; D = All K-12 schools were mandated to start in-person classes again; E = long-term facilities began to relax visitor restrictions. Idaho: A = Statewide stay home order; B = Stay Healthy Order-Stage 1. Businesses and governmental agencies resumed operations at physical locations; C = Stay Health Order-Stage 4. Gatherings of any size were allowed and non-essential travel could resume; D = Stay Health Order-Stage 3. Patrons of bars, nightclubs, and restaurants must remain seated. Face coverings were required at long-term care facilities; E = Stay Health Order-Stage 2. Gatherings of no more than 10 people, and vulnerable population were strongly recommended to stay at home. Montana: A = State of Emergency declared; B = School reopened; C = Statewide mask requirement; D = School’s Fall semester started; E = Additional mitigation measures were implemented including reduced size of gatherings to no more than 25. Wyoming: A = All businesses and schools were closed; B = Gymnasiums and childcare facilities were reopened; C = K-12 schools, colleges, universities, and trade schools resumed on-site instructions; D = Removed some conditions and restrictions were applicable to restaurants; E = Additional mitigation measures were implemented including reduced size of gatherings to no more than 50; F =Required face coverings in certain places with exceptions.
As a note, R t percentage change was calculated for the fall implemented interventions of North Dakota on November 13 (Mask order), Idaho on November 14 (Stay Health Order-Stage 2: Gatherings of no more than 10 people, and vulnerable population were strongly recommended to stay at home), and Montana on November 18 (additional mitigation measures were implemented including reduced size of gatherings to no more than 25). Because neither South Dakota nor Wyoming ever ordered interventions during the same time period, for comparison purposes we calculated the 7-d-sliding-windows R t percentage change for both states with November 13-18, 2020 as t2 and November 6-11, 2020 as t1.
We ran 2 linear regression models; 1 was between log10-transformed per capita cumulative case count and log10-transformed population size, and the other was between log10-transformed per capita cumulative case count and log10-transformed population per square kilometer. Counties with lower population sizes or population per square kilometer would have a higher per capita cumulative case count if the slope of the regression line was negative, and a lower per capita cumulative case count if the slope was positive. Reference Chowell, Bettencourt and Johnson16–Reference Politis, Hua and Ogwara19 We conducted the log-linear regression considering 4 different dates: June 30, August 31, October 31, and December 31, 2020. We noted that the regression model for population size assumed a power-law relationship between cumulative case count and population size, but the model for population density did not assume a power-law relationship between cumulative case count and population density (Supplementary Materials Appendix B).
To further explore the relationship between the per capita weekly incident case count and county’s population size, log linear analysis was performed as univariable and multivariable analysis. Multivariable models were adjusted for time (more specifically a categorical variable of each 7-d period from March 2020 to January 2021) and other factors that may impact this association. Those other factors were variables that we chose from the Centers for Disease Control and Prevention (CDC) Social Vulnerability Index (SVI), which was created by Geospatial Research, Analysis & Services Program to identify and map the most vulnerable communities with a need for support in emergency events. 20 CDC uses the US census data to estimate the social vulnerability for every census tract and every county in each state. The SVI is composed of many variables which are categorized in 4 different themes (socio-economic status, household composition and disability, race/ethnicity/languages, and housing type/transportation). In times of COVID-19, it becomes meaningful to account for social vulnerability variables when assessing the relationship between weekly incident case count per capita and population size. Those variables may partially explain the variability of weekly incident case count per capita. Among many variables included in the SVI database, we chose those variables we thought were more representative and had less collinearity with each other. The chosen variables were the percentage of people living below the poverty threshold, the percentage of people without a high school diploma, the percentage of people 65 and older, the percentage of the civilian noninstitutionalized population with a disability, a dichotomous variable of minority (all people excluding white, non-Hispanic; using the median percentage minority for all the counties of the 5 states together as the cutoff point), and the percentage of occupied housing units with more people than rooms estimate. We obtained our data from the Agency for Toxic Substances and Disease Registry. 21
All statistical analyses were performed using R version 4.0.3 (R Core Team, R Foundation for Statistical Computing, Vienna, Austria). Maps (Figures 1 and 2) were created using R version 3.5.1 (R Core Team, R Foundation for Statistical Computing, Vienna, Austria). The significance level was set a priori at α = 0.05.
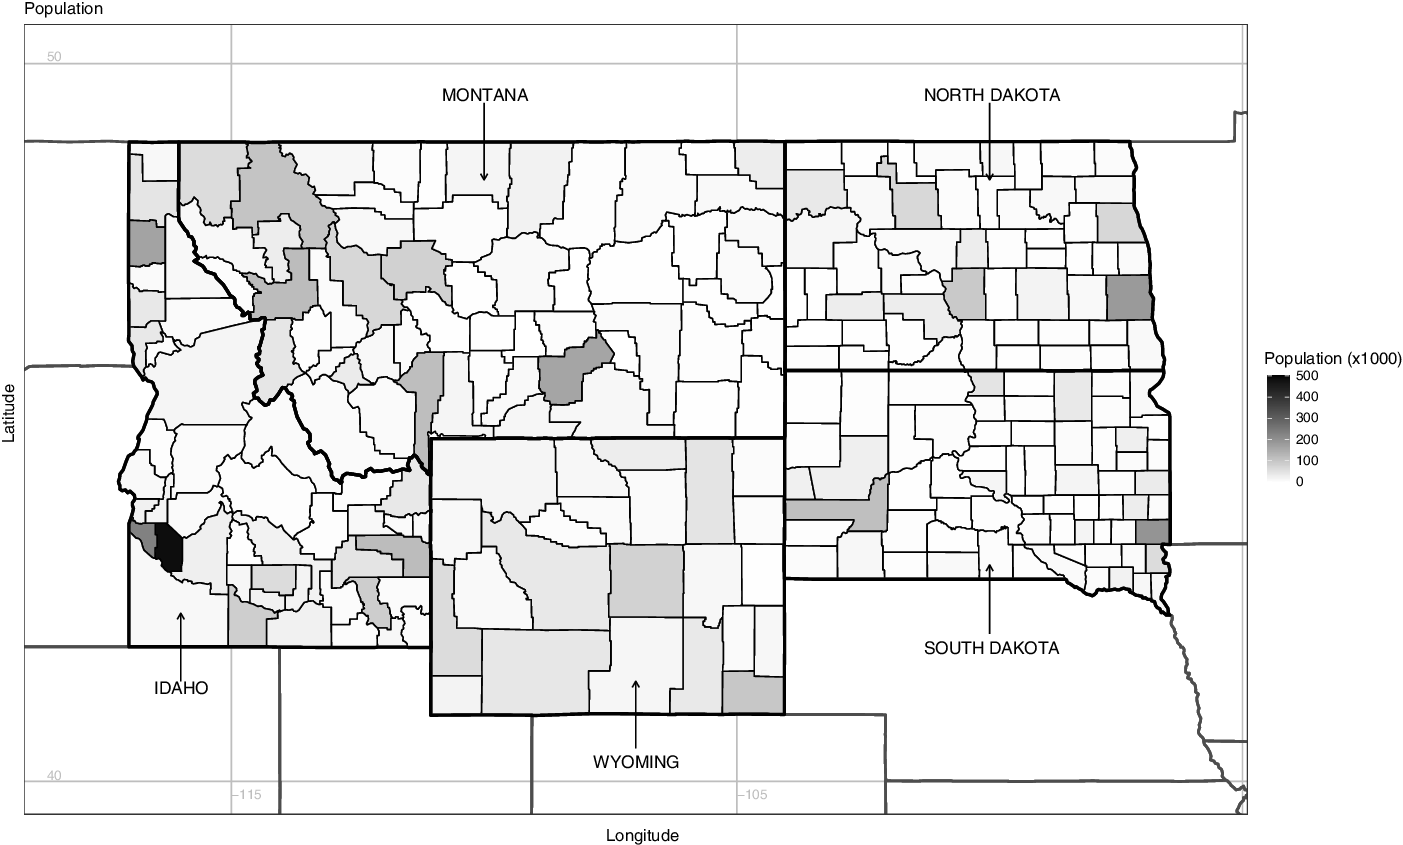
County-level population map (2019) of North Dakota, South Dakota, Idaho, Montana, and Wyoming, USA.

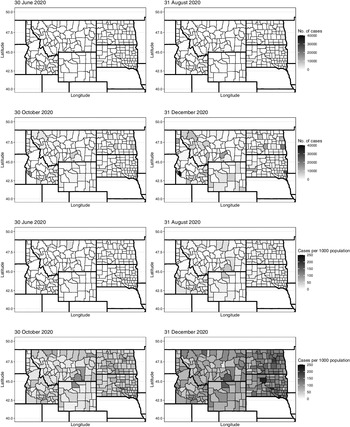
County-level maps of North Dakota, South Dakota, Idaho, Montana, and Wyoming by cumulative case count (top 4 maps), and cumulative case counts per 1000 population (bottom 4 maps) on June 30, August 31, October 31, and December 31, 2020 (date of report).

Ethics
The Georgia Southern University Institutional Review Board made a non-human subject determination for this project (H20364) under the G8 exemption category according to the Code of Federal Regulations Title 45 Part 46.
Results
Rt Estimates at the State Level
From March 10, 2020 to January 10, 2021, the daily number of new cases showed at least 1 peak in the Fall across all 5 states, except Idaho which had a summer peak (Figure 3, left panel). All 5 states had a very similar qualitative trajectory. For instance, as of January 10, 2021, Idaho had reported 149,742 cases, the highest cumulative numbers of COVID-19 cases among 5 states. South Dakota had reported 113,318 cases, North Dakota 94,724 cases, Montana 86,324 cases, and Wyoming 46,832 cases. Figure 2 presents the geospatial dynamics of cumulative cases number and cumulative case number per 1000 population (incidence) by county in 5 states at 4 different dates of report between March 10, 2020, and January 10, 2021: June 30, August 31, October 31, and December 31, respectively.
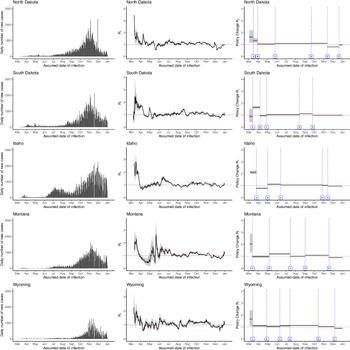
The daily number of new cases by their assumed date of infection (left panel), 1-week sliding window R t estimates (middle panel), and non-overlapping window R t estimates by policy change (right panel) of North Dakota, South Dakota, Idaho, Montana, and Wyoming, USA, March 10, 2020 – January 10, 2021 (date of report).
North Dakota: A = Schools closed; B = Promote physical distancing; C = Testing order; D = Lifted travel and quarantine order; E = Mask order; F = Allow all restaurants and bars to resume normal hours. South Dakota: A = State of Emergency declared; B = Minnehaha and Lincoln stay at home order; C = All citizens shall implement ‘back to normal plan’; D = All K-12 schools were mandated to start in-person classes again; E = long-term facilities began to relax visitor restrictions. Idaho: A = Statewide stay home order; B = Stay Healthy Order-Stage 1. Businesses and governmental agencies resumed operations at physical locations; C = Stay Health Order-Stage 4. Gatherings of any size were allowed and non-essential travel could resume; D = Stay Health Order-Stage 3. Patrons of bars, nightclubs, and restaurants must remain seated. Face coverings were required at long-term care facilities; E = Stay Health Order-Stage 2. Gatherings of no more than 10 people, and vulnerable population were strongly recommended to stay at home. Montana: A = State of Emergency declared; B = School reopened; C = Statewide mask requirement; D = School’s Fall semester started; E = Additional mitigation measures were implemented including reduced size of gatherings to no more than 25. Wyoming: A = All businesses and schools were closed; B = Gymnasiums and childcare facilities were reopened; C = K-12 schools, colleges, universities, and trade schools resumed on-site instructions; D = Removed some conditions and restrictions were applicable to restaurants; E = Additional mitigation measures were implemented including reduced size of gatherings to no more than 50; F =Required face coverings in certain places with exceptions.

The 7-d-sliding-window R t estimates were between 2 and 3, in the beginning of the pandemic across all 5 states. In Idaho, Montana, and Wyoming, the 7-d-sliding-window R t estimates dropped below 1 in the early-April; and in North Dakota and South Dakota, the 7-d-sliding-window R t estimates briefly drop below 1 in mid-May. Then the 7-d-sliding-window R t estimates steadily stayed above 1 between September and December which correspond to the fall/winter surges in 5 states. At the end of the study period, the 7-d-sliding-window R t estimates were slightly above 1 (Idaho, Montana, and Wyoming) or around 1 (North Dakota and South Dakota), demonstrating the extensive community transmission of SARS-CoV-2 in those states.
As of September 7, 2020 all students in K-12 grades resumed face-to-face instruction in all 5 states. Compared with the week prior, the 7-d-sliding-window R t increased in Montana, Wyoming, Idaho, South Dakota; whereas North Dakota saw a reduction in R t (Table 1; Figure 3, right panel). Thus, these 5 states experienced an average of 11.55% increase in the 7-d-sliding-window R t .
Following the region’s fall surge in cases, North Dakota implemented a mask mandate on November 13 (Policy E) which contributed to a 14.71% decrease in R t . Idaho saw a 1.93%, and Montana a 9.63% decrease in R t following the implementation of stricter policies (Policy E, respectively). Meanwhile in mid-November 2020, neither Wyoming nor South Dakota implemented any additional restrictions seeing differing effects on R t ; Wyoming’s R t decreased by 13.22% where South Dakota’s R t increased by 2.8%.
Percentage change in policy change R t were computed by comparing each time window (between each major policy change) to the previous (Table 1). Detailed description of R t for each state can be found in Supplementary Materials Appendices C and D.
Urban-Rural Disease Burden Disparities
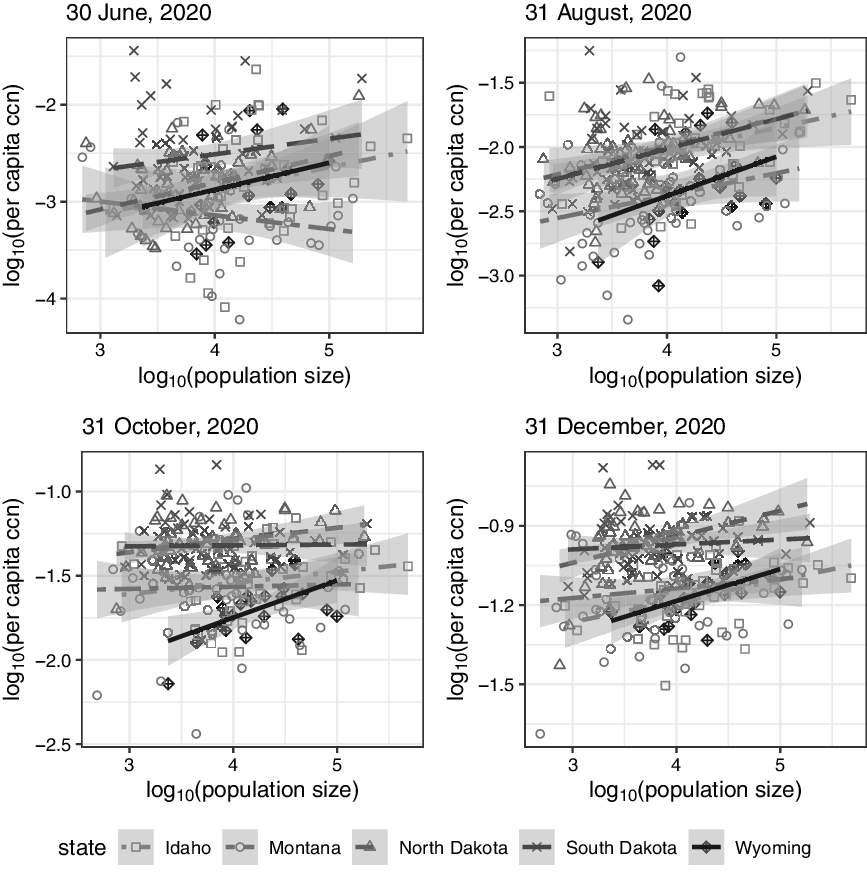
The US Census Bureau defined the urban and rural areas based on the population size (ie, urbanized areas have a population of 50,000 or more and urban clusters have a population of at least 2500 and less than 50,000). 22,23 To assess the heterogeneity in disease burden between urban and rural counties, a linear regression model was constructed between the log10-transformed per capita cumulative case number and the log10-transformed population size for a total of 242 counties in North Dakota, South Dakota, Idaho, Montana, and Wyoming (Figure 4). Each panel corresponds to an assessed date (date of report), June 30, August 31, October 31, and December 31, 2020, respectively; each regression line represents a state in a specific assessed date. The slope, m, and its 95% confidence interval of every regression line are presented in Supplemental Table 3. North Dakota was the only state that had significant slopes at all 4 time points (m = 0.2758, 0.2171, 0.0729, 0.0986; P = 0.0034, 0.0018, 0.046, 0.0024, respectively). Overall, the slopes of regression lines at 4 different assessed dates were found slightly positive in June and August assessments but very close to zero in October and December assessments as the pandemic unfolded, except that of Montana on June 30, 2020. This meant, toward the end of 2020, there was no heterogeneity of per capita cumulative case count across 242 counties with different population size, suggesting an extensive community transmission of SARS-CoV-2 as the pandemic progressed. However, as we mentioned previously, the slope of Montana’s June regression line (−0.1423) was slightly less than zero. When m < 0, it suggests counties with lower population sizes would experience a higher per capita cumulative case count. In other words, the rural counties in Montana experienced a slightly higher impact of the COVID-19 pandemic than other counties in the same state by mid-2020. Supplementary Materials Figures S1-S5 present the same regression analyses, separately for each state, with outliers in log-transformed per capita cumulative case number highlighted.
Linear regression between log10-transformed per capita cumulative case number (ccn) and log10-transformed population size by county (grouped in states) for North Dakota, South Dakota, Idaho, Montana, and Wyoming on June 30, August 31, October 31, and December 31, 2020 (date of report).

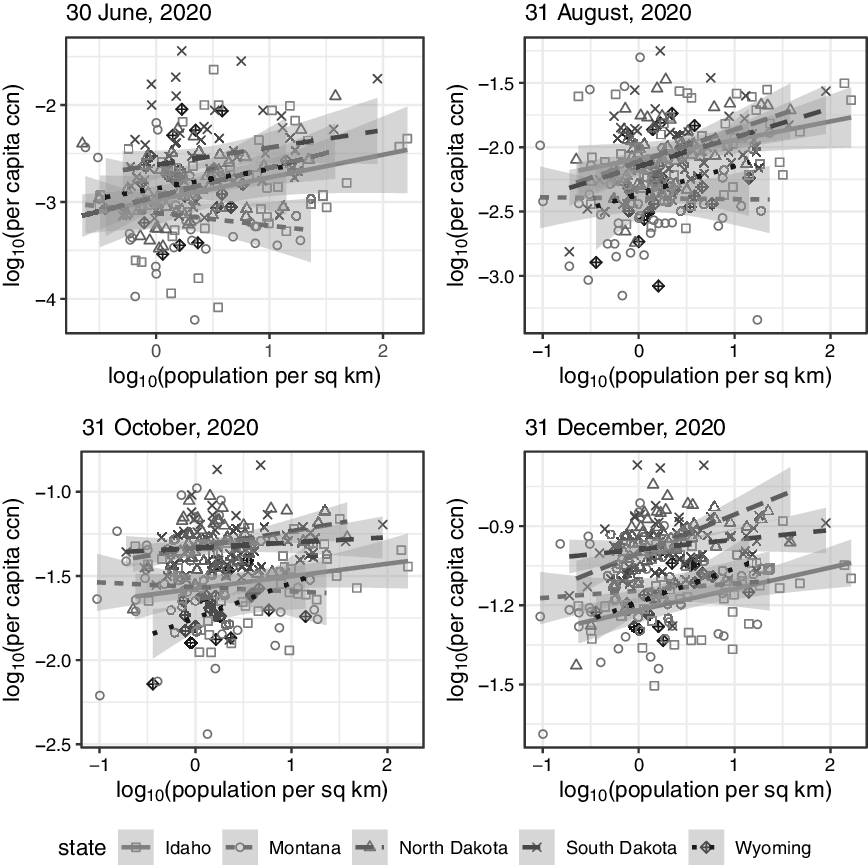
In addition, we performed a sensitivity analysis using population density instead of population size. Figure 5 presents a linear regression relationship between the log10-transformed per capita cumulative case number and the log10-transformed population per square kilometer for all counties in the 5 abovementioned states at the same 4 assessed dates. The slope, m, and its 95% confidence interval of every regression line are presented in Supplemental Table 4. North Dakota was the only state that had significant positive slopes at all 4 time points (m = 0.2986, 0.2495, 0.0974, 0.1473; P = 0.0062, 0.0021, 0.0208, < 0.0001; respectively). Positive slopes were found for South Dakota on August 31, 2020 (m = 0.2273); for Idaho, on August 31 and December 31, 2020 (m = 0.1455, 0.0808, respectively); and for Wyoming, on October 31 and December 31, 2020 (m = 0.2084, 0.1285, respectively). The results suggested that the counties with a higher population density in North Dakota, South Dakota, Idaho, and Wyoming, experienced a higher per capita cumulative case count in certain times over the study period.
Linear regression between log10-transformed per capita cumulative case number (ccn) and log10-transformed population per square kilometer by county (grouped in states) for North Dakota, South Dakota, Idaho, Montana, and Wyoming on June 30, August 31, October 31, and December 31, 2020 (date of report).

Multiple Regression Analysis Between Per Capita Weekly Incident Case Count and Population Size, Adjusted for SVI Variables
Linear regression results for evaluating the relationship between log10-transformed per capita weekly incident case count and log10-transformed population size is shown in Table 2. Each 10-fold increase in population size, after adjusting for the time of data collection (therefore, adjusting for different policies running in the state or different stages of the pandemic), was associated with an increase of 0.06-0.27 in the log10-transformed per capita weekly incident case count, in the studied states and all these changes were statistically significant. After controlling for SVI confounders, in addition to time, a positive trend was found in the association between population size and per capita weekly incident case count in Idaho, North Dakota, South Dakota, and Wyoming. However, the coefficient was not statistically significant for Montana. Correlation plots of the variables in these regression models by state are presented in Figures S6-S10 in the Supplementary Materials.
The linear regression analysis between log10-transformed per capita weekly incident case count and log10-transformed population size for North Dakota, South Dakota, Idaho, Montana, and Wyoming, March 2020 -January 2021*

*p<0.05.
† Note: Adjusted for below poverty variable, the percentage of people without high school diploma, minority, the percentage of people with a disability, the percentage of crowding, the percentage of people 65 years and older, and for weeks.
Discussion
From March 2020 through January 2021, North Dakota, South Dakota, Idaho, Montana, and Wyoming have taken various approaches on implementing both policy and health guidelines to reduce the community transmission of SARS-CoV-2. Using both the 7-d-sliding window R t and policy change R t , we estimate the change in transmission potential over time and after each major policy change. Throughout the initial spring and summer surges across the US coastal and major metropolitan areas, limited community spread of the virus was observed in the 5 states. Although we did not observe a corresponding surge in reported case numbers in South Dakota in August, the 7-d-sliding-window R t has a small peak, suggesting there was community transmission related to Sturgis Motorcycle Rally, that was held in Meade County, South Dakota, August 7-16, 2020. Dave et al., Reference Dave, McNichols and Sabia24 and Carter et al., Reference Carter, Rose and Sabo25 assessed the nationwide transmission of SARS-CoV-2 following the Sturgis Motorcycle Rally and identified it as a superspreading event. However, entering fall 2020, this region began to see an uptick in case counts ultimately leading a peak seen in late November. During the summer, reopening orders were given and between mid-August and September 1, all 5 states resumed face-to-face K-12 schooling. Many of the universities also began in-person instruction. By September 7, the R t in all 5 states had increased by an average of 11.55%.
This study used 7-d sliding window R t estimates and policy change R t estimates to assess and evaluate the various non-pharmaceutical interventions and policy changes at the state level for North Dakota, South Dakota, Idaho, Montana, and Wyoming. A few studies have accessed the effectiveness of mitigation measures, especially regarding face mask mandate and school reopening. Reference Muniz-Rodriguez, Chowell and Schwind26–Reference Leung, Wu and Leung28 Among the 5 states, North Dakota, Montana and Wyoming implemented the mask mandate and followed with the R t reduction, which echoed with the current existing body of research on the efficacy of face masking in preventing the transmission of SARS-CoV-2. Reference Herstein, Degarege and Stover29–Reference Liang, Gao and Cheng31 However, South Dakota and Idaho also experienced the R t reduction without adopting the mask mandate, perhaps due to voluntary adoption of facemasks, which will require further investigation.
Furthermore, we observed an increase in R t after schools (K-12 schools, colleges, and universities) reopened in South Dakota, Idaho, Montana, and Wyoming, except North Dakota. The detailed R t description for all 5 states regarding school reopening are provided in Supplementary Materials Appendix C. School closure and suspended in-person instruction were considered to be 1 of the major public health interventions, and its effectiveness was widely discussed and researched. Our research results suggest that school reopening is correlated with an increase in R t estimates; however, the results contradicted with the existing studies that the in-person instruction posed a low risk of transmission of SARS-CoV-2. Reference Fricchione, Seo and Arwady32–Reference Zimmerman, Akinboyo and Brookhart34 This might reflect a concurrent change in social contact patterns when parents returned to workplaces after their children went back to schools. School closure as a mitigation strategy requires further research on its effectiveness because it is highly related to school-aged children, adolescents, and young adults’ physical health, mental health, and quality of life. Reference McGuine, Biese and Petrovska35
North Dakota had a higher cumulative case count per capita in the counties with higher population sizes and the counties with higher population densities; however, the reason of why North Dakota was the only state of the 5 states under study that had statistically significant slopes (m) for the regression lines at all 4 assessed time points requires further investigation. Our analyses did not suggest any consistency over time in the heterogeneity of cumulative case count between urban and rural counties, or between densely populated and sparsely populated counties in the other 4 states.
When adjusting for SVI variables, our study found a positive significant association between log10-transformed per capita weekly incident case count and log10-transformed population size for Idaho, North Dakota, South Dakota, and Wyoming, while the association was insignificant for Montana. Concretely, a 10-fold increase in population size was associated with a 0.102 increase in log10-transformed per capita incident case count in Idaho, 0.165 increase in North Dakota, 0.120 increase in South Dakota, and 0.281 increase in Wyoming. The positive significant associations meant that high-population counties had a higher per capita incident case count than low-population counties. This finding is in line with the study by Wong and Li Reference Wong and Li36 where US counties with more people were more likely to have larger numbers of cases especially in late Spring and early Summer 2020, and the study by McLaughlin et al. Reference McLaughlin, Khan and Pugh37 who emphasized the association of COVID-19 case rate with densely populated counties, urban counties and crowded housing.
Limitations
There are some limitations in our study. First, upticks in cases may be due to external events attracting large crowds, such as a July 4, 2020, outdoor rally by the then President Trump at Mt. Rushmore, South Dakota, and a motorcycle rally in Sturgis, South Dakota in August 2020. It is impossible to distinguish local cases that were associated with the Sturgis Motorcycle Rally from those that were not using the aggregate data. Others have found evidence suggesting that the motorcycle rally might be a superspreading event, leading to at least 649 cases nationally that were associated with transmission chains traced back to the event, and Meade County (where the Rally was) experiencing a faster rate of growth in case rate than the rest of South Dakota, a week after the close of the Rally. Reference Dave, McNichols and Sabia24,Reference Carter, Rose and Sabo25 The latter event occurred just before school opening and its independent effect on R t increase may be difficult to tease out. Second, the date of symptom onset or the date of (unobserved) infection was not available for our dataset. Only the date of report was available. To correct for the time lag, we shifted the epidemic curve by 9 d to correct for the incubation period and the delay to test results. Third, our dataset lacked information to distinguish between local and foreign imported cases. However, such distinction was mostly important in the early stages of the epidemic and, since April 2020, community transmission was the main driver for the epidemic. Therefore, we argue that the absence of this distinction would not have significantly affected R t estimates since April 2020. Fourth, we used aggregated numbers of reported cases by political jurisdictions instead of separate data on different facilities or settings, while each setting might demonstrate a different dynamic than that of community transmission. Fifth, underreporting due to the limits on testing capacity was especially acute at the beginning of the pandemic. The majority of the states issued orders to increase testing capacities between March and April 2020 attempting to overcome this challenge. However, with approximately three-quarters of the target area classified as “frontier” or rural, testing resources likely remained limited and strained. Additionally, mild and asymptomatic cases are unlikely to get tested and confirmed. Thus, state-reported data cannot be used to measure the extent to which asymptomatic spread has progressed during the pandemic and the study findings could be confounded by this and other under-reporting. Sixth, government orders to undertake a mitigation practice, and actual compliance, may differ, which is a recognized limitation in the data. Reference Nivette, Ribeaud and Murray38,Reference Crane, Shermock and Omer39 Last, the indigenous populations that make up an estimated 4.3% of the total target population (ID 1.7%, MT 6.6%, ND 5.7%, SD 9.0%, WY 2.8%) 40,41 residing in 25 recognized reservations and tribes on 7.1% of the total target area (ID 2.4%, MT 9.7%, ND 4.2%, SD 14.6%, WY 3.5%) 4,42 are likely to seek care at 1 of the 65 Indian Health Services facilities. 43 Many of these sovereign nations instituted more stringent tribal public health and emergency codes and policies, Reference Hiraldo, James and Carroll44 for example, their highly successful COVID-19 vaccine campaigns, Reference Foxworth, Redvers and Moreno45 creating more effective public health responses to the pandemic which may be a confounding factor in our analyses.
Conclusions
In North Dakota, South Dakota, Idaho, Montana, and Wyoming, new cases of COVID-19 started to rise in November and peaked in November-December 2020. From March 2020 to January 2021, the R t for North Dakota, South Dakota, Idaho, Montana, and Wyoming fluctuated around 1 (with a range of 0.5 to 1.5 starting from June). Various social distancing policies including stay-at-home order and closing businesses and other protective interventions such as mask requirements appeared to be associated with a reduction in the spread of SARS-CoV-2 and keeping the R t at a low level in the states studied in this study. More stringent public health policies in Idaho, Montana, and North Dakota resulted in an apparent reduction in transmission by 1.2% to 14.7%.
On May 13, 2021, the Centers for Disease Control and Prevention updated their guidelines regarding face coverings indicating that fully vaccinated people do not have to wear masks or practice physical distancing except where required by federal, state, local, tribal, or territorial laws, rules, and regulations. 46 Because individuals fully vaccinated with COVID-19 vaccine still have a small chance becoming infected, this updated guideline is controversial among some health-care professionals and requires further investigation. Reference Rabin47 This study’s findings could provide retrospective evidence to inform state officials and health-care providers the potential effect of nonpharmaceutical interventions that could be used to control the spread of COVID-19 and thus avoid overburdening the health-care systems.
Supplementary material
The supplementary material for this article can be found at https://doi.org/10.1017/dmp.2022.248
Author contributions
Xinyi Hua, Aubrey R.D. Kehoe, Joana Tome, and Mina Motaghi serve as co-first authors.
Conflicts of interest
A.C.S. reports grants through her institution from the National Science Foundation, Cellex and Gilead Sciences. Via a subcontract with Einstein School of Medicine, she has received funding from the National Institutes of Health. She has received personal fees from, and served on an advisory board for, Gilead Sciences. She reports honoraria through third parties funded by Gilead, AbbVie, and Merck; personal fees from National Commission on Correctional Health Care, National Sheriff’s Association, Harris County Sheriff’s Office and California Department of Corrections and Rehabilitation; and travel expenses from bioLytical Sciences and Guardian.