

Introduction
A 2007 survey of horses undertaken by researchers at the Virginia–Maryland Regional College of Veterinary Medicine and the College of Agriculture and Life Sciences at Virginia Tech indicated that 51% of the horses studied were overweight, with 19% qualifying as obeseReference Thatcher, Pleasant, Geor, Elvinger, Negrin, Franklin, Gay and Were1. These numbers were much higher than those reported in a 1998 USDA horse owner survey that suggested only about 5% of US horses were overweight2. With obesity being a risk factor for many health complications in horses, including laminitisReference Field and Jeffcott3, insulin resistanceReference Jeffcott, Field, McLean and O'Dea4, heat stress and potentially other disordersReference Lewis5, it is an important issue to address. In 2007, the National Research Council's ‘Nutrient Requirement for Horses’6 recognized lower calorie requirements for some horses and designated a ‘minimum’ category for ‘easy keepers’. However, there are very little scientific data or research-based recommendations on how to achieve successful weight loss in horses. Hence, many horse owners lack information as to how to feed their horses to maintain a healthy, trimmer body condition. Additionally, data are needed to demonstrate how a weight loss programme may improve the health of the horse. Therefore, the objective of this study was to employ feeding and management practices to facilitate weight loss in overweight horses, while simultaneously monitoring health parameters and generating recommendations for horse owners to assist with equine weight loss efforts.
Materials and methods
Procedures regarding the care and use of animals in this experiment were approved by the Land O'Lakes Institutional Animal Care and Use Committee (IACUC).
Animals
Twenty-three healthy Quarter Horse and Thoroughbred geldings and mares (age 7 ± 2 years, initial BW 584 ± 41 kg; mean ± SD) were utilized and housed at the Longview Animal Nutrition Center (Gray Summit, MO, USA) during the experimental period. The experimental period was 12 weeks long, from November 2006 to January 2007. Prior to the 12-week experimental period, the calorie restriction (DIET) and calorie restriction plus exercise (DIETX) horses were fed a ‘weight gain diet’ consisting of Strategy® and hay at a caloric value approximating 10–15% above maintenance to facilitate weight gain to a body condition score (BCS) of 6.5 or higher. Feeding rates were then adjusted to stabilize body weight (BW) at BCS 6.5–8.0 for 14 days for pre-testing procedures. Control group at weight maintenance (CON) horses were fed to maintain a BCS of 5.0–6.0 prior to the experimental period. Pre-and post-protocol testing occurred within 2 weeks before and after the experimental period. Horses were randomly assigned into three groups. The groupings were as follows: DIET (n = 8, initial BW 579 ± 35 kg, four mares, four geldings, BCS 6.9 ± 0.73 SD) horses received a low-calorie weight control (WC, WellSolve W/C® Horse Feed, Purina Mills, St Louis, MO, USA) feed with grass hay (moderate quality, 1% BW) and no forced exercise. DIETX (n = 7, initial BW 574 ± 26 kg, three mares, four geldings, BCS 6.4 ± 0.89 SD) horses received the same low calorie weight control feed with grass hay (moderate quality 1% BW) and exercise in an Equi-ciser™ (Equi-line Mfg). CON (n = 8, initial BW 594 ± 58 kg, four mares, four geldings, BCS 6.6 ± 0.74 SD) horses received Purina Mills Strategy® feed (Purina Mills) with grass hay (moderate quality 1% BW) and no forced exercise. DIET and DIETX horses were housed individually in 3 × 3 m stalls overnight with group dry lot turnout during the day. All WC feed was offered in individual stalls at 07.00 and 16.00 hours and hay was provided only at 16.00 hours. CON horses were group housed in a dry lot paddock with a shed shelter that also allowed for individual feeding (straight tie stalls) of the Strategy® feed at 07.00 and 16.00 hours, and hay (1% of BW for each horse) was group fed at 16.00 hours. Horses in the CON group were not stalled. For all groups, water and plain salt were available ad libitum.
Experimental feeds
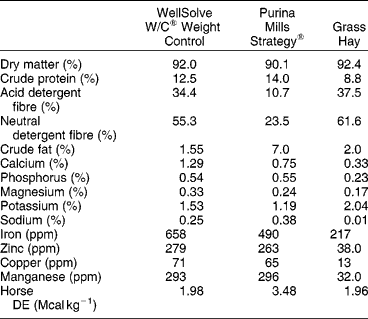
The feeds utilized in the experiment are outlined in Table 1. All analyses were performed by Dairy One Analytical (Ithaca, NY, USA) and are presented on a dry matter (DM) basis.
Laboratory analyses of experimental diets

DIET and DIETX groups received WellSolve W/C and Grass Hay. CON group received Strategy and Grass Hay.
Feeding rates
Feeding rates during the experimental period were determined based on percentage of BW and to provide a calculated negative caloric balance. The WC feed was fed at a rate of 0.5% of BW split into two feedings. WC feed rate for the DIETX group was decreased to 0.3% BW at the halfway point (6 weeks) during the experimental period to continue facilitation of weight loss.
Exercise protocols
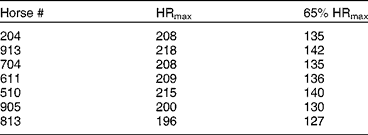
Approximately 2 weeks before and after the experimental period, horses in the DIETX group underwent a high-intensity graded exercise testReference McKeever and Malinowski7 (GXT) on a high-speed treadmill (Equi-Gym Products, Versailles, KY, USA). The GXT was performed on a 6% grade and consisted of warm-up trotting at 4 m s− 1 for 1 min, followed by 6 m s− 1 for 1 min, and then 1 m s− 1 increases in speed every minute until the horse fatigued. Fatigue was defined as the point when the horse could no longer maintain its position on the treadmill despite humane encouragement. On test day, one horse was brought into the treadmill laboratory and a catheter was inserted percutaneously into the left jugular vein, using sterile technique and lidocaine anaesthesia. Catheters were in place at least 45 min prior to the first blood sample taken at time 0. Blood samples were taken at time 0 (before the horse walked on the treadmill) and during the GXT (at the last 10 s of 4 m s− 1 to 10 m s− 1 and velocity eliciting VO2max) for measurement of plasma lactate concentration. Oxygen uptake (VO2) was measured via open-flow calorimetry (Innoventor, St Louis, MO, USA) to determine each horse's VO2max. The Innoventor gas analysis system was calibrated before the start of each exercise test by using gas mixtures with O2 and CO2 concentrations that spanned the measurement range. VO2max was defined as the point at which there were no further increases in VO2 despite increases in speed. These data were utilized to determine changes in horses' fitness after the experimental protocol was completed. Maximum heart rate (HRmax) was also measured via telemetric ECG monitoring (PC Vet, Model ET1, Vmed Technology, Mill Creek, WA, USA). These data were utilized to set the Equi-ciser™ speeds during the experimental period to correspond with an approximate speed that was 65% of the horse's HRmax.
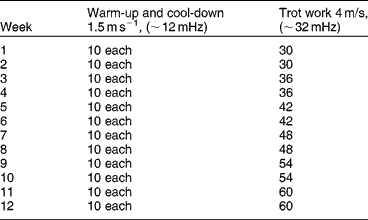
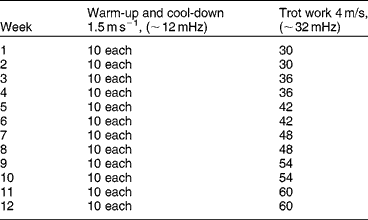
DIETX horses received exercise as follows: each horse exercised 3 days per week at a walk and trot on the Equi-ciser™. Horses worked at an intensity that was c. 65% of HRmax starting at 30 min per session (~4m s− 1). Horses had a warm-up for 10 min and cool-down for 10 min at a walk speed of 1.5 m s− 1. Every 2 weeks, the amount of time spent trotting increased by 6 min to continue increasing energy expenditure as the horses became more fit with the exercise regimen (Table 2). Horses were also grouped by HRmax, with horse #s 905 and 813 working in a separate group with slightly slower Equi-ciser speeds to more closely match 65% HRmax workloads (Table 3). Horses were fitted with heart rate monitors (Polar Electro, Kempele, Finland) weekly to ensure that the workloads were appropriate to maintenance of target heart rates during exercise.
Exercise protocol for DIETX horses in the Equi-ciser™ (min)
Heart rate data gathered during the graded exercise test
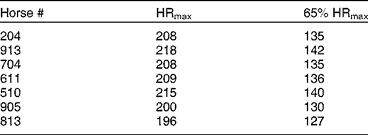
Horses 905 and 813 were exercised in a separate group more closely to match the Equi-ciser™ speed to ~65% of HRmax.
Body measurements
Body weight was measured by electronic scale. All horses had fat depth assessed via ultrasound once every 2 weeks. The protocol for ultrasounding was as follows: ultrasound rump fat at 1/2 sacral bone, 5 cm from midline, based on the recommendations of Westervelt et al. Reference Westervelt, Stouffer, Hintz and Schryver8 All horses were BCS by an independent, trained technician, using the method outlined by Henneke et al. Reference Henneke, Potter, Kreider and Yeates9 at the beginning, midpoint (6 weeks) and end (12 weeks) of the experimental period. The technician was blinded to the treatments.
Frequently sampled intravenous glucose tolerance test and minimal model analysis
One week before the beginning and 1 week after the experimental period, all horses underwent a MODIFIED frequently sampled intravenous glucose tolerance test (FSIGT). The modification involved utilizing less insulin than used for other species, as outlined by Hoffman et al. Reference Hoffman, Boston, Stefanovski, Kronfeld and Harris10 All testing commenced between 06.30 and 07.00 h to decrease any potential for diurnal variation of glucose and insulin response. Horses were given their allotted amount of hay the night before to negate any stressful effects of fasting. On days of testing, the morning concentrate feed was withheld. The protocol for the FSIGT was as follows: an intravenous 14-gauge 5.25 in (13.0 cm) polypropylene catheter (Angiocath, Becton Dickinson & Co., Rutherford, NJ, USA) was inserted into the left jugular vein using sterile technique. Catheterization was performed 45–60 min before the start of the FSIGT procedure to minimize carry-over stress effects. Baseline (time = − 60 (time of catheterization), − 45, − 30, − 15 and 0 min) blood samples were collected. At time = 0, 300 mg kg− 1 dextrose (Agri Laboratories, Ltd, St Joseph, MO, USA) was injected as a bolus of 50% dextrose solution through the catheter, then the catheter was flushed with 10 ml heparinized saline. At time = 20 min, 30 μU units kg− 1 human insulin (Humulin R 100 units ml− 1, Eli Lilly and Co., Indianapolis, IN, USA) diluted in saline was injected through the catheter, followed by 6 ml heparinized saline flush. Blood samples (10 ml each) were subsequently collected via the IV catheter over a total of 3 h. At each time point, 3 ml waste blood was drawn from the catheter, then ~16 ml of blood was collected and transferred to blood tubes, and the catheter was flushed with 5 ml heparinized saline. Samples were collected at time = 0, 1, 2, 3, 4, 5, 6, 7, 8, 10, 12, 14, 16, 19, 22, 23, 24, 25, 27, 30, 35, 40, 50, 60, 70, 80, 90, 100, 120, 150 and 180 min (n = 31 samples test− 1; sample analysis is described under the section headed Biochemical and hormonal assays). All resulting glucose and insulin data from the FSIGT were computer analysed through minimal model analysis using MinMod software (MinMod Millenium, version 6.2; MinMod, Inc., Pasadena, CA, USA) to estimate insulin sensitivity (SI) and glucose effectiveness (Sg). The incremental first-phase acute insulin response to glucose (AIRg) was determined by calculating the AUC-insulin above the baseline in the first 10 min after glucose infusion. The disposition index (DI, the product of SI and AIRg), was calculated as a measure of pancreatic cell function that captures both the SI and the ability of the cell to secrete insulin in response to the prevailing SI.
Biochemical and hormonal assays
For plasma analyses, blood was collected using Kendall Monject plasma collection tubes with potassium oxalate and sodium fluoride anti-coagulant additives. For serum analyses, blood was collected using Kendall Corvac serum separator tubes (Tyco Healthcare, Mansfield, MA, USA). All blood tubes were immediately centrifuged at 2000 rpm for 15 min then plasma and serum were aliquoted and frozen at − 20° C for later analyses. Plasma concentrations of glucose were determined in duplicate using an Infinity glucose hexokinase kit (Thermo Electron, Pittsburgh, PA, USA). The intra- and inter-assay coefficients of variation averaged < 5.0%. Insulin concentrations were analysed in duplicate using a commercially available radioimmunoassay (RIA) kit (Kit no. DSL-1600, Diagnostic Systems Laboratories, Webster, TX, USA). The intra- and inter-assay coefficients of variation averaged 4.82 and 6.1%, respectively, with an average assay sensitivity of 0.0836 ng ml− 1.
The pre-treatment (time 0) blood samples were also utilized to measure the concentrations of plasma cortisol and leptin, as well as serum triglycerides (TGA) and non-esterified fatty acids (NEFA). Plasma concentrations of cortisol were analysed in duplicate using an RIA kit (Kit no. DSL-2100, Diagnostic Systems Laboratories). The intra-assay CV was 9.4% with a reported sensitivity of 0.625 ng ml− 1. Plasma leptin concentrations were measured using a commercial, multi-species leptin RIA kit (Kit no. XL-85K, Linco Research, St Charles, MO, USA). The intra-assay CV averaged 4.1%, with an average reported sensitivity of 0.7746 ng ml− 1. Serum NEFA concentration was measured using the Wako HR Series NEFA-HR (2) method using the Boehringer Mannheim/Hitachi 704 Chemistry Analyzer. The intra-assay CV was reported at < 1.0% with an assay sensitivity of 0.0014 mEq l− 1. Serum TGA were also measured on the Boehringer Mannheim/Hitachi Analyzer using the Infinity Triglyceride Kit (Thermo Electron). The intra-assay CV was reported at < 5.0%, with an assay sensitivity of 0.158 mmol l− 1. Plasma lactate concentrations were measured using the Trinity Biotech Lactate procedure number 735 with the Boehringer Mannheim/Hitachi Analyzer. The intra-assay CV was reported as < 3.0%, with an assay sensitivity of 2 mg dl− 1.
Statistical analysis
Statistical analyses of BW, BCS and rump fat thickness variables were determined with repeated measures ANOVA using PROC MIXED of SAS (SAS Institute Inc., Cary, NC, USA). The model statement included the effects of treatment and treatment by day with day as a repeated measure and horse as the subject. The pre- to post-test change variables (NEFA, TGA, leptin, cortisol, glucose, insulin, AIRg, DI, SI, Sg, run time to fatigue, VO2peak and lactate) were analysed utilizing ANOVA with only treatment in the model. Significance was set at P < 0.05.
Results
Body measurements
Body weight
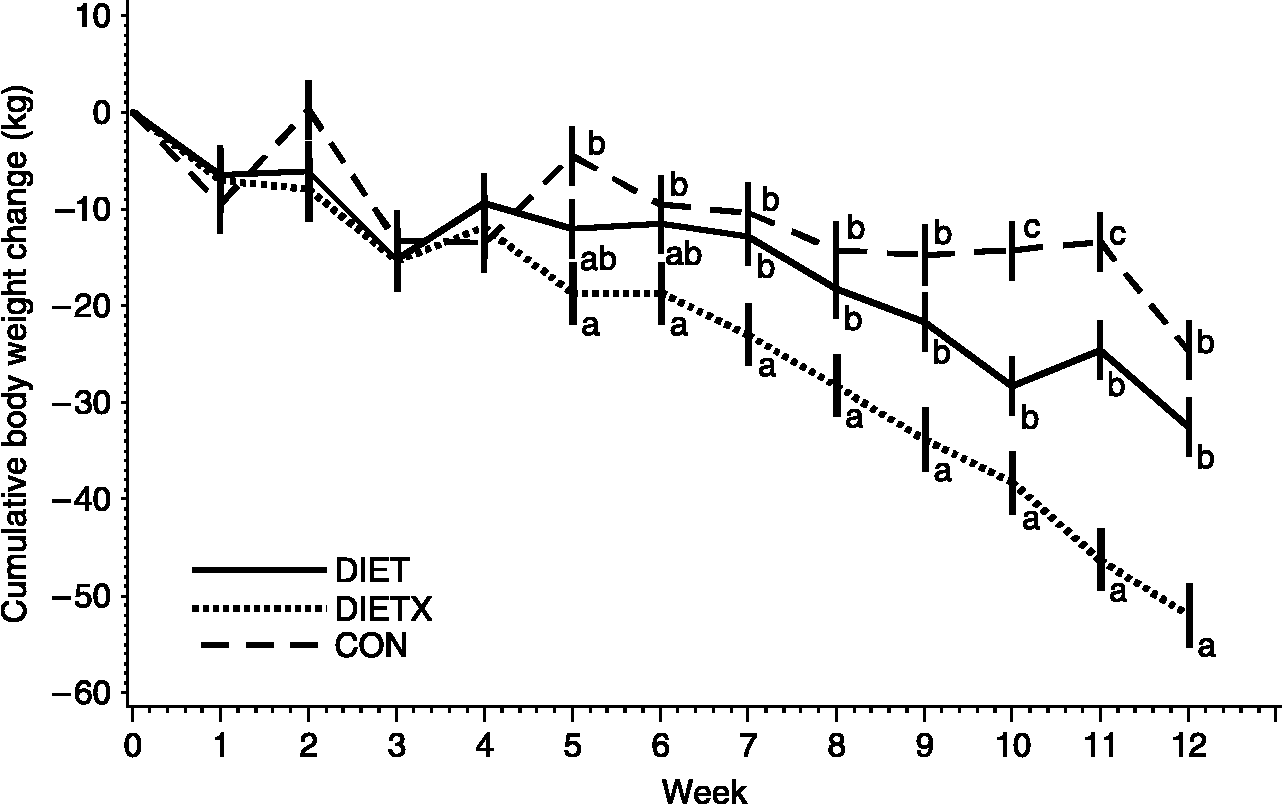
Horses in the DIETX group lost the most weight, with an average cumulative BW change of − 52.0 kg at 12 weeks (P < 0.01). This was significantly (P < 0.01) more weight loss than the DIET and CON groups for weeks 7–12 of the experimental period. The DIET group had also lost a significant (P < 0.01) amount of weight ( − 32.5 kg) by 12 weeks. The CON group lost the least amount of weight, with an average cumulative BW change of − 24.63 kg (Fig. 1).
Cumulative body weight change during the experimental period in the DIET, DIETX and CON groups. Differing letters during each week indicate a statistically significant difference between treatment groups at P < 0.01

Body condition score
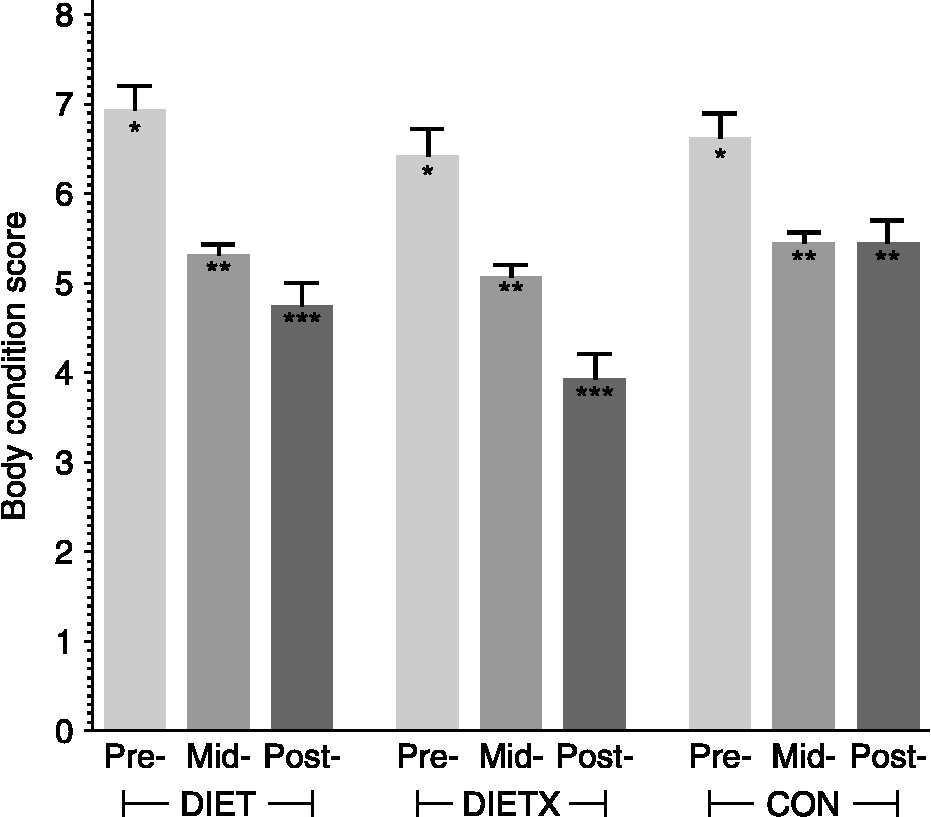
All three groups also demonstrated decreases in BCS, with the DIETX group having the largest decreases ( − 2.50 total average change in BCS) that were significant (P < 0.05) at both the midpoint and the end of the experimental period. The DIET group also had lower BCS at 7 and 12 weeks ( − 2.19 total average change in BCS, P < 0.05), while the CON group had an initial decrease in BCS at the midpoint, but then maintained condition for the remainder of the experimental period ( − 1.19 total change in BCS during the first 6 weeks only; Fig. 2).
Change in body condition score within each treatment group as measured before (pre-), during (mid-) and after (post-) the 12-week experimental period. A differing number of asterisks indicates a P < 0.05 difference within each treatment group

Rump fat thickness
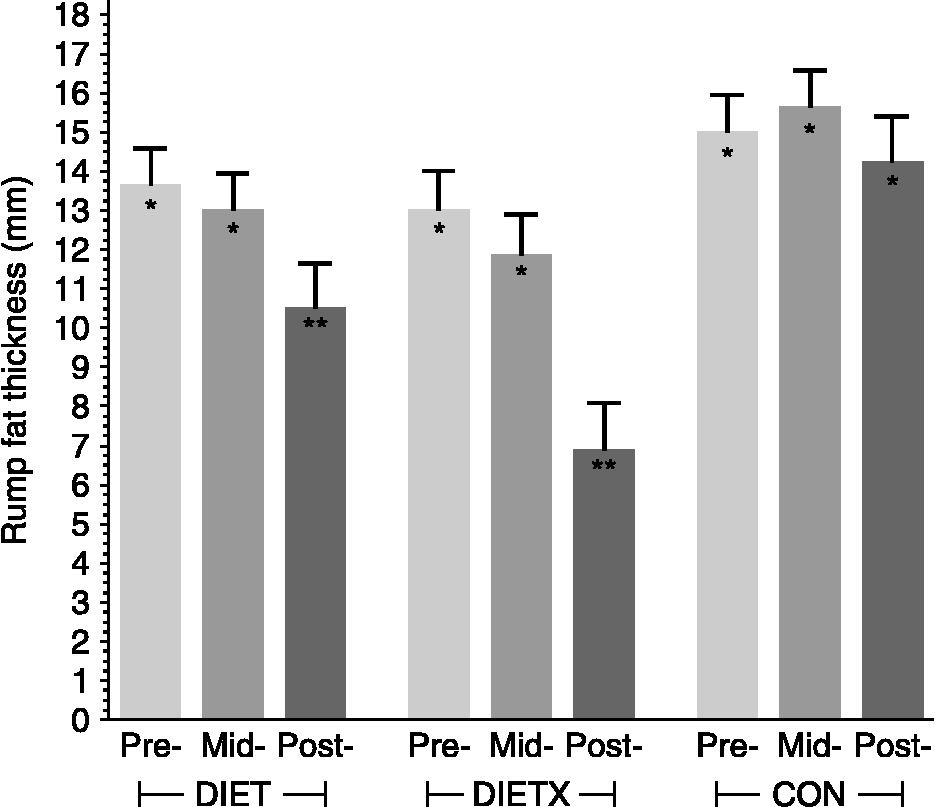
The DIET and DIETX groups showed decreases (P < 0.05) in rump fat thickness, evident at 12 weeks, with the largest decrease evident in the DIETX group ( − 6.14 cm total average change in rump fat). The DIET group had a − 3.13 cm total average change (Fig. 3).
Change in rump fat thickness within each treatment group as measured before (pre-), during (mid-) and after (post-) the 12-week experimental period. A differing number of asterisks indicates a P < 0.05 difference within each treatment group

Blood measurements
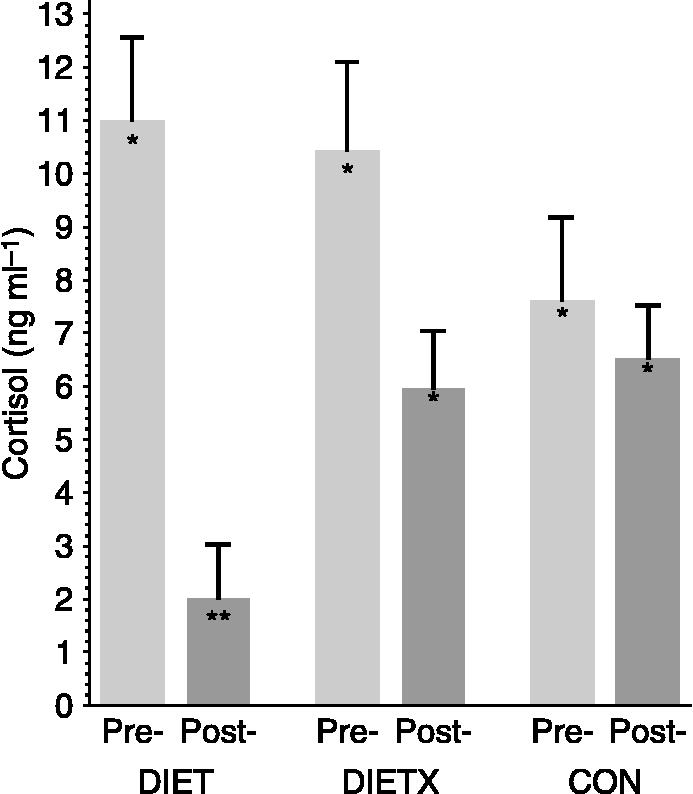
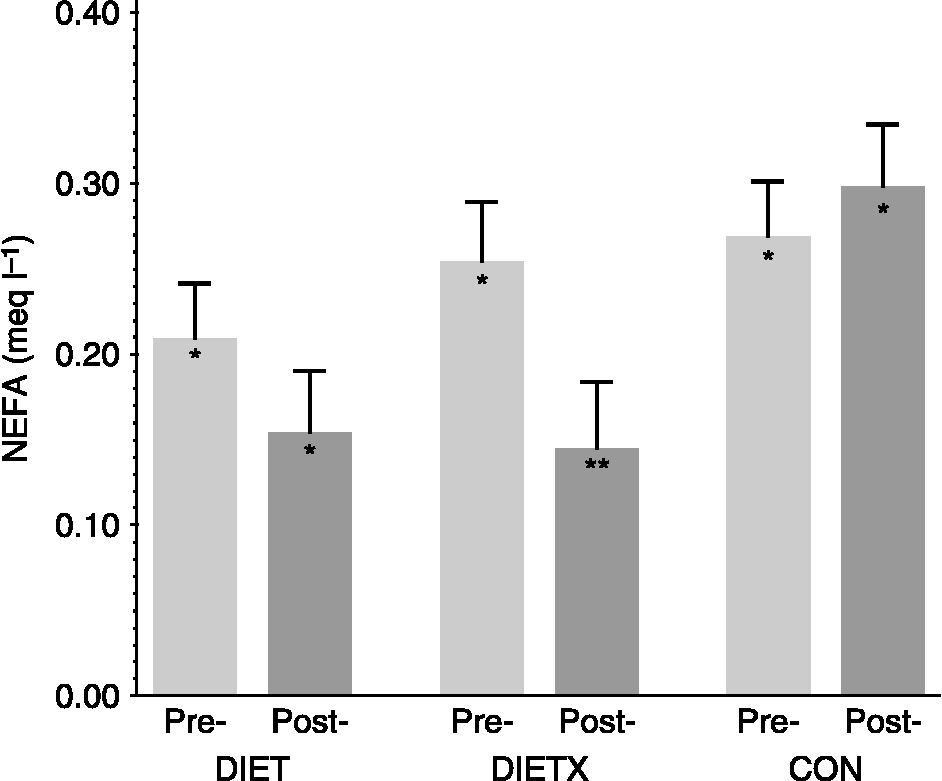
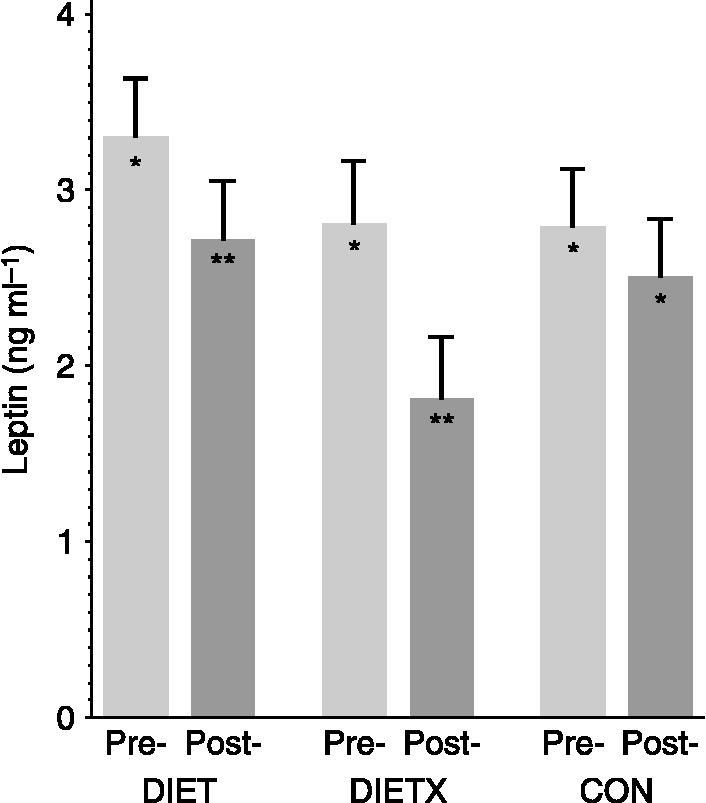
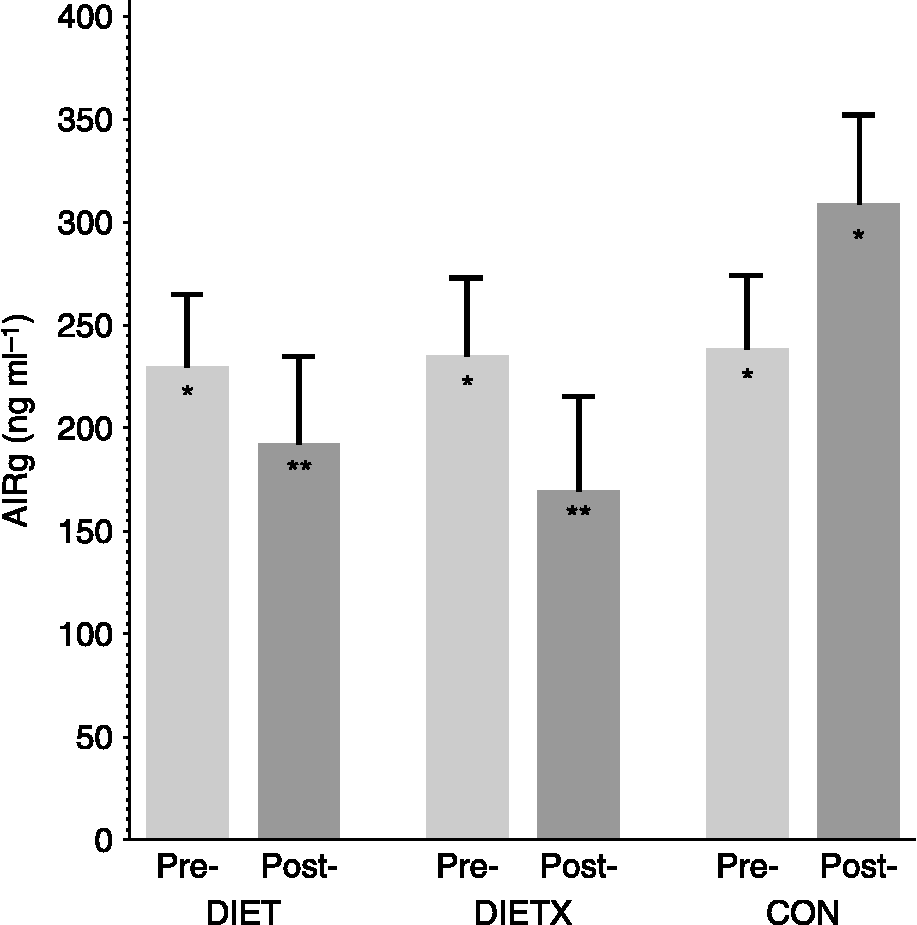
There was a significant decrease (P < 0.05) in serum cortisol concentration for the DIET group pre- versus post-weight loss. The DIET group had an − 8.98 ng ml− 1 average decrease. There was no significant change (P>0.05) in the pre- vs. post-weight loss cortisol concentrations for either the DIETX and CON horses (Fig. 4). The DIETX group had a significant decrease (P < 0.05) in serum NEFA concentration pre- versus post-weight loss, with the average decrease being − 0.11 meq l− 1. The DIET group had a − 0.05 meq l− 1 average decrease, but the change was not statistically significant. Similarly, the CON group demonstrated little change (P>0.05) in the pre- versus post-NEFA concentrations (Fig. 5). Plasma leptin concentrations were significantly decreased (P < 0.05) in the DIET ( − 0.59 ng ml− 1) and DIETX ( − 1.00 ng ml− 1) groups pre- versus post-weight loss. There was no change (P>0.05) in the pre- versus post-weight loss leptin concentrations for the CON horses (Fig. 6). There was a significant decrease (P < 0.05) in AIRg for the DIET and DIETX groups pre- versus post-weight loss: the DIET group had a − 37.36 average decrease, while the DIETX group had a − 65.69 average decrease. There was no statistically significant change (P>0.05) in the pre- versus post-weight loss AIRg calculations for the CON horses (Fig. 7).
Change in plasma cortisol concentration in DIET, DIETX and CON groups, measured before (pre-) and after (post-) the experimental period. A differing number of asterisks indicates a P < 0.05 difference within each treatment group

Change in serum non-esterified fatty acid (NEFA) concentration in DIET, DIETX and CON groups, measured before (pre-) and after (post-) the experimental period. A differing number of asterisks indicates a P < 0.05 difference within each treatment group

Change in plasma leptin concentration in DIET, DIETX and CON groups, measured before (pre-) and after (post-) the experimental period. A differing number of asterisks indicates a P < 0.05 difference within each treatment group

Change in acute insulin response to glucose (AIRg) in DIET, DIETX and CON groups, measured before (pre-) and after (post-) the experimental period as part of the frequently sampled intravenous glucose tolerance test. A differing number of asterisks indicates a P < 0.05 difference within each treatment group

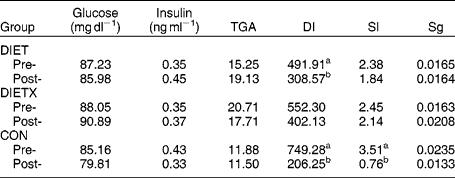
When compared, pre- and post-experimental period pre-treatment glucose, insulin, TGA and the MinMod parameter of Sg (Table 4) were not significantly different (P < 0.05) across all groups. However, DI did decrease significantly (P < 0.05) in the DIET and CON groups. SI was significantly decreased (P < 0.05) only in the CON group when comparing pre- and post-experimental period levels (Table 4).
Glucose, insulin and triglycerides (TGA) measured as baseline values before (pre-) and after (post-) the experimental period

Disposition index (DI), insulin sensitivity (SI) and glucose effectiveness (Sg) were measured as part of the modified frequently sampled intravenous glucose tolerance test. Differing letters within each group for a variable indicate a P < 0.05 difference.
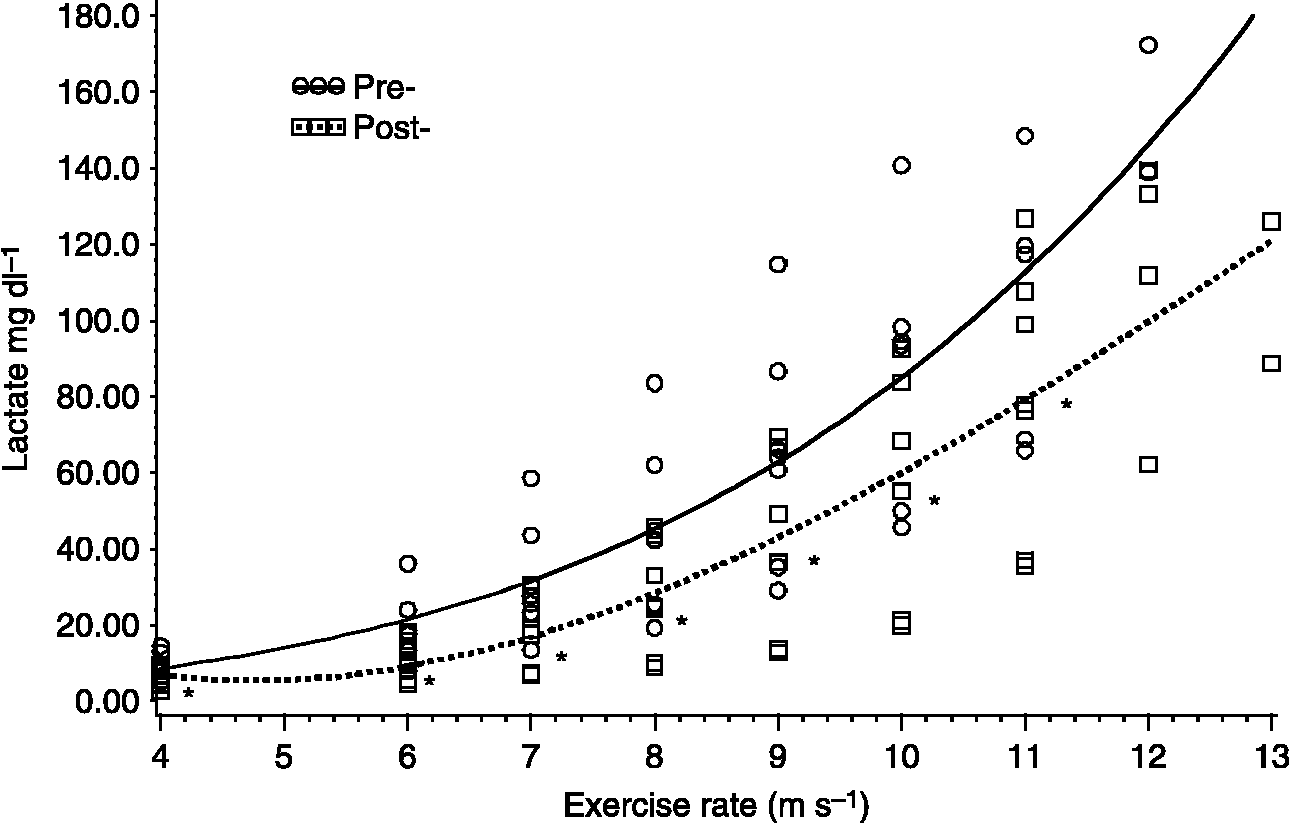
Horses undergoing forced exercise in the DIETX group had significant increases (P < 0.05) pre- versus post-experimental period in VO2max and run time to fatigue during the GXT. VO2max had an average increase of 19.6 ml min kg− 1 and run time to fatigue increased by an average of 1.29 min. Plasma lactate concentrations were significantly decreased (P < 0.05) during the post-experimental period GXT when compared with the pre-experimental period GXT, at steps 2–8 (Fig. 8).
Plasma lactate concentration in the DIETX group during the graded exercise test that took place before (pre-) and after (post-) the experimental period. An asterisk indicates a P < 0.05 difference between pre- versus post-values at the indicated step of the test

Discussion
To our knowledge, this is one of very few studies in equines to document weight loss over time with both diet and diet plus exercise regimens. Using the WC feed, horses were able to lose roughly 0.45–0.68 kg (1.0–1.5 lbs) per day with the described plan. The weight loss was documented through BW, BCS and rump fat thickness concurrently. Given the problem of overweight horses in this country, the generation of these data produces hope that a management plan that includes caloric restriction, with or without exercise, with strict adherence to protocol including dry lot paddocks, and specific and restricted hay, can produce weight loss in overweight horses. One flaw of the current study was the weight loss that occurred in the negative control horses (CON). We believe that there were several factors that contributed to this effect. Foremost, these horses were not individually stalled at night, allowing for a potential increase in spontaneous activity while turned out in groups. We did not measure their spontaneous activity, although based on subjective observation the control horses appeared to be very quiet overnight in their outdoor pens. A second confounding factor was the adverse weather conditions that struck the St Louis, MO area (where this study was conducted) during the third week of the study (30 November and 1 December 2006), including a severe ice storm that brought record rainfall and ice (15–22.5 cm of ice/snow/sleet accumulations)11. These severe weather conditions may have increased the CON horses' caloric burn. Many of these horses were observed shivering, and refused to enter the shelter, thereby remaining exposed to the elements during this week. It has been reported that horses exposed to wet and cold conditions have increased energy requirements above maintenance6, and some may have 50% increased digestible energy (DE) requirementsReference Kubiak, Crawford, Squires, Wrigley and Ward12. We concede that having the CON horses housed outside was not appropriate experimental design; however, housing constraints at the time were not conducive to other options. Interestingly, the horses in the DIET and DIETX groups did lose significantly more weight than those in the CON group, even while being stalled, and we were able to appropriately test our hypotheses to determine whether horses on the WC programme would lose weight. Overall, the WC programme helped our DIET and DIETX horses to return to a lower body weight.
While it is possible to estimate the caloric intakes and requirements of the horses involved in this study, the authors strongly caution against considering these estimated numbers to be completely accurate. Using a calculated DE value as estimated by Dairy One Forage Laboratory, we can determine that the DIET horses received an average of 16.64 Mcal day− 1 on their daily plan. DIETX horses averaged 15.27 Mcal day− 1 and CON horses averaged 21.61 Mcal day− 1. If we compare that to their estimated DE requirements, as determined by the 2007 NRC Nutrient Requirements for Horses, the DIET group (maintenance equation, DE req = 0.0303 × BW) would require an average of 17.09 Mcal day− 1, while the DIETX group (moderate exercise equation, DE req = (0.0333 × BW) × 1.4) would require an average of 25.87 Mcal day− 1. The CON group (NRC maintenance equation) would require an average of 17.7 Mcal day− 1. Hence, the DIET and DIETX groups (which lost the most weight) were obviously taking in fewer calories than the NRC's suggested requirement. Interestingly, the CON horses that lost weight during the study had a calculated intake that was higher than their requirement. Consequently, there is some disconnect that would have to be explained by either errors in the NRC equations to properly predict energy requirements, errors in the feed analysis to properly predict DE values or errors in choosing the NRC maintenance equation to calculate the DE requirement for these horses. It would be beneficial to know exactly how much of a caloric deficit is required to produce 1 pound (0.45 kg) of weight loss per day in a horse. However, utilizing crude methods of DE analysis along with estimation equations for energy expenditure makes this impossible with current data. On the other hand, these calculations are able to provide some very general guidelines that demonstrate that a deficit of roughly 10.0 Mcal day− 1 led to significant weight loss over time in horses on an exercise programme.
One very important point of this study was the significant decrease in AIRg in both the DIET and the DIETX groups after the 12-week programme. This lower insulin response to the glucose load is important information with regard to horses that may have difficulty controlling insulin concentrations due to obesity. Several studies in horses have documented an increase in SI (as measured with many varied methods) after short bouts of exercise or trainingReference Powell, Reedy, Sessions and Fitzgerald13–Reference Stewart-Hunt, Geor and McCutcheon16, but data are lacking in horses for a correlation between weight loss alone and increase in SI. One study on Shetland ponies reported a decrease in glucose and insulin response to an oral glucose tolerance test after strict weight lossReference Gordon, McKeever, Betros and Manso Filho19. In the current study, a decrease in SI (as measured by the FSIGT and MinMod analysis) was shown in the CON group that lost the least amount of weight. We are not sure of the mechanism for this finding. One would expect an increase in SI in the groups with the most weight loss (DIET and DIETX), and especially in the group receiving forced exercise; however, despite a slight numerical decrease in SI, the differences were not significant. Perhaps the main issue is to determine whether the horses were insensitive to insulin at the onset of the study. Data generated by Hoffman et al. in 2005 eloquently demonstrated the proper use of the modified FSIGT in horses. Obese horses had lower SI, higher Sg and higher AIRg values compared with non-obese horses in the same study. Hoffman's obese horses had a reported SI of 0.37 ± 0.27 × 10− 4 l mU− 1 min− 1, while the non-obese were 1.94 ± 0.19 × 10− 4 l mU− 1 min− 1. In the present study, the SI of the DIET and DIETX horses before weight loss was 2.38 and 2.45 ± 0.83 × 10− 4 l mU− 1 min− 1, with decreases to 1.84 and 2.14 ± 0.37 × 10− 4 l mU− 1 min− 1 after weight loss, respectively. Hence, if comparisons were made between Hoffman's data and that of the present study, perhaps the horses in the present study were not insulin resistant to begin with, or they were not sufficiently overweight or overweight for a long enough period of time before the beginning of the experimental period to show a pronounced effect on SI after weight loss and exercise. Additionally, a study with more subjects in the DIET and DIETX groups may have increased the statistical power to show a true difference in SI due to weight loss and exercise.
As expected, a decrease in plasma leptin concentration occurred in accordance with a decrease in BW and fat mass in the present study. This is in agreement with a recent study in Shetland poniesReference Stewart-Hunt, Geor and McCutcheon16, which reported a decrease in leptin correlated with an 18% BW weight loss. Leptin has been shown to be correlated with percentage fat in horsesReference Buff, Dodds, Morrison, Whitley, McFadin, Daniel, Djiane and Keisler18, Reference Gordon, McKeever, Betros and Manso Filho19, so the decrease seen in this study is most likely due to the decrease in fat mass. In humans, leptin concentrations are correlated with SIReference Margetic, Gazzola, Pegg and Hill20, and it has been suggested that leptin may be utilized as a marker for SI in horses. However, large variations in leptin concentrations measured in overweight horsesReference Cartmill, Thompson, Storer, Gentry and Huff21 may make this correlation difficult and potentially inaccurate. More work is needed to determine how leptin can be used as a marker for health in horses. To that end, data specific to horses are accumulating, and we are beginning to understand how plasma leptin concentrations change with alterations in body composition and weight loss. Collectively, these new discoveries may lead to additional research that can further elucidate leptin's role in equine health.
The decrease in NEFA concentration in the DIETX group after weight loss is difficult to interpret due to the nature of data collection in the present study. Typically, NEFA concentration increases during bouts of exercise and lack of caloric intake, indicating its release into the bloodstream (from fat stores) to be delivered to the liver and converted to very low-density lipoprortein (VLDL) (measured as TGA) for use by body tissues as fuel or storedReference Stich and Berlan22. In Shetland ponies, weight loss was correlated with an increase in fasting NEFA and TGA concentrationsReference Weyenberg, Hesta, Buyse and Janssens17; however, the present study demonstrated a decrease in NEFA in the DIETX group only and no change in other groups for either NEFA or TGA after weight loss. These findings may be explained by the fact that the horses in the present study were not truly fasting when the blood sample was taken (1% BW hay was offered at 16.00 hours the day before). In addition, NEFA and TGA concentrations at a single sampling time point must be carefully interpreted due to the many conditions (feeding, fasting, body condition, SI, etc.) that may influence these concentrations. Examination of the products of fat mobilization and their potential use in horses as indices of energy status and health warrants further study, as indicated by the results of Treiber et al. Reference Treiber, Kronfeld, Hess, Byrd, Splan and Staniar23, which indicated that high TGA concentrations in ponies were associated with higher risk for the development of laminitis.
Not surprisingly, cortisol concentrations decreased in the DIET group after weight loss. But again, these data should be interpreted with caution. Cortisol, as regulated by the hypothalamic–pituitary axis, can influence SI as is commonly seen in horses with pituitary pars intermedia dysfunctionReference Love24. A decrease in cortisol could be seen as a beneficial change in horses after weight loss; however, the DIETX group that lost the most weight had no statistically significant difference in cortisol concentration post-weight loss. It is important to keep in mind that many things affect cortisol concentration, including diurnal variation, nutritional status, exercise and stressReference McKeever, Gordon, Hinchcliff, Kaneps and Geor25. Furthermore, there are few data to show what is a healthy versus unhealthy concentration of cortisol in horses. In the present study, cortisol had less than a 10 ng ml− 1 range from pre- versus post-experimental period samples in the DIET group. Therefore, while a difference in cortisol concentration may have been shown to be statistically significant, it may have little physiological significance in the animal. Clearly, more work is needed to further define the role of cortisol in weight loss in horses.
The exercise regimen employed in the current study was successful at inducing additional weight loss beyond DIET alone, as well as increasing the fitness of the horses as evident by increased VO2peak, run time to fatigue and decreased lactate concentrations during the post-experimental period treadmill test. One question not answered by this study is whether the exercise regimen employed is realistic for horse owners to implement as part of a weight loss plan. Most horse owners do not own an Equi-ciser™, and exercise efforts will require a substantial time commitment from the human counterpart in charge of the horse's exercise. The horses in the current study were worked 3 days per week, always with 20 min of total of walking for warm-up and cool-down. Trot work started at 30 min per day and gradually increased to 60 min by the end of the trial. In total, horses were working 240 min or 4 h total per week for their exercise programme. The difference in weight loss between DIET and DIETX was less than expected. However, the rump fat change in DIETX was nearly two times greater than the rump fat change in DIET. This may be an indication that exercise did result in significantly greater calorie use driving fat tissue loss. However, exercise may have also resulted in muscle hypertrophy increasing the total muscle mass and effecting a shift in body composition. An increase in muscle mass due to exercise could offset expected calculated total BW loss. It is prudent, however, to continue recommending exercise as part of a weight loss programme, due to the positive effect of any extra caloric expenditure, as well as increases in SI that may occur from exercise alone.
In conclusion, horses on a calorie-restricted regimen with and without forced exercise lost BW, and had reduced BCS and rump fat thickness, within 12 weeks. By utilizing 1% BW grass hay and 0.3–0.5% BW of a specially formulated low-calorie concentrate feed, a negative caloric balance was achieved that also resulted in a lower insulin response to a glucose load and lower leptin concentrations. Overall, these dietary guidelines can assist in developing recommendations for facilitating weight loss in horses. With the apparent epidemic of obesity in horses in the United States, these data are important in helping improve the health and welfare of our equine population.