Nomenclature
- Si
-
guide vanes or stators
- Ri
-
rotors
- CFD
-
computational fluid dynamics
- TLV
-
tip leakage vortex
- NS
-
near stall
- PE
-
peak efficiency
- 3D
-
three-dimensional
- 2D
-
two-dimensional
- B
-
blockage parameter
- VZ
-
absolute axial velocity
- Grad
-
gradient
Greek symbol
- ρ
-
density
1.0 Introduction
The compressor, a critical component in aero-engines, utilises turbine-driven shaft power to pressurise air, with pressure ratio and adiabatic efficiency serving as primary performance parameters. Advancements in engine technology have elevated compressor loading and operational Mach number ranges, intensifying susceptibility to flow instabilities such as stall and surge [Reference Guo, Chu, Yan, Shen and Wang1, Reference Qiao, Chu, Zhang, Wang and Yang3]. Four dominant stall mechanisms are recognised: rotor tip separation-induced blockage, tip clearance leakage flow blockage, shock-induced blockage at blade tips and stator corner separation-triggered blockage [Reference Zhang, Dong, Wang, Chu and Yan2, Reference Qiao, Chu, Zhang, Sun, Wang and Chen4]. In transonic axial compressors, tip clearance leakage flows and shock waves interact synergistically to form localised blockage as shown in Fig. 1a. Unlike stall patterns driven solely by tip separation or leakage flows, near-stall conditions exhibit negligible aerodynamic overload at blade tips and stable leakage flow trajectories. However, intensified shock-leakage flow interactions provoke vortex breakdown and generate large low-momentum blockage zones downstream of shock waves, ultimately initiating tip stall. For multistage axial compressors, stator root corner separation may evolve into corner stall as shown in Fig. 1b. This phenomenon originates from transverse pressure gradients within compressor passages, where boundary layers in endwall regions generate cross-flows. These secondary flows transport low-momentum fluid toward suction surface corners, forming accumulations of reversed flow and stagnant fluid, which is called corner separation.
Schematic illustration of compressor stall mechanism: (a) tip stall (b) corner stall.

In practical engineering applications, compressors operate across a wide range of rotational speeds, necessitating a comprehensive understanding of stall mechanisms under varying conditions. Early research by Pan et al. [Reference Pan, Song, Li and Li5] on a transonic axial compressor stage revealed that at 65% design speed, instability was initiated by spike-induced rotating stall, detected through dynamic pressure signal analysis at the tip casing and stator outlet. As the speed increased beyond 78% design speed, local surge gradually replaced spike-type stall as the dominant instability mechanism, culminating in fully developed surge-driven aerodynamic instability at 98% design speed. He et al. [Reference He, Wang, Hu, Li and Song6] numerically demonstrated that between 70% and 100% corrected rotational speed in Rotor 37, stall originated from the breakdown of tip leakage vortices (TLV) interacting with shockwaves, while at 115% corrected rotational speed, radial vortices caused suction surface flow accumulation. Zhang et al. [Reference Zhang, Tan, An, Chu and Wu7] identified that in Rotor 67, TLV-shock wave interaction dominated stall triggers at 100% and 80% speeds, with TLV fragmentation observed at 80% speed, whereas 60% speed instability arose from leading-edge spillage due to TLV overflow. Zhu et al. [Reference Zhu, Teng and Qiang8] performed unsteady numerical simulations and experimental validation on a transonic compressor stage under near-stall conditions at 100% and 80% design speeds. Results showed that stall was triggered by low-speed zones formed by TLV-shock wave interactions blocking the tip passage. Compared to 100% speed, the blockage at 80% speed was weaker, but the shock wave position shifted forward, aggravating leading-edge blockage and inducing stronger unsteady effects. Ahmad et al. [Reference Ahmad, Zheng, Li and Ishaque9] conducted multi-passage steady and unsteady numerical simulations on Rotor 37 at different rotational speeds. Results showed that TLV-shock wave interactions caused blockage, triggering rotating stall at 100% and 80% speeds, while TLV-induced leading-edge spillage dominated as the primary mechanism at 60% speed.
Current research on compressor stall mechanisms is predominantly limited to single rotors or isolated stages, with virtually less studies addressing multi-stage axial compressors. Investigations into multi-stage stall inception are hindered by prohibitively high numerical simulation and experimental costs. Xia et al. [Reference Xia, Gu, Cui and He10] conducted experimental research on stall in a multi-stage axial compressor under optimised stator vane angles and inter-stage bleed conditions. Using high-precision, high-frequency dynamic pressure sensors to capture signals, they identified phase differences between corresponding frequency channels and determined the surge initiation stage. Below 80% speed, stall originated upstream of the first-stage rotor blades. At 90% speed, stall initiated downstream of the second-stage rotor blades. This pattern fully aligned with compressor stall characteristics. Chu et al. [Reference Chu, Wang and Yang11] developed a method to predict the first stalled stage in multi-stage axial compressors based on the HARIKA algorithm for characteristic calculations. This method integrated the maximum static pressure rise capability of individual stages with actual operating point characteristics, combined with a single-stage stacking method for off-design performance prediction. Validation against existing experimental data confirmed the method’s accuracy and reliability in identifying the initial stall stage in multi-stage compressors. Zhang et al. [Reference Zhang, Zhou, Tian, Huang, Jiang and Gui12] investigated the impact of large inter-stage bleed on compressor stage performance through bleed configuration design, extensive inter-stage bleed experiments, and meridional flow surface parameter calculations based on test data for a nine-stage compressor. The results showed that when inter-stage bleed rates varied from 13% to 24%, the compressor’s choked flow variation remained minimal, but surge margin decreased. Excessive bleed rates induced severe flow separation and efficiency reduction in stages downstream of the bleed location, worsened inter-stage matching, thereby reducing the compressor’s total pressure ratio and further diminishing surge margin. Hua et al. [Reference Hua, Li, Ju and Zhang13] conducted steady numerical simulations on a three half-stage high-speed axial compressor at four speeds, focusing on low-speed stall characteristics and flow instability mechanisms. Results showed: at 100% and 90% design speeds, stall margins were 16.58% and 32.22%; at 80% and 70% design speeds, stall margins dropped to 0.22% and 0.34%, with abrupt discontinuities in performance curves. Analysis revealed: at 80% speed, irreversible partial-span stall occurred at the R1 tip, unresolvable by increasing flow rate; at 70% speed, S3 dual-opening corner separation stall triggered by S2 corner separation was resolved by increasing flow rate.
Previous studies on stall mechanisms in multi-stage axial compressors at varying speeds have been limited to qualitative comparisons of flow field patterns, with the identification of the initial stall stage relying primarily on experimental methods, lacking effective numerical simulations to determine the precise location and mechanism of stall initiation or quantitative analytical criteria. This paper investigates a real high-load nine-stage axial compressor, employing full three-dimensional numerical simulations to comparatively analyse flow fields and stall mechanisms at different rotating speeds. The initial stall stage was determined through both qualitative comparisons of flow field diagrams and a quantitative method measuring passage blockage. Identifying the initial stall stage in multi-stage compressors is critical for guiding subsequent stabilisation strategies. For example, if stall initiates at the rotor tip, casing treatment can be applied for stabilisation [Reference Zhang, Dong, Wang, Liu and Chu14–Reference Chi, Chu and Zhang16], whereas if it originates from stator corner separation, endwall profiling or stator blade redesign can mitigate the issue [Reference Li, You, Lu, Zhang and Chu17–Reference Dong, Chu, Li, Lang and Guo19].
2.0 Research object and numerical methods
2.1 Research object
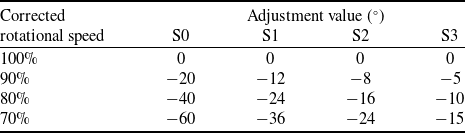
The research object of this study is a high-load, high-speed nine-stage axial compressor. As shown in Fig. 2a and b, which present the partial-stage geometric model and meridional view of the compressor, respectively, the specific positions of each stage are labeled in the figures, where ‘R’ denotes rotor blades, ‘S’ denotes stator blades and the numbers represent the stage indices. A significant axial distance exists between the third-stage stator (S3) and the fourth-stage rotor (R4) due to the inter-stage bleed system in this compressor between Stages 3 and 4, as shown in Fig. 2b. The studies of this multistage axial compressor at different rotational speeds in this paper exclude inter-stage bleeding, focusing on the compressor configuration without bleeding [Reference Zhang, Zhou, Tian, Huang, Jiang and Gui12]. Numerical investigations are conducted under four corrected rotational speeds: 100%, 90%, 80% and 70%. In real operating conditions, the rotor tip clearance varies with rotational speed. Consequently, in the computational setup, the rotor tip clearances corresponding to the 100%, 90%, 80% and 70% corrected rotational speeds are 0.2 mm, 0.25 mm, 0.35 mm and 0.4 mm, respectively. The compressor incorporates adjustable stator guide vanes (S0, S1, S2, S3), whose geometric configuration is illustrated in Fig. 3, featuring partial clearance at the blade tips and hubs. The setting angles of these vanes are dynamically adjusted based on rotational speed, with specific adjustment rules provided in Table 1.
Schematic diagram of a multi-stage axial-flow compressor: (a) partial-stage geometric model (b) meridional plane.

Adjustable stator vane geometric configuration schematic.

Control law of adjustable stator vanes

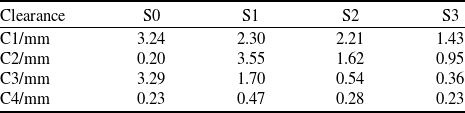
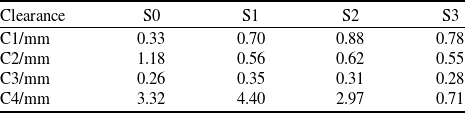
Clearances exist between the adjustable guide vanes (S0–S3) at both the casing and hub. The leading-edge and trailing-edge clearances at the casing are denoted as C1 and C3, respectively, while those at the hub are labeled C2 and C4. In engineering practice, to ensure unobstructed vane rotation between maximum and minimum adjustment angles, the partial clearance dimensions vary dynamically with vane angle adjustments. Tables 2 and 3 summarise the measured partial clearances for the adjustable stator vanes at 100% and 70% corrected rotating speeds, respectively. The clearance values differ depending on rotational speed, vane position (S0–S3) and clearance location (C1–C4). All clearance values adopted in this study are experimentally measured to strictly align with experiment conditions, ensuring consistency between numerical simulations and physical experiments.
Partial clearance values at 100% corrected rotational speed

Partial clearance values at 70% corrected rotational speed

2.2 Numerical methods
This study employs the NUMECA software for single-passage full three-dimensional numerical simulations. Structured meshes were generated using NUMECA/Autogrid5. An O4H mesh topology was applied to each blade passage, while a butterfly mesh topology was adopted for both the rotor tip clearance and partial clearances of the adjustable stator vanes. The mesh was refined at the endwalls to ensure the y+ value of less than 10 for the first layer of mesh. Fig. 4 provides a partial view of the computational domain mesh for this nine-stage compressor, and Fig. 5 illustrates the mesh topology view of partial clearances at the stator-to-casing and stator-to-hub interfaces.
Mesh visualisation of the computational domain.

Partial clearance view of adjustable stator vanes.

The working fluid is modeled as an ideal gas. The inlet boundary conditions are defined by a total temperature of 288.15 K and total pressure of 101325 Pa, while the outlet specifies an averaged static pressure. Adiabatic no-slip boundary conditions are applied to all solid walls, including blade surfaces, hub and casing. Periodic boundary conditions are imposed between adjacent blade passages, and rotor-stator interfaces utilise full non-matching mixing planes. In the three-dimensional flow field calculation of the turbomachinery, the rotating components (blade surfaces and hub) are set with rotational motion, while the casing remains stationary. Initial conditions in the NUMECA Fine/Turbo solver are initialised with a uniform velocity field, temperature field (288.15K) and pressure field (101325Pa). The compressor characteristic map is generated by progressively increasing the back-pressure in steps of 500 Pa at near stall (NS) conditions. Stall is identified by consecutive reductions in mass flow rate, pressure ratio and efficiency, with the last converged solution before numerical instability defined as the stall boundary point.
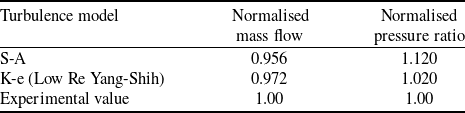
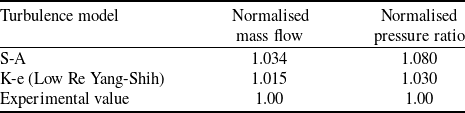
A grid independence verification was conducted, referencing the numerical simulations and experimental studies by Zhang et al. [Reference Zhang, Zhou, Tian, Huang, Jiang and Gui12] and Huang et al. [Reference Huang, Chu, Zhang and Guo24] at AECC Sichuan Gas Turbine Establishment. The results demonstrated that when the total mesh count was refined beyond 9 m, the compressor’s pressure ratio, efficiency and stall margin exhibited negligible variations. Consequently, a total mesh count of 10 m was adopted for this study. Subsequently, turbulence model validation was performed by comparing the widely used engineering models Spalart-Allmaras (S-A) and K-e (Low Re Yang-Shih) against experimental data. Due to experimental cost constraints and data confidentiality requirements from relevant industrial departments, the experimental data available for this study are limited to two operating conditions: 100% corrected rotational speed without bleeding and 74.1% corrected rotational speed with bleeding. For the 100% corrected rotational speed, only experimental data from the maximum flow condition and near-stall condition are available, and all data underwent nondimensionalised processing. Comparative analysis revealed that the K-e (Low Re Yang-Shih) model achieved closer agreement with experimental measurements for both pressure ratio and mass flow at near stall conditions and maximum flow condition at 100% corrected rotational speed, and all relative errors were kept within 3%. The CFD results were normalised against experimental measurements (CFD value/experiment value) for direct comparison, as summarised in Tables 4 and 5.
Turbulence model comparison of experiment and CFD at 100% corrected rotational speed under NS condition

Turbulence model comparison of experiment and CFD at 100% corrected rotational speed under maximum flow condition

Pressure ratio characteristics comparison of CFD and experiment at 74.1% corrected rotational speed with bleeding configuration.

Based on the comparative analysis of CFD results against experimental data above, the K-e (Low Re Yang-Shih) turbulence model with a second-order upwind discretisation scheme was selected. Figure 6 shows the normalised pressure ratio characteristic curves at 74.1% corrected rotational speed with comparison between CFD and experiment, where both mass flow rate and pressure ratio were normalised by dividing their values at the nine-stage compressor operating point. The size of the relative error is marked with a blue line in the figure. The experimental data at this rotational speed correspond to configurations with an inter-stage bleed system. Therefore, the computational setup incorporates the identical bleed location and range as in the experiments, utilising the built-in source term bleed method in the NUMECA software for bleed treatment, with the bleed mass flow rate maintained at 24% of the compressor inlet mass flow [Reference Zhao, Lu and Qiang23]. At the near-stall condition, the relative errors between CFD and experimental results were −3.3% for mass flow and +3.0% for pressure ratio, while at the choked flow condition, the relative error in mass flow was −0.4%. The CFD-derived performance curves agree well with experimental data within acceptable error margins. Despite the complex operating conditions involving bleeding at low rotational speeds, the CFD simulations demonstrated high accuracy, thereby validating the reliability of the numerical methodology.
3.0 Investigation of stall mechanisms in nine-stage compressor at different rotational speeds
3.1 Comparative analysis of performance curves at different rotational speeds
This study focuses on a nine-stage axial compressor, conducting numerical simulations at corrected rotational speeds of 100%, 90%, 80% and 70% to obtain pressure ratio and efficiency characteristic curves, as shown in Fig. 7. The mass flow rate, pressure ratio and adiabatic efficiency were normalised by dividing their respective values at the operating point. As the rotational speed decreased, both the peak efficiency and maximum pressure ratio of the compressor exhibited a decline. Previous findings revealed that the stall mechanisms at 100% and 90% corrected rotational speeds are similar, as are those at 80% and 70% corrected rotational speeds. Therefore, subsequent comparative analyses primarily focus on the 100% and 80% corrected rotational speeds to investigate stall mechanisms.
Performance curves at different rotational speeds for comparison: (a) pressure ratio characteristic (b) adiabatic efficiency characteristic.

3.2. Comparative investigation of flow field characteristics and stall mechanisms at different rotational speeds
Based on the preceding numerical simulations, a comparative analysis of flow fields under near-stall and peak efficiency (PE) conditions at 100% and 80% corrected rotational speeds was conducted to investigate differences in stall mechanisms across varying speeds. The analysis of stall mechanisms and identification of initial stall locations in this section were primarily based on qualitative flow field observations.
Firstly, Figs. 8 and 9 present the relative Mach number contours at the blade tip and root B2B (blade to blade) sections for the 100% and 80% corrected rotational speeds. From the relative Mach number distribution at the 98% blade span section under 100% corrected rotational speed, the near-stall condition shows minimal differences in relative Mach number distribution compared to the peak efficiency condition, with well-maintained flow structures and no significant low-velocity regions observed. However, the passage shock wave at the first-stage rotor tip exhibits a noticeable forward shift. At the 2% blade span section, distinct low-velocity regions emerge on the suction surfaces of S1, S2, S3 and S4, with these regions expanding further under NS conditions compared to PE conditions. Therefore, the flow deterioration at 100% corrected rotating speed is localised near the stator roots regions, particularly on the suction surfaces of S1–S4 blades.
B2B relative Mach number distribution contour map at 100% corrected rotational speed: (a) PE 98% span (b) NS 98% span (c) PE 2% span (d) NS 2% span.

B2B relative Mach number distribution contour map at 80% corrected rotational speed: (a) PE 98% span (b) NS 98% span (c) PE 2% span (d) NS 2% span.

Based on the relative Mach number contours at 80% corrected rotational speed, the R1 blade tip exhibits a significant low-velocity region under peak efficiency conditions, nearly blocking the entire blade passage, with further expansion observed under near-stall conditions. At the 2% blade height section, distinct low-velocity regions are present on the suction sides of S1, S2, S3 and S4, showing a trend of enlargement from peak efficiency to near-stall conditions. Overall, flow field deterioration at 80% corrected rotational speed primarily concentrates on the R1 blade tip and the suction side regions near the roots of S1, S2, S3 and S4. Notably, while both 80% and 100% corrected speeds display prominent low-velocity zones on the suction sides of S1–S4 roots, the R1 tip region experiences significantly worse flow degradation at 80% corrected rotational speed compared to 100% corrected rotational speed. Subsequent flow field analyses will focus on the R1 tip and the root regions of S1–S4 to further investigate these phenomena.
Based on the tip clearance leakage flow streamline diagram of R1 as shown in Fig. 10, comparative analysis reveals significant differences in near-stall flow characteristics between 100% and 80% corrected rotational speeds. At 100% corrected rotational speed, the tip clearance leakage flow remains well-organised without low-velocity regions or leakage vortex blockage. In contrast, at 80% corrected rotational speed, the interaction between tip clearance leakage flow and the main flow induces leakage vortex expansion, accompanied by prominent tip leading-edge overflow. Further supported by the relative velocity vector diagram at the R1 tip as shown in Fig. 11, a reverse flow blockage zone is observed within the blade passage, completely obstructing the channel. This dual evidence confirms that the intensified tip leakage flow dynamics at 80% corrected rotational speed directly correlate with the severe flow deterioration observed in both the streamlines and velocity fields.
Tip clearance leakage flow streamline diagram of R1 at NS condition: (a) 100% corrected rotational speed (b) 80% corrected rotational speed.

Relative velocity diagram of 98% span at 80% corrected rotational speed under NS condition.

To further analyse the flow characteristics of the blades under near-stall conditions at different corrected rotational speeds, Fig. 12 provides leakage flow streamline diagrams of the leading-edge hub gaps of S1, S2, S3 and S4 blades under near-stall conditions at different corrected rotational speeds. As shown, at both corrected rotational speeds, the interaction between the leakage flow from the leading-edge hub gaps and the mainstream generates distinct low-velocity vortex structures. Significant recirculation zones are observed within the blade passages, and as the leakage vortices flow downstream, they exhibit a tendency to develop toward the mid-span of the blade passages. Particularly at 80% corrected rotational speed, the leakage flow at the S2 leading-edge gap exhibits complete reverse flow, indicating severe blockage in the S2 passage.
Streamline diagrams of hub partial clearance leakage flow of S1, S2, S3 and S4: (a) 100% corrected rotational speed (b) 80% corrected rotational speed.

Figure 13 presents the limiting streamlines on the suction surfaces of the S1 and S2 blade roots and the hub surfaces at both 100% and 80% corrected rotational speeds, with blue transparent iso-surfaces (VZ = −0.1m/s) marking the extent of reverse flow regions to illustrate blockage in the root passages. LE represents the leading edge of the blades. A larger volume enclosed by the blue iso-surfaces indicates a more extensive reverse flow zone and more severe blockage. The results reveal that both S1 and S2 exhibit significant corner separation at both corrected rotational speeds, accompanied by distinct reverse flow regions within the passages. Notably, the corner separation region of S2 is substantially larger than that of S1. This corner separation induces blockage in the root passages, where the reverse flow spans nearly the entire blade channel, leading to severe flow deterioration.
Limiting streamline and VZ = −0.1m/s iso-surface at the roots of S1 and S2: (a) 100% corrected rotational speed S1 (b) 100% corrected rotational speed S2 (c) 80% corrected rotational speed S1 (d) 80% corrected rotational speed S2.

Based on the integrated flow field analysis results, the flow instability in the nine-stage compressor at 100% corrected rotational speed is caused by blockage due to the root leakage flow of S1 to S4. At 80% corrected rotational speed, the flow instability in the nine-stage compressor may result from both the expansion blockage induced by the interaction between the first-stage rotor tip leakage vortex and the mainstream, and the blockage caused by the hub partial clearance leakage flow of S1 to S4.
4.0 Qualitative and quantitative determination of initial stall locations
4.1 Qualitative analysis of initial stall locations
This study adopts two qualitative analysis methods for the determination of initial stall locations: one is the meridional plane mass flux (ρVZ) contour comparison between the near-stall condition and the peak efficiency condition, and the other is the comparison of the VZ = −0.1m/s iso-surface between the peak efficiency condition and the near-stall condition. Figure 14 shows the meridional plane ΔρVZ contours at 100% corrected rotational speed and 80% corrected rotational speed. The parameter ΔρVZ is calculated by subtracting the local mass flux of the peak efficiency condition from that of the near-stall condition in the flow field. Figure 14 presents the distribution contour of ΔρVZ across the entire meridional plane. A negative ΔρVZ indicates that the local flow capacity under the near-stall condition is lower than that under the peak efficiency condition, and the blue regions represent the most significant flow capacity degradation, which are likely the critical locations triggering compressor stall. At 100% corrected rotational speed, the S2 hub is the most upstream region with flow capacity degradation, and the deterioration of the S2 hub flow field further exacerbates the downstream flow field. At 80% corrected rotational speed, the R1 tip region and the S2 hub region exhibit the most pronounced flow capacity degradation. Therefore, the initial stall locations of the multi-stage axial compressor at 100% corrected rotational speed is likely caused by the deterioration of the S2 hub flow field, while at 80% corrected rotational speed, it is likely a combined result of the deterioration in both the R1 tip and the S2 hub flow fields.
Contour map of meridional mass flux variation (ΔρVZ): (a) 100% corrected rotational speed (b) 80% corrected rotational speed.

To further validate the conclusions drawn above, Fig. 15 presents the VZ = −0.1m/s iso-surfaces within blade passages under both near-stall and peak-efficiency conditions, illustrating the low-energy fluid and reversed flow regions in the blade channels. The comparison reveals that at 100% corrected rotational speed, the low-speed blockage zones are primarily concentrated in the stator hub corner regions. As the operating condition shifts from peak efficiency to near-stall, the low-speed region at the S2 hub corner develops most significantly, followed by the low-speed region at the S1 hub corner. At 80% corrected rotational speed, the low-speed blockage zones mainly occur in the stator hub corner regions and the first-stage rotor blade tip. As the condition transitions from peak efficiency to near-stall, the low-speed region at the S2 hub corner exhibits the most pronounced growth, with the R1 blade tip low-speed region being secondary. Furthermore, the blockage severity in blade passages at 80% corrected rotational speed is significantly greater than at 100% corrected rotational speed, with the extent of low-speed blockage regions at the R1 blade tip, S1 hub and S2 hub under 80% corrected rotational speed being markedly larger than those at 100% corrected rotational speed, indicating more severe flow deterioration at the lower corrected rotational speed. Based on the evolution of the VZ = −0.1 m/s iso-surface from peak efficiency to near-stall conditions, the initial stall locations at 100% corrected rotational speed is likely triggered by corner separation at the S2 hub, while at 80% corrected rotational speed, the stall onset may result from a combination of corner separation at the S2 hub and blockage caused by the interaction between the R1 blade tip leakage vortex and the main flow. However, since these conclusions are derived solely from comparative flow field diagrams analysis, they cannot precisely evaluate the development of low-speed regions but only provide a general indication of initial stall locations. Subsequent work will introduce a quantitative method for blockage area analysis to characterise the progression of low-speed regions, thereby accurately identifying the specific location of the initial stall stage.
VZ = −0.1m/s iso-surface of the first 4 stages: (a) 100% corrected rotational speed PE (b) 100% corrected rotational speed NS (c) 80% corrected rotational speed PE (d) 80% corrected rotational speed NS.

4.2 Quantitative identification of initial stall locations based on blockage quantification
Suder et al. [Reference Suder20] investigated the blockage effects of shock-boundary layer interactions and shock-tip leakage flow interactions on endwall flow fields in Rotor 37 at varying rotational speeds by defining blockage quantification parameter. Khalid et al. [Reference Khalid, Khalsa, Waitz, Tan, Greitzer, Cumpsty, Adamczyk and Marble21] employed similar metrics to quantify endwall flow blockage, analyse its relationship with compressor design parameters, and validate three blockage suppression techniques. Xuesong Wang et al. [Reference Wang, Benini, Sun, Song and He22] further proposed a casing treatment optimisation method based on critical endwall blockage attenuation, revealing the evolution of endwall blockage under near-stall conditions through a well-defined quantification approach. They identified maximum endwall blockage and near-trailing-edge endwall blockage as stall-triggering thresholds and optimisation targets, refining casing geometries to enhance stability margins. The blockage metric is fundamentally defined based on the displacement thickness concept in fluid dynamics, serving as a quantitative parameter that effectively characterises the obstruction degree in low-velocity regions of the flow field through velocity deficit quantification. This parameter has been proven to exhibit strong correlations with the compressor’s operational stability margin, and numerous researchers have adopted it as an optimisation objective for refining geometric parameters in casing treatments or endwall contouring designs. However, existing methods are limited to 2D quantification on single axial planes, failing to accurately assess the 3D blockage characteristics of multistage axial compressors, where blockage spans entire blade passages and is significantly influenced by upstream-downstream and inter-stage flow interactions. To address this, this study proposes a 3D blockage quantification method based on passage volume, which calculates the cumulative effects of velocity deficit regions through full-passage axial integration as shown in Fig. 16b. This approach overcomes the limitations of traditional 2D planar analysis that captures only localised blockage as shown in Fig. 16a, providing a comprehensive framework for evaluating blockage propagation mechanisms and stall warning in multistage environments.
Different blockage quantitative calculation domain distinction: (a) based on single 2D plane (b) based on 3D flow channel.

The blockage coefficient B is introduced to assess flow blockage caused by velocity deficits throughout the compressor rotor passage. The calculation method is as follows: first, the mainstream core flow region and velocity deficit region are distinguished based on the axial mass flux gradient Grad(ρVz). In this study, a cutoff value of 3000 is selected to effectively separate the low-velocity zone from the mainstream region. Figure 17 illustrates the identification of velocity deficit regions, where the mainstream zone (blue) and velocity deficit region (red) are clearly demarcated, demonstrating its capability to capture endwall blockage.
ρVZ axial slice contour map with blockage region identification: (a) axial slice contour map of mass flux (b) identification of velocity deficit zone.

The selection of the cutoff value does not affect the magnitude of the result. The origin of this definition concept is derived from the displacement thickness concept in fluid mechanics. In fluid mechanics, the boundary layer region is defined as the area where the velocity is less than 99% of the mainstream velocity, and the source of the 99% value does not have a strict derivation in practice. Similarly, in this paper, the selection of the cutoff value is only use to extract the area with a larger Grad(ρVz) and define it as the velocity deficit region. However, the specific value of the cutoff does not affect the final conclusion. Because once the cutoff value is determined, the calculation of the blockage coefficient will be carried out under the fixed value, and the relative size of ΔB is used to determine the initial position of stall. Previous researchers have verified selection and value of the cutoff value, and its value does not affect the final conclusion, as long as the low-speed area in the flow field can be extracted, referring to researches made by Xuesong Wang et al. [Reference Wang, Benini, Sun, Song and He22] and Zhidong Chi et al. [Reference Chi, Chu, Zhang and Zhang25].
Subsequently, analogous to the definition of displacement thickness in fluid dynamics, the blockage volume VB within the velocity deficit region is computed through volumetric integration. Next, the blockage volume is normalised using the effective passage volume Veff to derive the dimensionless blockage coefficient B. Finally, the relative change in blockage coefficient ΔB, defined as the relative difference between the stall condition and the peak efficiency condition. The specific calculations are as follows:
 \begin{align}{\rm{Grad}}\left( {{\rm{\rho Vz}}} \right) = \left| {{\triangledown _{\rm{r}}}\left( {{\rm{\rho Vz}}} \right)} \right| + \left| {{\triangledown _{\rm{\theta }}}\left( {{\rm{\rho Vz}}} \right)} \right| \geqslant {\rm{cutoff}}\end{align}
 \begin{align}{{\rm{V}}_{\rm{B}}} = \int \int \int \left(1 - {{{\rm{\rho Vz}}} \over {{{\left( {{\rm{\rho Vz}}} \right)}_{{\rm{av}}}}}}\right){\rm{dv}},\end{align}
 \begin{align}{\rm{B}} = \frac{{{{\rm{V}}_{\rm{B}}}}}{{{{\rm{V}}_{{\rm{eff}}}}}}\end{align}
 \begin{align}\vartriangle {\rm{B}} = \frac{{{{\rm{B}}_{{\rm{NS}}}} - {{\rm{B}}_{{\rm{PE}}}}}}{{{{\rm{B}}_{{\rm{PE}}}}}}\end{align}
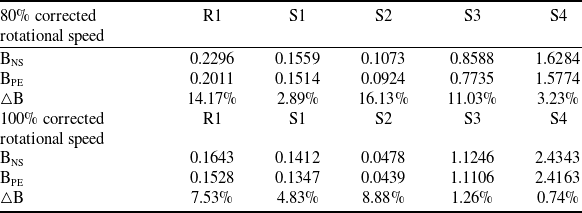
In the equations, (ρVZ)av represents the average mass flux within the effective flow passage volume, BNS denotes the blockage coefficient under the near-stall condition, and BPE is the blockage coefficient under the peak efficiency condition. Table 6 summarises every stage blockage coefficient B and relative changes ΔB at 100% and 80% corrected rotational speeds under near-stall and peak efficiency conditions. Based on the preceding flow field analysis, which revealed that flow deterioration primarily concentrates at the R1 tip and the stator hub regions of stages 1-4, the blockage quantification zones are selected as R1, S1, S2, S3 and S4.
Blockage coefficients and its relative changes

Based on the relative blockage changes summarised in Table 6, at 80% corrected rotational speed, R1 and S2 exhibit the largest relative blockage increments (ΔB), while at 100% corrected rotational speed, S2 shows the most significant relative blockage increase. Combined with the previously analysed locations of low-speed regions in the flow field, it can be determined that at 100% corrected rotational speed, the initial stall instability occurs at the S2 root, while at 80% corrected rotational speed, the first stall occurrence is observed simultaneously at the R1 tip and the S2 root. These results further validate the qualitative flow field analysis conclusions from the previous section regarding initial stall locations. The consistency between qualitative analysis and quantitative blockage metrics analysis confirms the accuracy of the proposed blockage quantification method, as regions with the fastest-growing blockage correspond to the most severe flow deterioration zones, which are critical to compressor stall initiation. By utilising this approach, the obstruction severity across stages can be intuitively and directly visualised without relying on complex flow field comparisons, enabling rapid identification of initial stall locations and providing a foundation for stability enhancement measures. For example, when evaluating casing treatment effectiveness, the reduction in blockage within targeted blade passages can quantify stability improvements and serve as an optimisation objective to reduce computational costs [Reference Wang, Benini, Sun, Song and He22]. In summary, integrating quantitative and qualitative results, initial stall originates at the S2 hub under 100% corrected rotational speed and simultaneously at the S2 hub and R1 tip under 80% corrected rotational speed.
In subsequent explorations of stability-enhancing measures, circumferential groove casing treatments are proposed for the R1 tip, and endwall profiling techniques are applied to the S2 hub to improve flow conditions at the initial stall locations, thereby enhancing the stability margin of the multistage axial compressor. A schematic of these methods is shown in Fig. 18. The blockage quantification method adopted in this section can evaluate the effectiveness of these measures: smaller relative change in blockage coefficient (ΔB) indicates greater efficacy of the stability-enhancing measure, as it effectively suppresses flow deterioration in critical regions [Reference Chi, Chu, Zhang and Zhang25]. Adopting the blockage quantification method proposed in this paper and using it as the optimisation objective can significantly reduce the computational time and cost associated with optimising the geometric parameters of stability enhancement measures in complex multi-stage axial compressors.
Prospects for stability-enhancing measures.

5.0 Conclusions
This study investigates a high-load nine-stage axial compressor, using full three-dimensional numerical simulations to comparatively analyse flow fields under different rotational speeds, to figure out the stall mechanisms of multistage axial compressors across varying operating conditions. Through qualitative comparisons of flow field patterns and quantitative blockage quantification within compressor passages, the stall inception stages are identified, providing critical guidance for implementing targeted stability-enhancing measures. Key conclusions are as follows:
-
1. The numerical simulation methodology was validated against experimental data, confirming the reliability of the computational approach. The performance characteristics of the nine-stage axial compressor exhibit significant differences across corrected rotational speeds: 100% and 90% corrected rotational speeds share similar stall mechanisms, while 80% and 70% corrected rotational speeds demonstrate analogous stall behaviour. This study primarily focuses on 100% and 80% corrected rotational speeds for detailed investigation.
-
2. Comparative flow field analysis indicates that at 100% corrected rotational speed, the flow instability in the nine-stage compressor is caused by blockage resulting from corner separation due to interactions between the hub partial clearance leakage flow in the front four stators and the mainstream. At 80% corrected rotational speed, the flow instability may stem from blockage induced by both the expansion obstruction from interactions between the tip leakage vortex of the first-stage rotor and the mainstream, and the corner separation caused by interactions between the hub leakage flow in the front four stators and the mainstream.
-
3. To further determine the initial stall locations in the multistage axial compressor, qualitative and quantitative analyses were conducted. Qualitative flow field analysis methods, including the VZ = −0.1m/s iso-surface plots and meridional mass flux variation contour maps, both indicate that at 100% corrected rotational speed, stall inception originates from corner separation at the S2 hub, while at 80% corrected rotational speed, stall inception is caused by combined blockage effects from corner separation at the S2 hub and obstruction due to interactions between the R1 tip leakage vortex and the mainstream. A three-dimensional blockage quantification parameter B, independently developed based on the passage volume, was further applied. Through analysis of the relative change in blockage coefficient ΔB, the validity of the qualitative findings was reconfirmed. The 3D blockage quantification method enables accurate quantification of blockage severity across all stages without relying on complex and labor-intensive flow field comparisons, thereby rapidly and precisely identifying initial stall stages and facilitating subsequent research on stability-enhancing measures.
Future research will focus on implementing casing treatments and endwall profiling at critical initial stall locations in this multistage axial compressor to enhance its stability margin. The blockage quantification parameter B will serve as a critical quantification parameter to assess the effectiveness of these stability-enhancing measures and guide their optimisation design.
Acknowledgements
Research funding: The authors thank for the support of National Natural Science Foundation of China (52076179). The authors declare that they have no known competing financial interests or personal relationships that could have appeared to influence the work reported in this paper.
X. Yang: Conceptualisation, data curation, formal analysis, funding acquisition, investigation, methodology, software, supervision, validation, visualisation, writing – original draft. W. Chu: Writing – review and editing, supervision, resources, project administration. H. Zhang: Writing – review and editing, validation, project administration. L. Huang: Writing – review and editing, validation, project administration. Q. Li: Methodology, conceptualisation. H. Wang: Methodology, conceptualisation.