1. Introduction
If a tactile record and playback system were achieved, it could be used for instruction, archiving, and analyzing the human manipulation of objects [1, Reference Nakatani, Kakehi, Minamizawa, Mihara and Tachi2]. For example, if we could record and playback the physical manipulations of artisans and professionals, their followers could learn how to repeat their movements and manipulations even after their deaths [Reference Suzuki and Suzuki3]. Such a system has an important device that can record the tactile sense that occurs during a craft person’s hand manipulations. Evident from such manual tasks as giving massages, making pottery, and performing surgery, tactile sensors must obtain the tactile sensations of both normal force and tangential force because hand motions that rub an object are frequently used to perform such tasks [Reference Ohka, Mitsuya, Higashioka and Kabeshita4, Reference Ohka, Nomura, Yussof and Zaharu5]. In a previous paper [Reference Ohka, Komura, Watanabe and Nomura6], we introduced the concept of a tactile record and playback system equipped with two kinds of tactile sensors: a three-axis fingernail-color sensor worn by a human operator to record tactile data and a three-axis tactile sensor mounted on a robotic finger to playback the recorded tactile data. Although our previous paper focused on the philosophical aspects of our system, we failed to adequately discuss its hardware and design or its model performance for detecting the three-axis force that depends on the differences in the usage of fingernail image data sets.
In this article, first we describe our previous three-axis fingernail-color sensor, which detects a three-axis force applied to human fingers based on changes in the color of fingernails. Although a tactile-sensing glove based on a similar idea has been produced [Reference Sagisaka, Ohmura, Nagakubo, Kuniyoshi and Ozaki7], its wearer cannot directly touch an object because of the gloves. On the other hand, in a fingernail-color sensor, the wearer can directly touch the object because the three-dimensional force, which is applied to the fingertips with a fingernail color change, occurred when the pads of the finger touched the object. The color change is caused by the blood distribution under the fingernail, which is observed with green illumination and a miniature camera. Since the color change is complicated, the relationships between image and three-dimensional force are learned using a convolution neural network (CNN) [Reference Krizhevsky, Sutskever and Hinton8–Reference Khan, Sohail, Zahoora and Qureshi10].
Several tactile sensors can detect human tactile sensations that resemble a fingernail-color sensor, such as a near infrared light-emitting diode (LED) and photodiode types that detect variations in blood distribution in nails [Reference Nomura and Maeda11] [Reference Mascaro and Asada12], a photoplethysmogram (PPG) type that measures the pulse waves of the proximal part of a finger [Reference Hinatsu, Yoshimoto, Kuroda and Oshiro13], the deformation detection of fingernail types by strain gauges [Reference Nakatani, Kawaue, Shiojima, Kotetsu, Kinoshita and Wada14, Reference Sakuma, Abrami, Blurmrosen, Lukashov, Narayanan, Lingman, Gaggiano and Heisig15], and a fingernail image type that uses the average value of the pixel data in each cell of the fingernail images acquired in a darkroom [Reference Grieve, Lincolon, Sun, Hollerbach and Mascaro16]. Although the LED and photodiode types can detect a three-axis force, their precision depends on the positional settings of the photodiodes on the nails. Although the PPG type has an advantage when detecting the pulse waves on a finger’s proximal part, which is separate from the finger pad, it is affected by variations in blood pressure and heart rate. Although strain gauge types [Reference Nakatani, Kawaue, Shiojima, Kotetsu, Kinoshita and Wada14] and [Reference Sakuma, Abrami, Blurmrosen, Lukashov, Narayanan, Lingman, Gaggiano and Heisig15] have excellent precision, the former [Reference Nakatani, Kawaue, Shiojima, Kotetsu, Kinoshita and Wada14] lacks a function to detect a three-axis force. Although the latter [Reference Sakuma, Abrami, Blurmrosen, Lukashov, Narayanan, Lingman, Gaggiano and Heisig15] can discern it, detection remains at the qualitative level. Compared to the above methods, in the fingernail image type, the detection precision is improved more than in the LED and photodiode types. Furthermore, note that the fingernail type can detect a three-axis force. Based on the above literature review, we adopted the fingernail image type as our sensor’s sensing principle to improve its precision with a darkroom free design and CNN to capture the subtle differences of fingernail color caused by a three-axis force.
We evaluated our fingernail-color sensor by developing a measurement machine that can simultaneously apply both normal and tangential forces to a human fingertip. This machine is composed of an electronic scale, a load cell, and a slider on a scale. The slider’s linear movement can change its direction from 0
 $^\circ$
to 360
 $^\circ$
to measure any directional tangential force. We measured the normal and tangential forces that were applied to the fingertip by the scale and the load cell. To generate forces with human subjects, the allowances of the tangential and normal forces were demonstrated on a liquid crystal display (LCD) panel where the present force level is measured by the scale and the load cell as a red point. Human subjects adjusted their force to keep the red-point position within a particular allowance. Since the captured fingernail images are recorded by movies, we can quickly obtain much image data, effectively enhancing the precision of a deep learning model.
Although our previous paper showed that our deep learning model can estimate a three-axis force with sufficient precision for individuals [Reference Ohka, Komura, Watanabe and Nomura6], we did not evaluate a generalized model that can be applied to any participant. Here, we introduce three models: whole, individual, and generalized. The whole model: adopted all the data of the participants; individual model: individually used each participant’s data. The generalized model estimated the generic individual force values by alternately removing one participant’s data from the aggregated data. If the generalized model can predict a new participant’s force with reasonable precision, this development will increase the usability of our fingernail-color sensor. In this paper, we examined the generalized model’s adaptability for a new participant whose data are not included in it. In a series of experiments, we added more participants to this study than for our previous paper [Reference Ohka, Komura, Watanabe and Nomura6] and examined the predictive ability for tangential force through the tangential-force trajectory in the
 $F_x$
-
 $F_y$
plane. Finally, we discussed the design and performance of our fingernail-color sensor and compared it with similar ordinary sensors.
2. Three-axis Fingernai-Color Sensor
2.1. Principle
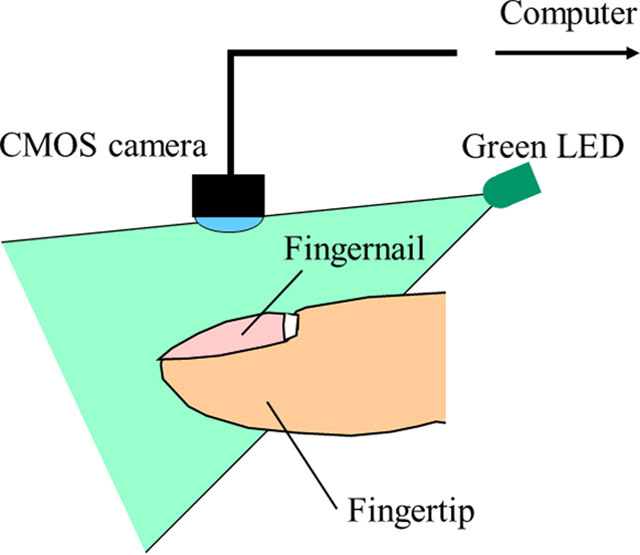
In a three-axis fingernail-color sensor, the fingernail’s image is obtained by installing a miniature complementary metal oxide semiconductor (CMOS) camera in it that estimates the magnitude and the direction of the force applied to a fingertip with regression from machine learning. Since there is no interference between the finger and object surfaces in this method, the live tactile data felt by a person can be quantitatively obtained in real time.
With this method, we must carefully adopt a light source for the fingernail’s illumination because the determination precision depends on the change’s clarity in the fingernail color. We adopted a light source that focuses on the light absorption characteristics of blood. Since a 500 [nm] peak light length is absorbed by hemoglobin in the blood [Reference Maeda, Sekine, Tamura, Suzuki and Kameyama19], we adopted a green LED as the light source. Under such usage, a green LED image darkens in the blood concentration portion and brightens with a weaker blood portion. Since blood distribution fluctuates with the finger’s deformation caused by the applied force, we can estimate the force from the image data of the blood distribution.
Based on the above discussion, we designed our current three-axis fingernail color sensor (Fig. 1), which is equipped with a green LED and a miniature CMOS camera. We adopted a shell-shaped green LED (OSG58A5111A, OptoSupply, wavelength = 525 nm). For the CMOS camera, we adopted a color image sensor (PPV405NT2, Asahi Electronics Laboratory), which has a horizontal angle of view of 130
 $^\circ$
and a maximum frame rate of 30 [fps].
Schematic structure of our fingernail-color sensor.

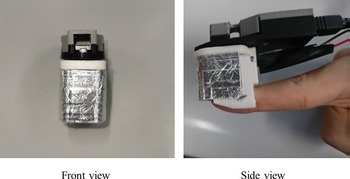
Prototype of the fingernail 5-color sensor.

2.2. Prototype
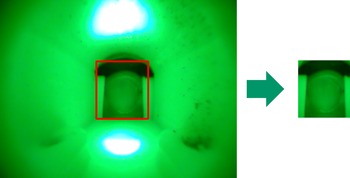
We developed a prototype of a three-axis fingernail-color sensor based on the above principle and produced its casing with a 3D printer to mount it on a human fingertip. The following are its dimensions: 35-mm high, 26-mm wide, and 65-mm long. Its front and side views are shown in Fig. 2, where aluminum foil is attached to the casing. The foil acts as a shield from such external light sources as ceiling lights and sunlight to prevent the camera from obtaining any images affected by them. This image is shown in Fig. 3, where a fingertip is observed in the center. The black crescent is a urethane sponge that fills the gap between the casing and the fingertip. The left panel has 640 (H)
 $\times$
480 (V) pixels from the image sensor’s specifications. From this image, we obtained a 140
 $\times$
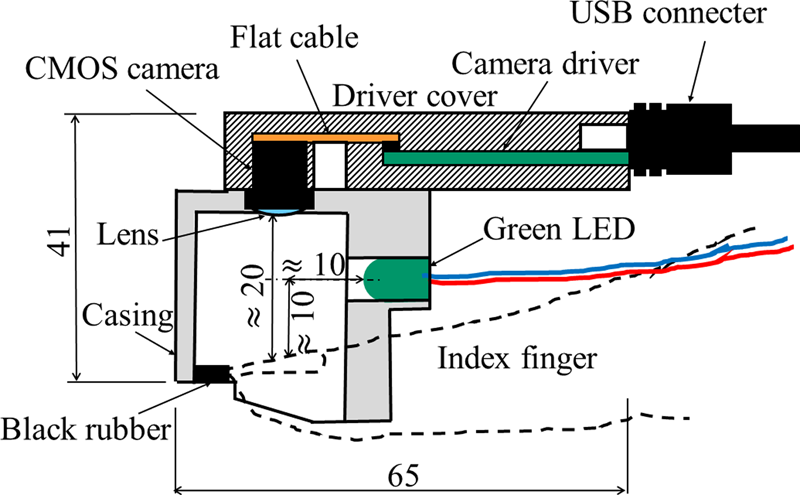
150 [pixels] region of interest (ROI) (Fig. 3, right panel), which is fixed through all the experiments. Since a 20-mm distance between the camera lens and the fingernail is required to obtain an image in focus and a circuit board of a camera driver was installed in the casing (Fig. 4), the fingernail image in Fig. 3 seems small and the sensor in Fig. 2 seems large. Future work will ameliorate these defects by improving the casing design and the selection of the image sensors.
Fingernail image captured by CMOS camera installed in fingernail color sensor to extract ROI.

Cross-section drawing of fingernail-color sensor.

3. Creating Data Set
3.1. Experimental apparatus
For deep learning, we prepared data sets with a series of experiments performed by volunteers. In them, they wore a fingernail-color sensor on their fingertips and touched a piece of equipment that measured the normal force, the tangential force, and the direction values to obtain images that are associated with these force values. Ten people participated in our experiments for the whole model, the generalized models, and the individual models. The mean and the standard deviation of their ages were 24.5 and 2.6 [year]. The set of ten people includes a male assistant professor and nine members of our graduate school (one female). All the tests were approved by the Ethics Committee of Nagoya University.
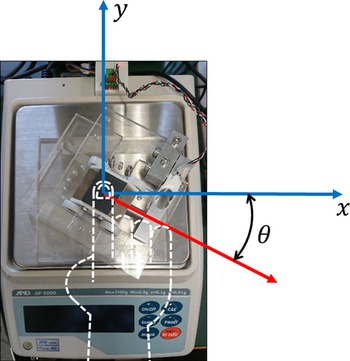
Participant touches top of slider with right index finger and simultaneously applies normal and tangential force to it according to LCD monitor’s instructions.

The force measurement equipment (Fig. 5) is composed of an electronic scale, a slider on wheels, and a load cell. Since the slider moves along two grooves on the top of the base on the scale, it moves along direction
 $\theta$
. Normal force
 $F_z$
is measured by the scale and tangential force, and
 $F_r$
is measured by the load cell. Direction
 $\theta$
is changeable every 30
 $^\circ$
. Tangential force components
 $F_x$
and
 $F_y$
are calculated by the following equations:
 \begin{equation} F_x = F_r \cos \theta \end{equation}
 \begin{equation} F_y = F_r \sin \theta \end{equation}
3.2. Loading procedure
In this section, since deep learning models require big data, we discuss efficient data collecting method using fingernail image videos under various external force conditions in this section.
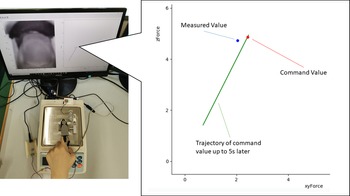
During measurement tests, volunteers sat and faced the equipment and touched the slider’s top surface with their right index finger pad wearing the fingernail-color sensor to apply normal and tangential forces. They adjusted their force to make the blue point match the red point in the LCD monitor (Fig. 6), where the blue and red points show the current measured and reference forces. The green line shows the trajectory within 5-s intervals. Since the update cycle of this graph is 40 [ms], the system acquires a fingernail image, a normal force, and a tangential force every 40 [ms]. The direction of tangential force
 $\theta$
was changed with every 30
 $^\circ$
increase; each volunteer performed 12 measurement tests.
Descriptions of LCD monitor, which shows force reference with red point and instruction history by green line within 5 s: participant adjusted their force that was applied to slider’s top surface to match current force shown by blue point to red point.

In the LCD instructions, the
 $F_z$
and
 $F_r$
references were varied by the sinusoidal motion. Since the
 $F_r$
and
 $F_z$
ratio is decided as a coefficient of friction
 $\mu$
,
 $F_z$
is varied in a range of 0 to
 $F_{zmax}$
with frequency
 $f_s$
:
 \begin{equation} F_z = \frac{F_{z\mathrm{max}}}{2} \left \{1-\cos \left ( 2\pi f_s t \right ) \right \} \end{equation}
On the other hand, since we obtained data under a variety of
 $F_z$
and
 $F_r$
combinations, the amplitude of
 $F_r$
was varied with in-phase cycles of
 $F_z$
in each cycle:
 \begin{equation} F_r = \mu F_{z} \frac{i-1}{n_c-1} \qquad (i = 1, \ldots, n_c) \end{equation}
In Eqs. (3) and (4),
 $F_{z\mathrm{max}}$
and
 $\mu$
are assumed to be 10 [N] and 0.5, and
 $n_c$
and
 $f_s$
are decided by keeping total time
 $t_{\mathrm{total}} \leq 200$
[s] and condition
 $|dF_z/dt| \leq 1$
[N/s] to obtain 5 and 0.025 [Hz]. These conditions on
 $t_{\mathrm{total}}$
and
 $|dF_z/dt|$
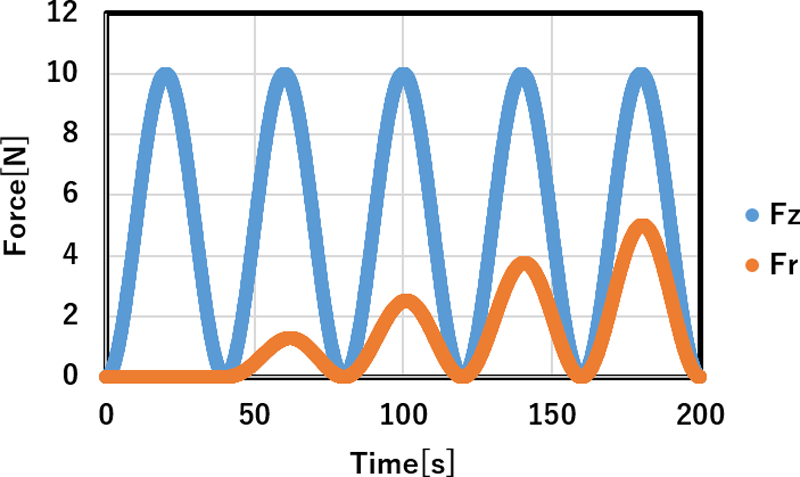
confirmed that all the tests performed for the 12 directions were finished within 1 h and that the variation in force generated by each subject is reasonable. In Fig. 7, the variations of
 $F_z$
and
 $F_r$
are exemplified when we adopt
 $n_c = 5$
and
 $f_s = 0.025$
[Hz]. The peak of
 $F_r$
increases with five steps according to Eq. (4), although
 $F_z$
constantly shows five cycles within 200 [s], according to Eq. (3). Since we adopted 10 [N] as
 $F_{zmax}$
, the load range of
 $F_z$
was 0 to 10 [N], and the load ranges of
 $F_x$
and
 $F_y$
were
 $-$
5 to 5 [N] if the 180
 $^\circ$
different direction is treated as a negative direction. According to the above procedure, we obtained around 62,000 finger images per person from the videos.
Variations of
 $F_z$
and
 $F_r$
used in descriptions of LCD monitor.

3.3. Preprocessing of image data
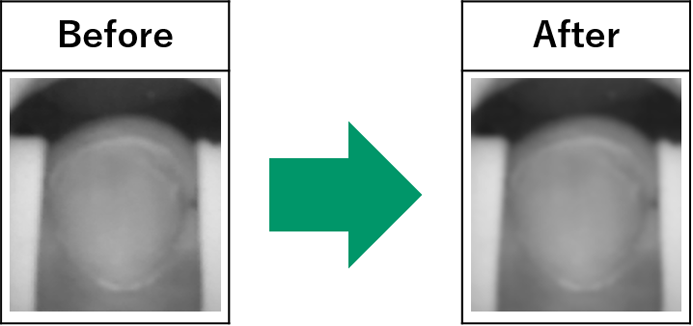
In the previous section, we trimmed the fingernail images to obtain the ROIs (Fig. 3) because the retrieved images had no interesting regions except for the fingernail images. In the following, we describe the image data processing after ROI. Since the green LED’s light is obviously absorbed by haemoglobin, the green image data seem to possess more important information than the red and blue images. Therefore, we only retrieved the green component from the RGB components to obtain grayscale images. Through this processing, image data size was reduced by
 $1/3$
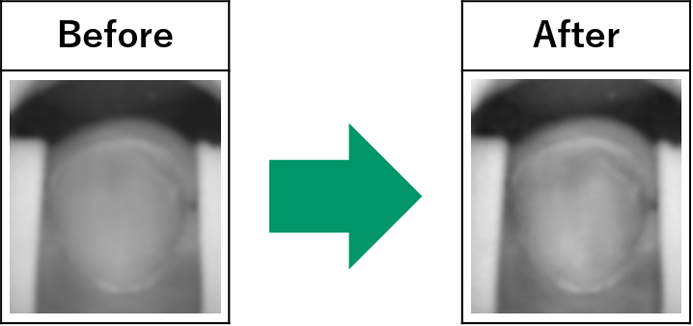
. Next, we applied a Gaussian filter to the grayscale images to reduce the noise in them. Finally, we applied adaptive histogram equalization (AHE) to obtain high contrast images. The results of the Gaussian filter and AHE are shown in 8 and 9.
Gaussian filter.

Adaptive histogram equalization (AHE).

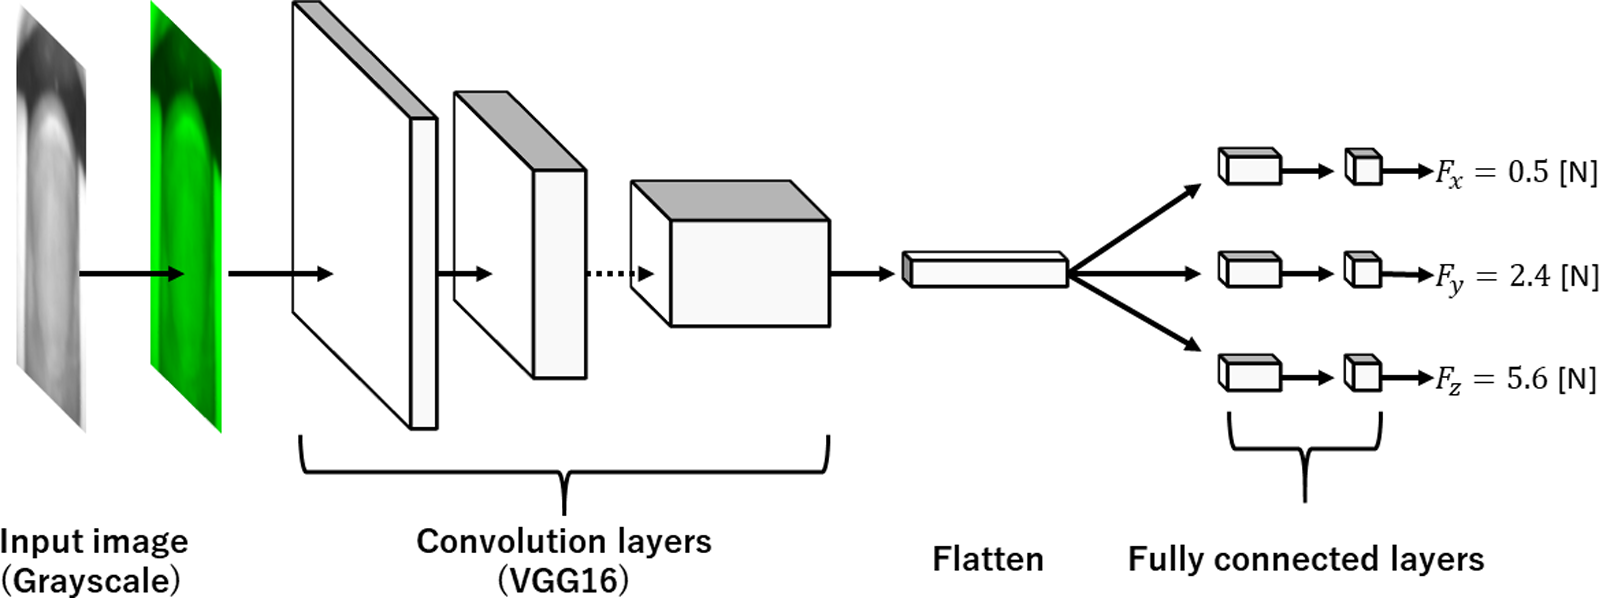
Structure of Deep Learning Model; input image data are process by gray2BGR to obtain RGB data, which are sent to VGG16 and full connected layers to obtain three-axial forces.

4. Multitask CNN
4.1. Network structure
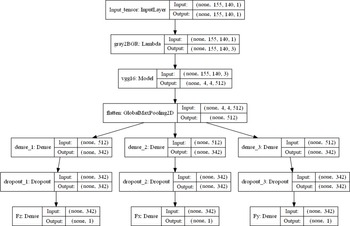
The structure of the deep learning model used in this study and the size of the input–output tensors are shown in Figs. 10 and 11. In this model, we individually obtained three regressions for
 $F_x$
,
 $F_y$
, and
 $F_z$
from the input grayscale images of the fingernails. We used VGG16 [Reference Simonyan and Zisserman18], which is a published model whose learning has already been completed with fine-tuning. Since it needs RGB image data as input, we modified the grayscale image to an RGB image by assuming R and B to be zero using gray2BGR [20] (Fig. 10).
Tensor size of each layer included deep learning model.

To obtain the feature values of the image data, color images are input to a VGG16 composed of 13 convolution layers and three pooling layers. Since the output from the convolution layer is a multidimensional matrix, it is transformed to a one-dimensional matrix to “flatten” it for use in the fully connected layers. In this study, we transformed the output from a VGG16 feature matrix of
 $4\times 4\times 512$
to
 $512\times 1$
vectors using a pooling layer (Fig. 11). After the pooling layer, we added fully-connected layers, composed of hidden, dropout, and output layers. The neuron numbers of the hidden land output layer were 342 and 1. The dropout layer prevents the model from overfitting. We adopted ReLU (Eq. (5)) as the activate function of the hidden layer:
 \begin{equation} f(x)=\left \{ \begin{array}{l} x \quad (x \gt 0)\\[5pt] 0 \quad (x \le 0) \end{array} \right. \end{equation}
The activation function of the output layer was a linear function of slope 1 and intercept 0.
4.2. Learning method
In the learning we used the cost function as following:
 \begin{equation} L =\lambda _x L_x + \lambda _yL_y +\lambda _zL_z \end{equation}
where
 $L_x$
,
 $L_y$
, and
 $L_z$
are the cost functions for
 $F_x$
,
 $F_y$
, and
 $F_z$
. Although
 $\lambda _x$
,
 $\lambda _y$
, and
 $\lambda _z$
are weighted to adjust the three terms to the same magnitude, we assumed
 $\lambda _x = \lambda _y = \lambda _z \equiv 1$
. Furthermore, we assumed the cost functions of
 $L_x$
,
 $L_y$
, and
 $L_z$
are the mean square error (MSE), defined by the following equation:
 \begin{equation} MSE=\frac{1}{n}\sum _{i=1}^n(\hat{y_i}-y_i)^2 \end{equation}
where,
 $\hat{y_i}$
,
 $y_i$
, and
 $n$
are the prediction value of CNN, the true value, and the amount of data. For example, to obtain
 $L_x$
,
 $\hat{(F_x )}_i$
, and
 $(F_x )_i$
are substituted for
 $\hat{y_i}$
and
 $y_i$
, respectively.
We define Root Mean Square Error (RMSE), which will be used below as follow:
 \begin{equation} RMSE=\sqrt{MSE} \end{equation}
For the hyperparameters, we assumed the epoch number and batch size to be 50 and 128. We used Adam [Reference Kingma and Ba21] for the optimization problem with the following parameters:
 $\alpha = 1.0 \times 10^{-4}$
,
 $\epsilon = 1.0 \times 10^{-7}$
,
 $\beta _1 = 0.9$
, and
 $\beta _2 = 0.999$
. For the learning rate decay, we adopted decay
 $=1.0 \times 10^{-6}$
. The data set was divided into two parts: learning (85%) and evaluation (15%).
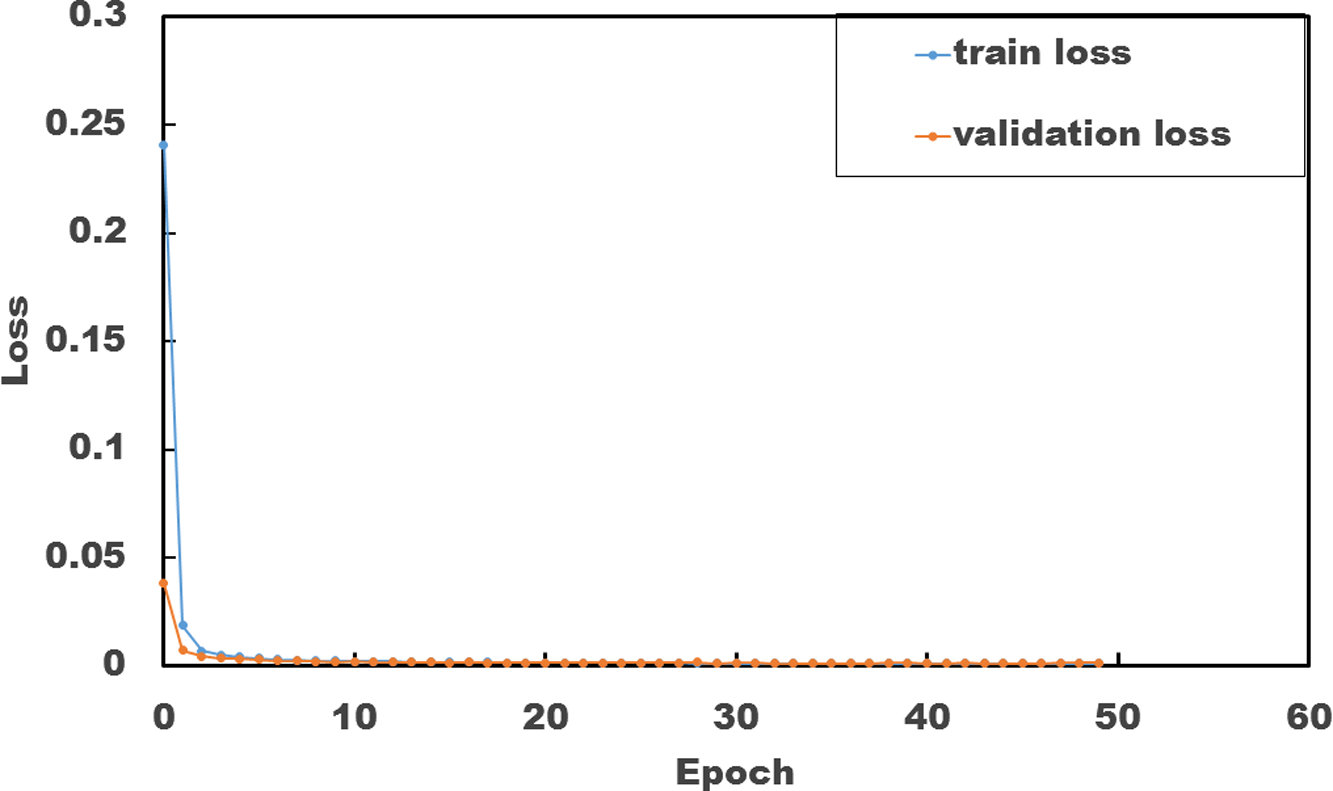
Variation in loss of a whole model.

4.3. Whole, individual and generalized models
Obtaining a generalized CNN model that can evaluate the images of any person’s fingernails would be very useful because no additional learning process is required after obtaining generalized models. In the future, we plan to include more subjects and use big data analysis. Unfortunately, since we presently have a limited number of subjects (ten), we developed these three basic models. We therefore define our generalized model as one that alternately removes each participant’s data from the aggregated data to create we have ten generalized models. In this paper, we addressed a model without a specific person’s data can estimate the generated force of fingertips with sufficient precision by comparing the following three models:
-
• a whole model, which adopted all the participants’ data;
-
• an individual model, which individually used each participant’s data;
-
• a generalized model, which estimated the generic individual force values by alternately removing one participant’s data from the aggregated data
5. Result and Discussion
5.1. Precision of whole model
To show the CNN training process and results, Fig. 12 exemplifies the loss curves for training and the validation of the ten subjects because individual and generalized models have similar loss curves. The results for the loss curves show that the losses quickly tend toward zero; there are no significant differences between the training and validation losses. The above results show no overfitting.
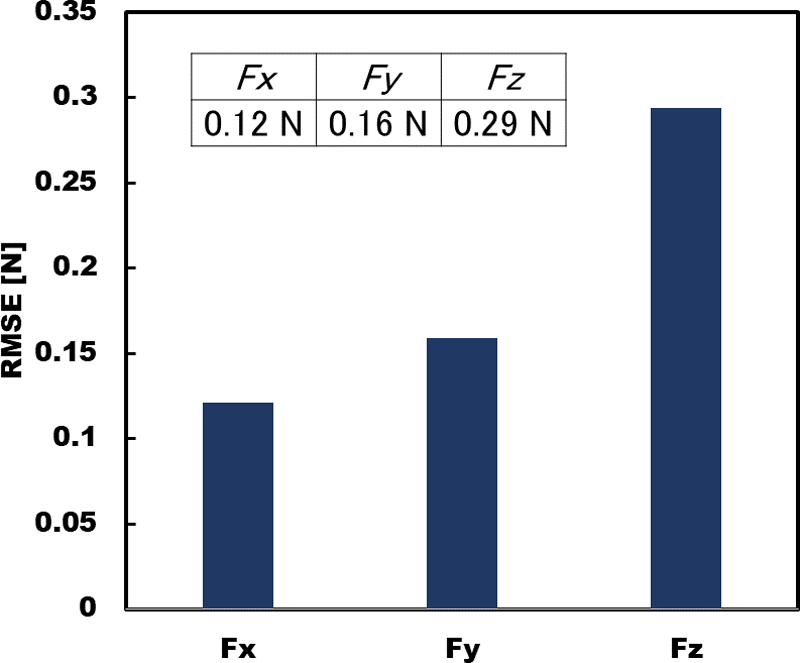
For each force component, the RMSEs are shown in Fig. 13 to elucidate whether fingertip-force estimation is possible with deep learning. When we compared the results of shear forces
 $F_x$
and
 $F_y$
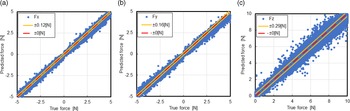
with the vertical force result, we found that the fingertip force can be estimated by deep learning and that its estimation accuracy is better for shear force than for vertical force because a fingernail’s brightness variation is smaller than the blood distributions. We show the relationship between the magnitudes of the error and force components in Figs 14 (a), (b) and (c). The RMSEs are shown by the width of yellow lines. In these results, the predicted forces, which are expressed by filled circles, congregate along the linear line showing
 $\pm$
0 N (no error) in Figs. 14 (a) and (b). The scattering width of normal force in Fig. 14 (c) is exceeds that of the shear force. These results show that our model satisfactorily estimates the applied force components. Furthermore, the results in Fig. 14 are almost identical as those of the individual models that were previously shown [Reference Ohka, Komura, Watanabe and Nomura6].
Comparison of estimation precision between tangential and vertical forces obtained from estimations of the whole model.

Correlation between estimated and true values of whole model: (a)
 $F_x$
; (b)
 $F_y$
; (c)
 $F_z$
.

5.2. Precision of generalized models
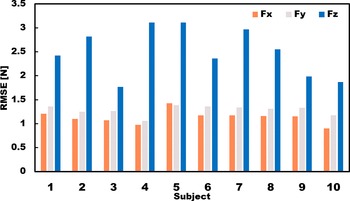
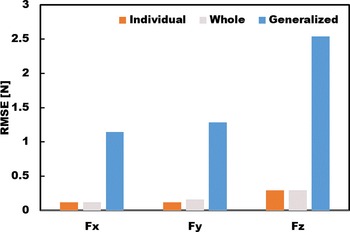
If the generalized model is useable, no model parameter tuning is required for additional participants. To confirm this, we produced ten generalized models, whose data sets were composed of the data of nine people by excluding the data of a specific person from the data of ten participants. Each generalized model was evaluated with each specific person’s data to obtain the RMSEs. The RSMEs of the generalized model are ten times greater than the one of the whole model (Fig. 15).
RMSE of each generalized model.

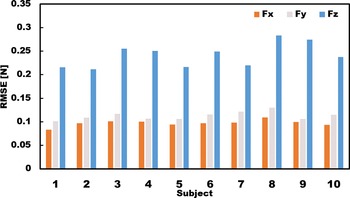
Next we evaluated the individual model obtained from the individual data. The RSMEs of ten individual models are shown in Fig. 16. Although the result of the vertical force evaluation shows a relatively large RMSE, the value is within 0.3 N, which is around 20% of the smallest value of the generalized model. For a tangential-force estimation, the RMSEs of individuals are significantly smaller, around 1/10 of the generalized models, by the ordinate ranges of Figs 15 and 16.
RMSEs of individual models.

To select the best model among the three types (whole, general, and individual models), we compared these models in Fig. 17. The RMSEs of the general and individual models are mean values of Figs 15 and 16. The RMSEs of generalized model are much larger than ones of others, although there is no obious difference between the whole and individual models. However, the whole model requires a couple of days to learn the data set composed of the data of ten people, and each individual model can be obtained within around 130 min. with A NVIDIA GeForce RTX3080. Since individual model tuning is possible through a specific person’s data set before measurement, we temporally adopt the individual model as the best one in the following discussion.
Comparison of three models.

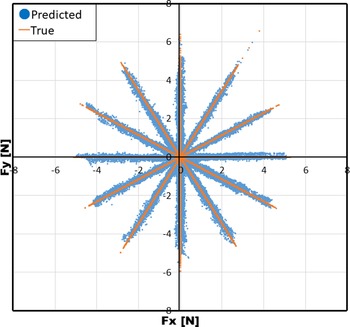
Finally, we show the tangential-force estimation capability of the individual model because tangential force frequently occurs in such tasks as stroking, massage, and creating pottery. Fig. 18 shows an evaluation of the tangential-force trajectory obtained from the 360
 $^\circ$
test described in Section 3.2. The estimated points in the
 $F_x$
-
 $F_y$
plane are assembled along the correct directional trajectory shown with solid lines. Since the largest deviated direction is within around
 $\pm$
2.5
 $^\circ$
, our current fingernail three-axis tactile sensor has excellent capability for the tangential-force direction.
Radial trajectory produced by estimated tangential force components.

5.3. Comparison with Previous Studies
Next we survey the previous works cited in Introduction before comparing our work with them. Since we adopted previous woks [Reference Nakatani, Kawaue, Shiojima, Kotetsu, Kinoshita and Wada14] and [Reference Grieve, Lincolon, Sun, Hollerbach and Mascaro16] were adopted as papers for comparison among the above works because they showed that RMSE can express their precision, we explain both papers [Reference Nakatani, Kawaue, Shiojima, Kotetsu, Kinoshita and Wada14] and [Reference Grieve, Lincolon, Sun, Hollerbach and Mascaro16] are explained below.
First, Nakatani et al. [Reference Nakatani, Kawaue, Shiojima, Kotetsu, Kinoshita and Wada14] produced a wearable contact force sensor system based on finger pad deformation. When the finger pad accepts contact force, horizontal deformation of the finger is occurred in it. In the sensor system, the horizontal deformation is measured by a fixture on finger pad equipped with strain a gauge. The sensor system’s RMSE in estimation contact force was about 0.2 N. It is noted that this system can only detect normal directional contact force.
Grieve et al. [Reference Grieve, Lincolon, Sun, Hollerbach and Mascaro16] produced a fingernail image type sensor system that uses the average value of the pixel data in each cell of the fingernail images acquired in a darkroom. The force components are assumed to be a linear combination of cell intensities:
 $\mathbf f = \mathbf A \mathbf p$
, where
 $\mathbf f$
,
 $\mathbf A$
, and
 $\mathbf p$
are a force vector, a coefficient matrix of a linear equation, and a pixel vector having
 $m$
cell intensities. In the system, the RMSE in the shear directions is 0.3 N, 6% of the full range, and the normal force has an error of 0.3 N, 3% of the full range.
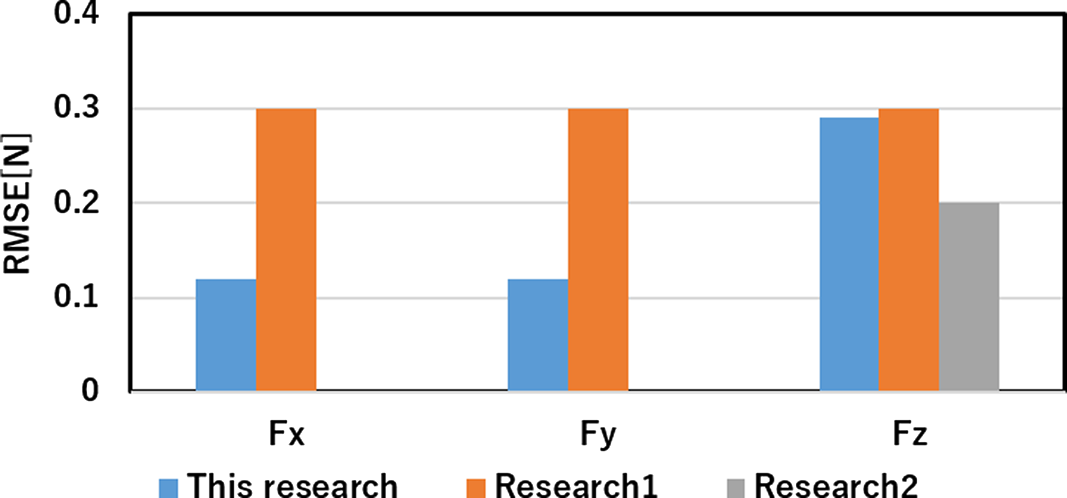
Figure 19 compares the current and previous models. Since a model using deep learning might enhance the precision with more participants, we expect it will be enhanced with more participants in future work. Nevertheless, the RMSE value for
 $F_z$
is almost identical to a previous study [Reference Nakatani, Kawaue, Shiojima, Kotetsu, Kinoshita and Wada14]. Compared to normal force precision, the tangential force’s RMSE is around 1/3 of the previous study [Reference Grieve, Lincolon, Sun, Hollerbach and Mascaro16]. Therefore, this fingernail-color sensor provides precision that resembles that of a tactile sensor that measures the tactile sense felt by those who are working with their hands.
Comparison between current and previous models: Research 1 shows reference result [Reference Grieve, Lincolon, Sun, Hollerbach and Mascaro16]; research 2 shows reference result [Reference Nakatani, Kawaue, Shiojima, Kotetsu, Kinoshita and Wada14].

6. Conclusion
We developed a three-axis fingernail-color sensor and mounted it on a human fingertip to achieve a tactile recording system that captured tactile senses during hand manipulations. It can detect both tangential and normal forces because people manipulate objects and tools by as grasping, picking, rubbing, etc.
Although our previous paper did not evaluate a generalized model that we applied to any participant, we examined its adaptability for a new participant whose data are not included in it. We examined its predictive ability for tangential force through the tangential-force trajectory in the
 $F_x$
-
 $F_y$
plane. Finally, we discussed the design and performance of our fingernail-color sensor and compared it with similar ordinary sensors.
We experimentally found that since the generalized model’s RMSE exceeded than both the whole and individual models, we adopted the latter because it precisely evaluated the tangential-force direction in the
 $F_x$
-
 $F_y$
plane within around
 $\pm$
2.5
 $^\circ$
error. Experimental results showed that although the fingernail-color sensor possessed almost the same level as previous sensors, the RMSE obtained from the tangential-force tests was around 1/3 of a previous study [Reference Ohka, Komura, Watanabe and Nomura6].
Author contributions
M.O. and H.K. conceived and designed the study. K.W. designed and produced the equipment. K.W. and Y.C. conducted data gathering. Y.C. performed statistical analyses. M.O. and H.K. wrote the article.
Financial support
The authors acknowledge the support of JSPS Kakenhi Grant Number 22H01444.
Conflicts of interest
The authors declare no conflict of interest.
Ethical approval
All the tests were approved by the Ethics Committee of Nagoya University.