

I. Introduction
“THAT’S when I was, like, ‘I’m black,’ you know?” These are the words of Jorge, a university student living in Recife, a coastal city in northeastern Brazil. Like many other Brazilians I met, Jorge told me he’s classified as white on his birth certificate, but today he selfidentifies as black. Recounting the details of his personal transformation, he explained that growing up, he didn’t much think about himself in racial terms, per se. But later, while in university, he came to understand many of his past experiences as profoundly racialized. In Jorge’s words, he came to “discover [him]self ” as black.Footnote 1
Tiago, another university student in Recife, told a similar story. Like Jorge, Tiago reported that he’s classified as white on his birth certificate but today identifies as black. He explained that his racial transformation began at a black movement event that his university friends inadvertently led him to. There, Tiago heard personal anecdotes of racism recounted by movement activists. He told me he was surprised by how much their stories resonated with him, leading him to ask himself, “How had I not realized this before?” He said, “I looked back and said ‘Jeez, that all happened to me because I was black. Because I am black.’ It was really just like that. It was a discovery.”Footnote 2
In many ways, there’s nothing remarkable about the racial trajectories of these two young men in Brazil, where the fluidity and ambiguity of racial boundaries have long enabled individuals to change their racial self-identifications—that is, to reclassify.Footnote 3 In this context, such boundary-crossing was not only permitted, but commonplace. Yet the very history of boundary-crossing makes these accounts significant. For although Brazil is known for racial fluidity, it’s also known for racial stratification and veiled racism, which have long been said to incentivize reclassification toward whiteness when possible.
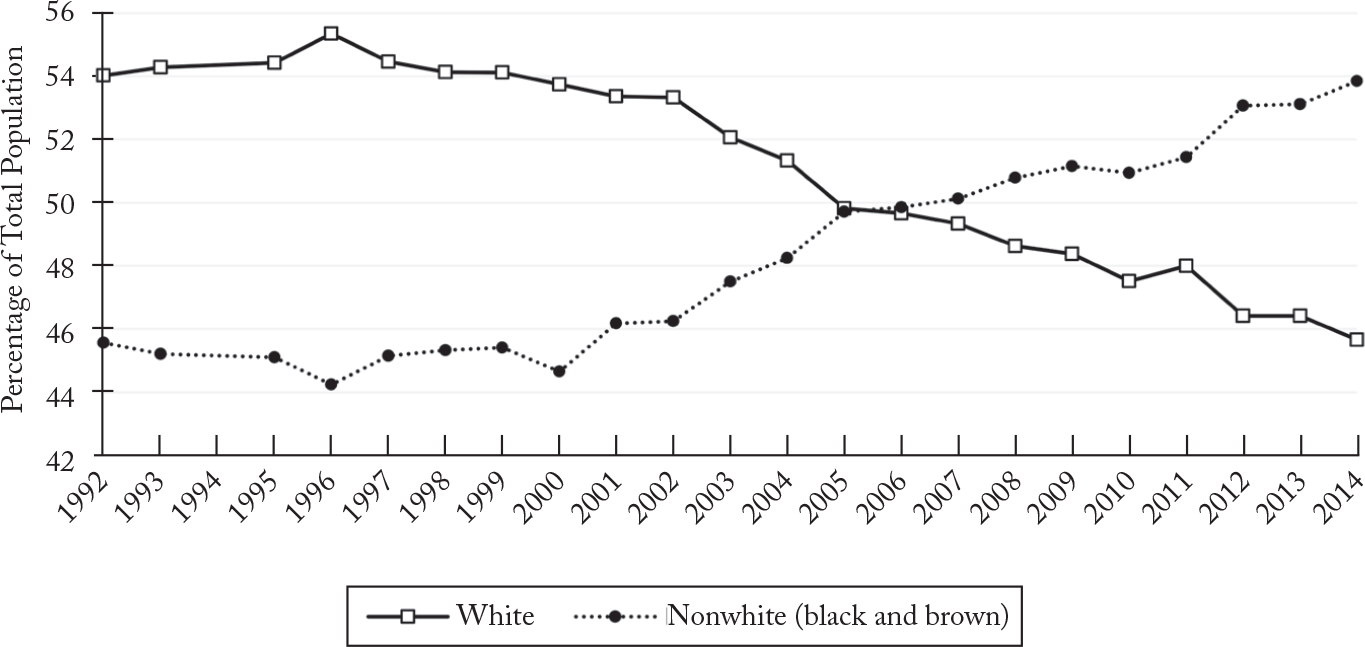
Not so since the early 2000s. In recent years, many Brazilians have come to demonstrate a marked and growing tendency to reclassify instead toward blackness. Figure 1 shows the racial composition of Brazil from 1992 to 2014, as determined by the census bureau. Indeed, between the 2000 and 2010 censuses, Brazil’s population turned from majority white to minority white—a sudden structural shift that cannot be explained by demographic trends or changes in census enumeration practices. Instead, it has become abundantly clear that Brazilians are increasingly adopting the stigmatized labels of blackness.Footnote 4
Racial Composition of Brazil, 1992–2014
Sources: PNAD 2015 and national census data from the Instituto Brasileiro de Geografia e Estatística, at https://www.ibge.gov.br/estatisticas/sociais/trabalho//9662-censo-demografico-2010.html.

This article leverages the sudden reversal in patterns of racial reclassification as a rare opportunity to shed new theoretical light on the processes of identity politicization. Empirically, I explain why Brazilians are increasingly adopting nonwhite identities, why so suddenly, and why, in apparent defiance of the conventional wisdom, that reclassification typically occurs toward whiteness. In so doing, this study contributes to the broader theoretical agenda of understanding the identity-topolitics link, that is, the processes that lead from social categories to politicized identities to group and collective politics.Footnote 5 I focus specifically on one element of these processes, the formation of a group consciousness that shapes one’s perception and understanding of power—what I refer to as political identity.Footnote 6 Despite calls from scholars to better understand the ways that identities “harden, congeal, and crystallize,”Footnote 7 there are relatively few empirical and systematic analyses of the microlevel processes of political identity formation. Aiming to fill this gap, this article directs attention to the ways in which recent efforts at educational expansion have reshaped individuals’ self-understandings, have led them to cross previously recognized social boundaries, and have imbued newfound identities with political meaning.
Drawing on original field research and systematic analyses of microlevel census and national survey data, I argue that the reversal in patterns of reclassification is the consequence of expanded access to education, which has unintentionally led many Brazilians to develop racialized political identities. State-led efforts to better include “outsider” citizens through social policy expansion have unleashed unprecedented waves of upward mobility for members of the lower classes,Footnote 8 many of whom have options in their racial identifications and are traditionally susceptible to practices known as whitening. Greater access to secondary and university education, in particular, has increased the exposure of newly mobile citizens to information, social networks, and the labor market. In turn, this increased exposure has brought many face-toface with racial hierarchies and inequalities in their pursuit of upward mobility, altering the sets of personal experiences that inform their racial identifications and political identities. Brazilians are increasingly choosing and politicizing blackness as an articulation of these newfound and racialized political identities.
The account of identity politicization I advance in this article departs from dominant theories, which have coalesced around instrumentality. Whether as mobilization from above,Footnote 9 from below,Footnote 10 or simply as a political means to a material end,Footnote 11 scholarly accounts focus on institutions and incentives as the primary determinants of the identities politicized and articulated in various political arenas. Those familiar with Brazil will quickly point out that at first glance, such accounts would seem to apply to the Brazilian case because the country began experimenting with race-targeted affirmative action policies in recent years.Footnote 12
Journalists and public intellectuals often cry foul regarding the incentives for blackness and so-called fraud that Brazil’s policies are said to generate.Footnote 13 But such crude instrumental motivations struggle to account for long-term identity change in this context of racial fluidity and stigmatized blackness, given the very conditions and social forces that have long disincentivized blackness in the first place. Instead, the argument I develop focuses on how the state’s allocation of education, a key right of social citizenship,Footnote 14 can empower citizens to challenge social hierarchies and articulate stigmatized identities in the political arena. In other words, my account draws attention to the ways in which citizenship institutions (the accessibility of education) can interact with social structures (social hierarchies and inequalities) to shape the microlevel processes of identity formation and politicization.
The Brazilian case is particularly well positioned to offer insights into these processes. To the extent that Brazil has appeared in the literature on ethnoracial politics, scholars have noted the weak politicization of racial differences.Footnote 15 Indeed, Brazil is typically analyzed as a puzzling case for the relative absence of racial politics, which either demands explanationFootnote 16 or offers crucial variation on variables of theoretical interest.Footnote 17 Scholars agree that race has been politically relevant in Brazil only insofar as elites have disarticulated racial differences by constructing a national myth that is racially inclusive, whitewashing Brazil’s history as the single largest and longest-running participant in the slave trade and the legacies of slavery for understanding present-day inequalities.Footnote 18 Previous scholarship suggests therefore that Brazil would be an unlikely case for the formation of political identities rooted in racial categories of social membership. But at the same time, the fluidity of racial boundaries renders the case a “region of exception”Footnote 19 where such identity change is not only possible on such a wide scale, but also possible to detect and analyze both empirically and systematically.
In what follows, I first motivate the puzzle by laying to rest simple explanations for demographic change and by emphasizing that conventional scholarly wisdom expects whitening. I then elaborate the political identity hypothesis introduced here and illustrate causal mechanisms before presenting systematic tests of the hypothesis. Before concluding, I test an alternative instrumental hypothesis based on affirmative action and address additional potential explanations.
II. The Puzzle of Racial Reclassification
Given Brazil’s fluid racial boundaries, apparent patterns of reclassification might be dismissed as products of changing classification schemes or intergroup differences in demographic trends.Footnote 20 But during the period in question (1990s to the present), the census bureau’s enumeration practices haven’t changed. Nor has there been any demographic trend that explains the sudden shift in racial composition: international migration is virtually nonexistent; nonwhite mortality rates exceed white mortality rates; and the racial fertility gap has been narrowing for decades, suggesting that the relative proportion of nonwhites should be declining.Footnote 21
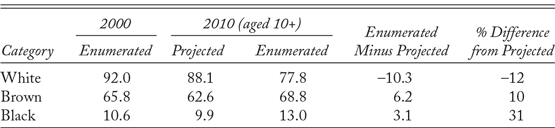
Demographic analysis confirms that significant reclassification into nonwhite categories has indeed occurred. Table 1 compares the populations enumerated in the 2010 census to projections based on demographic trends from the 2000 census. These estimates reveal that the enumerated white-identified population was 12 percent smaller than projections anticipated, and brownand black-identified populations were 10 and 31 percent larger, respectively.Footnote 22 The question, therefore, is not whether Brazilians are reclassifying in darker racial categories, but why.
Estimates of Inter-Census Racial Reclassification, 2000–2010a

Source: Miranda 2015.
a Population figures are in millions.
This question is sharpened by the fact that reclassification itself isn’t a new phenomenon in Brazil.Footnote 23 High rates of miscegenation and the absence of racial group membership rules have produced a fluid system of classification in which Brazilians self-identify according to flexible phenotypic criteria rather than rigid descent rules.Footnote 24 Brazilians possess rich lexicons to characterize racial (or “color”) differences, including labels that deviate from official census categories.Footnote 25 Moreover, the subjective understanding of race is intertwined with notions of class, often referred to as “social race.”Footnote 26 As Nelson do Valle Silva describes, “Given some phenotypic combination, the higher the socioeconomic position of the individual at the moment of classification, she will be classified that much closer to white.”Footnote 27 This complexity and ambiguity, therefore, allows individuals to place themselves in categories that differ from those ascribed to them, and to reclassify themselves over time.
But to the extent that reclassification occurred in the past, it reflected the practices of whitening. Conventional wisdom holds and empirical analyses have shown that Brazilians traditionally capitalize on racial fluidity to reclassify into lighter categories.Footnote 28 Indeed, anthropology and sociology are replete with examples documenting this phenomenon, captured in the adage, “Money whitens.”Footnote 29 Given this context, an individual’s racial self-identification may indicate genuine self-conception, but it may also be a strategy for evading the stigma associated with blackness. In other words, whitening allows individuals to attempt to “avoid identification with the lowest echelon of the social order,”Footnote 30 inevitably reproducing racial hierarchies by implying through behavior that whiteness is preferred.
The idea that racial identification in Brazil can reflect a stigma-minimizing strategy finds broad support. Carl Degler famously characterized mixed-race identification as an “escape-hatch,”Footnote 31 and ethnographers have long documented the ways darker-skinned Brazilians are socialized to internalize racial hierarchies, even within families.Footnote 32 “AfroBrazilians,” writes Elizabeth Hordge-Freeman, “engage in racial bargains, compromises that are often made ambivalently, in which [they] may comply with racial hierarchies in exchange for perceived payoffs that may be political, economic, psychological, or even affective.”Footnote 33
Moreover, not only have scholars documented rampant discrimination against the darker-skinned for decades,Footnote 34 but recent analyses also reveal that Brazilian parents are more likely to invest in education for their lighter-skinned children,Footnote 35 and that Brazilians earn higher wages when their employers perceive them as lighter-skinned.Footnote 36
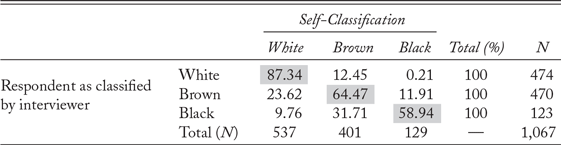
There are considerable incentives, therefore, for the potential targets of racialized discrimination to comply with racial hierarchies by approximating whiteness. Table 2, which cross-tabulates respondents’ self-classifications in official census categories with the classifications assigned to them by survey interviewers, shows how these incentives can indeed shape patterns of identification. The likelihood of category mismatch increases monotonically as the spectrum moves from white to black; among those classified as brown by interviewers, mismatched respondents are twice as likely to opt for a lighter category over a darker one, and nearly 10 percent of those classified as black self-classify as white, compared to almost none of those classified as white self-classifying as black.Footnote 37
Racial Classification Mismatch Indicates Whitening

Source: Pesquisa Social Brasileira 2002.
It’s clear that whitening was the dominant trend at the time of this survey (the early 2000s). But it’s also clear that many Brazilians have racial options. Among them are “exit” and “voice.” Conventional wisdom leads us to expect racial exit: self-whitening and compliance with racial hierarchies to “defend [one’s] welfare or to improve [one’s] position.”Footnote 38 Social identity theory also predicts exit, when possible, from categories that don’t contribute positively to the individual’s self-concept.Footnote 39 By contrast, more recent patterns of reclassification suggest that growing numbers of Brazilians are choosing racial voice—“political action par excellence”—by defying the social forces and the commonsense logic that valorize whiteness.Footnote 40 Recent patterns therefore present a puzzle that conventional wisdom didn’t anticipate and can’t explain: Brazilians are seemingly and increasingly opting for voice over exit.
III. Theory: Racial Reclassification as Political Identity Formation
I argue that the sudden reversal in patterns of racial reclassification is the unintended consequence of expanded access to education, which has led many lower-class citizens to develop racialized political identities and to choose blackness. The Brazilian state played an important, if indirect and unintentional, role in reversing patterns of reclassification through its unprecedented efforts to include outsider citizens via social policy expansion. Democratization and the ratification of a new federal constitution in the late 1980s increased political competition for the votes of the poor.Footnote 41 New electoral incentives and the codification of universal social rights helped to generate the political will for politicians on the right and the left to promote social policy expansion that targeted lower-class sectors. The result was an impressive wave of upward mobility and, notably, an unprecedented improvement in access to secondary and higher education for even the most disadvantaged in Brazil’s income structure.
For many in the lower classes—who are darker-skinned on average, and traditionally susceptible to the practices of whitening—access to education interrupted the status quo by increasing the exposure of these newly mobile citizens to information, social networks, and the labor market. This greater exposure has brought many face-to-face with racial hierarchies and inequalities in their pursuit of upward mobility, altering the personal experiences and subjectivities that inform their racial identifications and the bases on which they make sense of power relationships—their political identities. So conceived, the growing identification with nonwhite racial categories can be understood as an articulation of newfound and racialized political identities.
Macrolevel Change: State-Led Educational Expansion
Efforts at educational expansion followed a number of institutional changes in the Brazilian state in the late 1980s, most notably a democratic transition and the ratification of a new federal constitution. Democratization, of course, reinstated elections and made politicians more responsive to the public. But critically, the new constitution codified universal social rights—including the right to education—and lifted literacy requirements for political citizenship. With the return of elections and a newly expanded franchise, political elites suddenly found themselves competing for the votes of the poor masses.Footnote 42 Moreover, mainstream political parties to the left and right of center shared an interest in undercutting the clientelistic politics of traditional parties by embracing programmatic appeals.Footnote 43 Democratization also created more space and opportunity for social movement actors and organizations to leverage international norms and alliances in their efforts to pressure the state into explicitly acknowledging racial differences, discrimination, and inequalities.Footnote 44 As a result, mainstream politicians and parties converged around the need to address the country’s profound inequities.
This array of institutional changes provided the incentives and political will for governments to create, expand, and reform social policies for the poor, unleashing an impressive wave of upward mobility for lower-class sectors.Footnote 45 Education was one domain that the state focused on, seeking to expand the quality of and access to public education. Under the center-right governments of the mid-1990s and early 2000s, federal education reforms targeted primary and secondary education, setting forth a new national education curriculum and mandating subnational spending floors, federal funds for underresourced localities, new resource-allocation formulas to incentivize student enrollment, and new channels of resource delivery to circumvent political bargaining between state and local governments.Footnote 46 In the 2000s, education spending reached the average level of spending in oecd countries, and educational inequalities declined markedly.Footnote 47 Center-left governments continued these trends in the 2000s, bolstered by auspicious economic conditions. They expanded university enrollments, established new public universities, created scholarship and financial aid programs for private universities, and centralized the university entrance exam and application process.Footnote 48 School attendance was also incentivized as a central conditionality of Brazil’s massive cash transfer program, which targeted the poorest households. And not least of all, the state explicitly sought to include marginalized social groups in higher education through meansand race-targeted affirmative action policies.
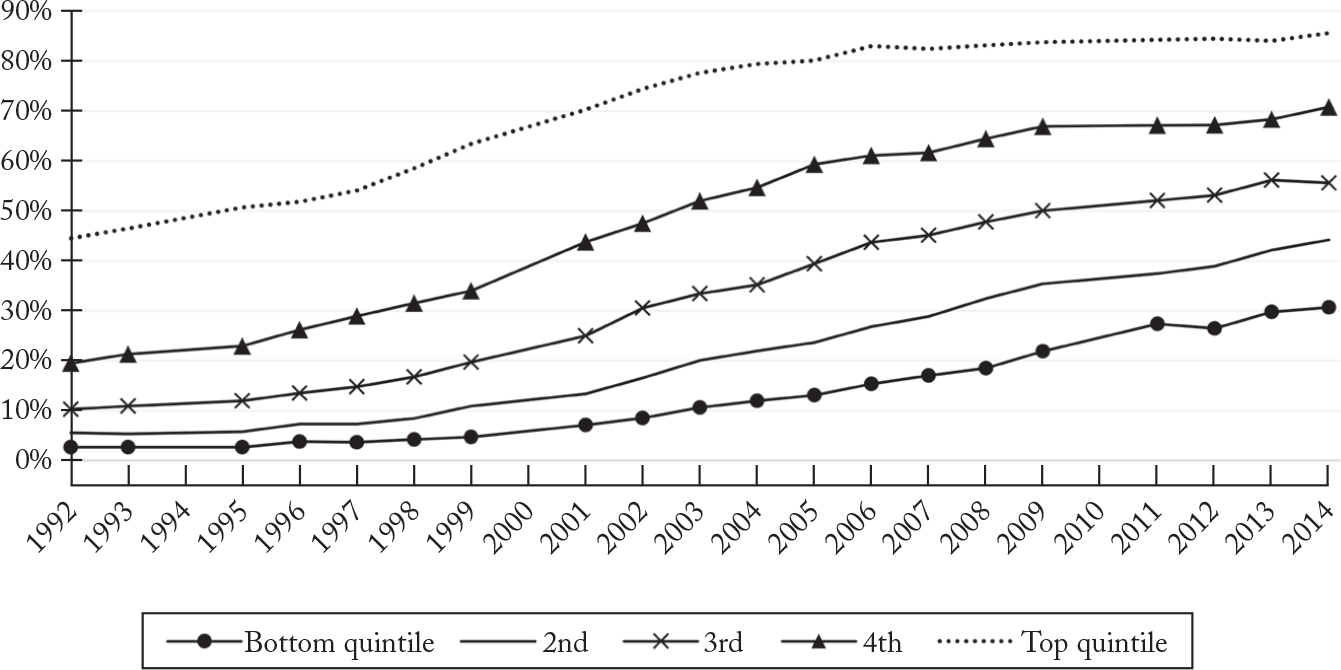
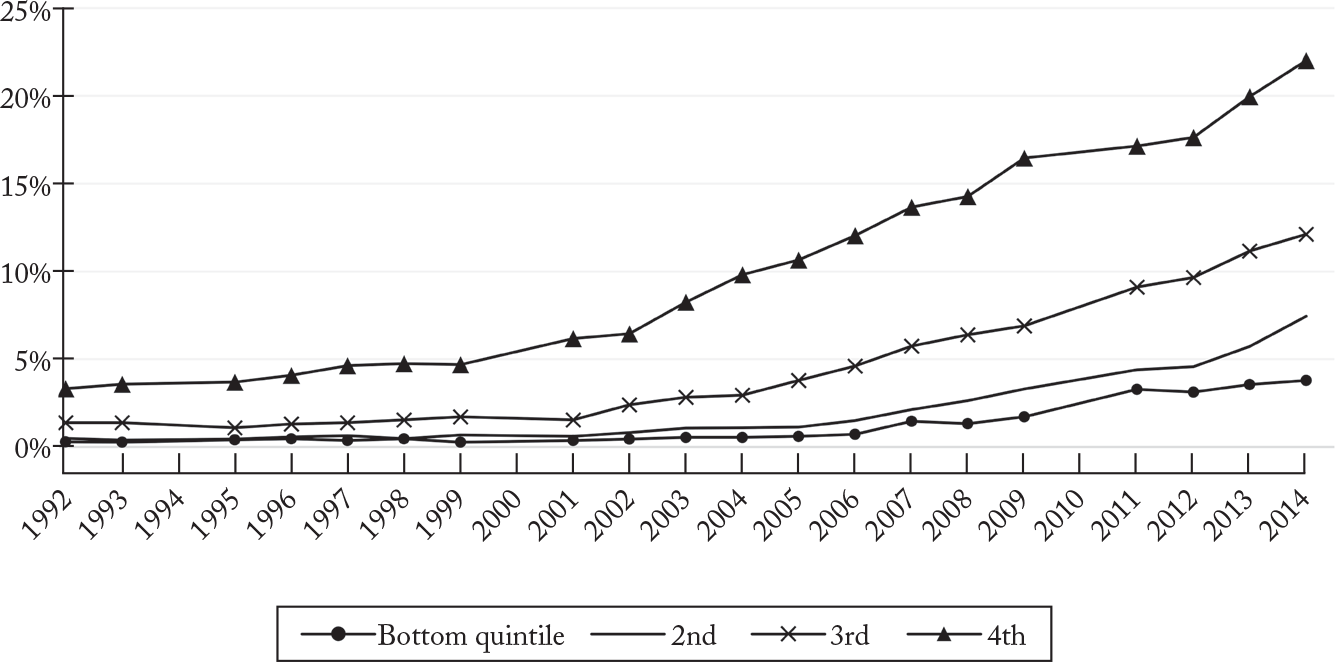
These reforms led to marked improvements in student performance and attendance,Footnote 49 as well as in the accessibility of secondary and university education.Footnote 50 Indeed, during this period economic activity among the high school–aged fell by half, indicating a greater commitment to education in younger cohorts.Footnote 51 And education completion rates were (and continue to be) higher than ever. Figure 2, which displays these rates by income quintile, shows significant gains among the universityaged from 1992 to 2014. Particularly striking are gains in the bottom quintile, which registered a tenfold increase from 3 to 30 percent in this period. Among those in the middle-income quintile, high school completion rates increased from a mere 10 percent in 1992 to 55 percent by 2014.Footnote 52
Brazilians Aged 18–24 with High School Completed by Income Quintile, 1992–2014
Source: PNAD 2015.

Figure 3 shows similar trends for university access. Notable increases for all income levels are again evident, particularly in the 2000s. Individuals in the middle quintile saw their access increase from roughly 1 to 12 percent. Individuals in the two lowest-income quintiles saw their access increase from virtually zero in 1992 to 4 and 7 percent, respectively, by 2014. University access in these lowest-income sectors remains modest, but considering that in 1992 these sectors had virtually no access whatsoever, the recent gains represent an unprecedented university enrollment of the most disadvantaged. It’s indisputable that the state’s efforts at social policy expansion resulted in marked improvements in educational access for lower-class sectors.
Brazilians Aged 18–24 with Some University Education by Income Quintile, 1992–2014a
Source: PNAD 2015.
a The top income quintile, which has the greatest university access, is omitted for the sake of visibility.

Microlevel Consequences: Education as Exposure
At the microlevel, understanding the effects of educational expansion on patterns of reclassification requires attention to its consequences for these lower classes who, besides having scant access to education in past decades, are darker-skinned on average, as confirmed by sociological research.Footnote 53 Despite the emphasis on the complexity of Brazilian racial subjectivity, data indicate that a large majority of Brazilians nonetheless agree that physical attributes are the greatest determinants of racial classification, followed by socioeconomic criteria.Footnote 54 And despite the emphasis on upward mobility in studies of whitening, ethnographic research has long documented whitening practices among lower-class Brazilians, who are socialized to comply with racial hierarchies and distance themselves from blackness.Footnote 55 Thus, lower-class sectors are likely candidates for reclassification because they’re best positioned to make plausible claims to nonwhiteness in phenotypical terms, and yet in the status quo they’re also likely to comply with commonsense racial hierarchies.
For many in these sectors, educational expansion has interrupted this status quo. Building and expanding on the work of Gabrielle KruksWisner, who emphasizes the role of social and spatial exposure in shaping the exercise of citizenship,Footnote 56 I argue that education too can operate as a form of exposure and play a role in reshaping individuals’ racial self-understandings and the political meaning of these identities. Of course, individuals pursue education for decades and with a variety of motivations, not least of which is upward mobility itself. But particularly for individuals from lower-class backgrounds, who previously had scant access to education and who are often subject to—and might even participate in—informal institutional racism, unprecedented access to education can also bring sudden exposure to new information, social networks, and/or experiences in the labor market (each of which I elaborate below). These new forms of exposure can alter the personal experiences that inform how individuals understand themselves in racial terms and how they make sense of power relationships.
The notion that education and upward mobility can shape the nature of racial identities builds in part on findings on racial consciousness in the United States. Following the US civil rights movement, scholars found that contrary to expectations, upward mobility deepened blacks’ politicized racial consciousness. Indeed, it was the growth of the black middle class that gave rise to Michael Dawson’s seminal notion of “linked fate.”Footnote 57 Scholars generally regard black Americans as a special case, even relative to other ethnoracial groups in the United States.Footnote 58 And as I describe above, upward mobility is traditionally associated with whitening in Brazil. But more recently, scholars have begun to uncover patterns and correlations that highlight parallels between these two cases, especially with regard to the dynamics of race and class in the experiences of upward mobility. Edward Telles and colleagues, for example, find that better-educated Brazilians are more likely to identify as black than as mixed-race,Footnote 59 even after controlling for physical attributes.Footnote 60 Studies of parents’ classifications of their children find that better-educated nonwhite Brazilians were more likely to classify their children as white in the 1980s and 1990s, but that this pattern had reversed itself by the 2000s.Footnote 61 And a panel study of students at one university in Brazil finds that students are more likely to adopt black identities after enrolling in university, particularly those admitted via affirmative action.Footnote 62
Evidence of a potential “darkening” effect associated with upward mobility is accumulating, but few studies explicitly examine longitudinal dynamics in patterns of racial identification in Brazil,Footnote 63 and others only speculate about why education might correlate with black identification. My purpose is to specify the mechanisms that link education to increased black identification over time. I develop this argument based on insights from fifteen months of qualitative field research, including participant observation and in-depth interviews conducted with Brazilians of various educational attainment and sampled from university networks and community organizations in São Paulo and Recife, two major cities in distinct and the most populous geographic regions of Brazil.Footnote 64 The interviewees I reference in this section were snowballsampled and I conducted the interviews with the goal of theory-building; thus, my interview data aren’t intended as tests of the theoretical propositions (systematic analysis follows in section IV). Instead, I draw on these data to demonstrate the plausibility of the hypothesis and to help illustrate how education can lead to politicized racial identities and reclassification into darker racial categories through new and increased exposure to information, social networks, and the labor market.
Information
First, and rather directly, education can increase the exposure of individuals to new facts, discourses, and understandings of race that can reshape racial identities and lead those individuals to make sense of their personal experiences and relative social positions in racial terms. One need not embrace the characterization of the status quo as a kind of false consciousness to accept the fact that education can introduce individuals to new ideas.Footnote 65 Studies of public opinion have not borne out claims that beliefs in Brazil’s national myth, or in the absence of racial discrimination, are particularly widespread among the mass public.Footnote 66 But it’s still far from a foregone conclusion that Brazilians necessarily make sense of their own experiences with discrimination in racial terms. As one interviewee put it, “You can see [racism] in the statistics. Does it exist? Of course it exists.” But, the interviewee added, “Would I say I’ve suffered from racism? No. There is racism, but I haven’t suffered [from it].”Footnote 67
Exposure to new information can entail more than simply being made aware of racial inequalities in general as impersonal statistics. New information can make the difference between being aware of discrimination in society and making sense of one’s own experiences or relative social position in racial terms (structurally, historically, or in some other way). As a result, greater information can imbue racial categories with political meaning, strengthen one’s ties to one’s racial group, and potentially alter the basis or calculation on which one makes determinations about one’s racial group membership.
Reports from interviewees indicate as much. Lesser-educated interviewees reported relatively little knowledge of major historical institutions like slavery. In one extreme example, an interviewee with little formal education told me: “I didn’t know about that slavery thing. I used to see it in soap operas. … But I didn’t know they had it for real, that there was this thing of blacks suffering so much.”Footnote 68 Better-educated interviewees often reported superficial school coverage of race-related issues when they were growing up, but said that greater exposure to the subject later on affected their racial identities and consciousness. One interviewee in São Paulo, who reported that he began to develop a politicized black identity after high school, attributes this to history courses he took while preparing for the university entrance exam. In high school, he said,
I learned a few things [about slavery], but not much. Like, I knew that there was slavery, I knew more or less the time period, but it was very superficial, the lessons about this. I didn’t know what slavery was like and a lot of times I never learned, for example, that there were [slave] revolts. … I didn’t know, for example, what happened after abolition. After abolition came the Republic, and we heard nothing more about blacks in the Republic.Footnote 69
Learning a more detailed history of slavery meant more than acquiring additional facts. It meant developing a point of view from which he could understand present-day inequalities as a legacy of historical institutions, rather than apolitical statistics. “I didn’t know how much this legacy exists today,” he said. “You learn what happened, but a lot of times it’s that ‘the past is just the past’ and has no legacy today. … But there is a great legacy from this now.” Exposure to information led this interviewee to historically situate present-day inequalities and see himself as part of a durable social structure. In turn, he reported, this information fostered stronger and politically meaningful ties to his racial group.
New information can also come in the form of a new racial discourse or understanding of blackness that can lead to reclassification and the adoption of a politicized black identity. Such was the case for Jorge, mentioned at the start of this article, who explained that his reclassification took place after he enrolled in a black feminism course at university. He reported that he experienced racism while growing up, “but I didn’t know to say it was racism, because I was a light-skinned black, and I didn’t know that I could be black, self-identify as black.”Footnote 70 Exposure to an understanding of blackness rooted in shared experiences of racism, rather than the more traditional Brazilian colorism that emphasizes fine, color-based distinctions between individuals, led Jorge to embrace an understanding of blackness that was more resonant and inclusive. In short, whether the information one encounters relates to history, social structure, or racial discourse, exposure to information is one path through which education can impact racial identification and consciousness.
Social Networks
Not all individuals pursue a course of study that introduces them directly to this kind of information. But the pursuit of education can lead individuals to new social contacts and networks, which in turn can introduce them to new social spaces and alternative ways of seeing and understanding race.Footnote 71 In one respect, university campuses are typically elite spaces with high concentrations of wealth and whiteness. As sites that students routinely frequent, therefore, campuses can expose them—particularly students who arrive from marginal communities—to specific forms of inequality.Footnote 72 In another respect, schools and campuses can serve as organizational centers for civic associations. New contacts and networks may introduce individuals to other civic organizations and expose them to interpretive frames that challenge racial commonsense, what Doug McAdam describes as “cognitive liberation.”Footnote 73
Social movement scholars have documented such network effects. In a study of the anti-abortion movement in the United States, Ziad Munson finds that many participants don’t come to the movement with preformed ideological commitments. Rather, they adopt the ideology after joining through preexisting social contacts.Footnote 74 Ann Mische’s study of activist networks in Brazil offers a similar account. In one strikingly relevant case, Mische describes an activist who developed a politicized racial identity by engaging in nonracial activism through which he encountered racial discourse and debate that resonated with him.Footnote 75 Civic and social movement spaces of all kinds, therefore, can be important locales where individuals first discover new racial discourses that shift racial boundaries and lead them to adopt new racial identities. Pursuing education can be the first step in altering the social contacts and networks that increase exposure.
Take Tiago, for example, quoted in the introduction. He attributes his politicized black identity and reclassification to a social movement event he attended inadvertently while socializing with university friends. He was shocked to discover that he identified with the recounted stories of racism because at the time he didn’t consider himself black. But the event prompted him to reinterpret his experiences as racialized, and he thus came to “see race”Footnote 76 and to view himself in new ways.
An interviewee in São Paulo who reclassified from brown to black similarly attributes her adoption of a politicized black identity to the movement spaces she first encountered via preparatory courses for the university entrance exam. She initially pursued free courses offered by a local ngo, which also hosted extracurricular events and roundtables oriented toward racial issues. She started attending these events frequently and reported that they “made me wake up,” and led her to conclude that she in fact had suffered racism. Ultimately, she came to embrace an understanding of blackness rooted in “not being ashamed of how I am.” Thus, a process that began with the pursuit of education culminated in “an affirmation of my blackness.”Footnote 77 More than technical training or exposure to basic facts, the pursuit of education can alter individuals’ social contacts and networks, which in turn can introduce them to new interpretive frames that alter their racial self-understandings.
The Labor Market
Last, education can also alter one’s experiences in the labor market and therefore affect racial and political identity. As a promised path to upward mobility, greater education often leads individuals to compete for higher-status jobs, potentially exposing them to exclusivity, inequality, or discrimination in elite workplaces and public spaces. Indeed, sociological studies document the greatest wage penalties against darkerskinned individuals in high-status jobsFootnote 78—penalties they’re likely to suffer even if they attempt to distance themselves from blackness.Footnote 79 Moreover, as one ascends socially with greater education, it becomes increasingly difficult to attribute any perceived discrimination or one’s relative social position to class or status.Footnote 80 For many with racial options, higher education may not bring economic success, therefore generating grievances and raising questions that beg explanation. Alternatively, those who succeed may find themselves thrust into elite spaces overpopulated by the lighter-skinned. In their study of well-educated black professionals in Rio de Janeiro, Graziella Moraes da Silva and Elisa Reis find that professionals are most likely to identify experiences of racial discrimination in the workplace and elite public spaces where they report mistreatment or lack of recognition of their social status.Footnote 81 Labor market experiences are certainly heterogeneous, but the broad point is that by shaping trajectories of upward mobility and labor market insertion, education can significantly alter one’s expectations and personal experiences with racialized inequalities and discrimination. In turn, these experiences can lead individuals to rethink the significance of race and their own racial self-understandings.
Several interviewees spoke of such experiences as critical to their adoption of politicized black identities. One interviewee in Recife, who now considers himself a militant of the black movement, said, “It was above all my experience as a teacher” that led him to adopt a politicized black identity. In his words, teaching “provoked me toward this because the students, on the first day of class, they didn’t think I was a teacher … because I was black … . It’s linked to teaching, [what] made me realize how black I was.” Incidents like this, which he also experienced with school employees, conveyed to him that his status and authority as a professional teacher were neither recognized nor respected. These experiences initiated the processes of identity politicization, which he said took years to unfold before he reached an “understanding [of ] blackness as a political position.”Footnote 82
Through the labor market, greater education can also bring new exposure to elite public spaces made accessible by higher income. One interviewee in São Paulo, who attributes her politicized black identity to the labor market, reported that she lived and worked in a peripheral community before landing a high-status job with a public sector bank—a job she couldn’t have qualified for without university education. She said that the job increased her firsthand exposure to the overrepresentation of the lighter-skinned in elite workplaces, as well as in elite public spaces she could suddenly access with her new disposable income:
You start to live another way of life. … I think I escaped [the economic cycle] from the moment that I started to earn more [money], frequent other places. And then you start to notice, like, we go to some places, there are no black people. You go to another, no black people. You go to a restaurant, no black people. You get on a plane to go to Europe, almost no black people.Footnote 83
By shaping one’s trajectory in the labor market, education can make race salient and can contribute to the reshaping and politicization of racial identities by altering one’s experiences not only in the workplace, but also in the kinds of public spaces that become part of a new way of life. Experiences of upward mobility in the labor market can give individuals firsthand exposure to inequality and discrimination in a variety of locales, in turn leading them to interpret their own social positions in racial terms and to rethink their racial self-understandings.
Summary and Observable Implications
In sum, the specific paths by which education affects reclassification and the formation of racialized political identities are heterogeneous and often personal. Moreover, these effects unfold over varying periods of time: some individuals report that education affected their identification while they were still acquiring education; others say the process unfolded years after they completed the highest level of education they would attain. The important point is that interviewees consistently described how the pursuit of greater education directly or indirectly altered their racial self-understandings and led them to adopt nonwhite and often black identities. Though the qualitative data I present to illustrate these mechanisms are hypothesis-generating in nature, systematic survey-based studies lend support to my interviewees’ accounts, finding that greater education correlates with the belief that racial discrimination existsFootnote 84 and that race is influential in shaping one’s life.Footnote 85
What sets this hypothesis apart from the expectations of prior scholarship is precisely the direction of education’s effects. Although conventional wisdom expects education (and other forms of upward mobility) to produce whitening, I expect education to produce darkening, especially for those in the lower classes. The key observable implication that I test in the empirical analyses is that better-educated Brazilians will be the most likely to reclassify in darker racial categories over time. Although I don’t strictly hypothesize that these effects are limited to individuals who meet certain phenotypical criteria, I do expect that lower-class Brazilians are likely candidates for reclassification, partly because they’re more likely to meet commonsense phenotypical criteria and are best positioned to make plausible claims to nonwhiteness.Footnote 86 In the analyses in section IV, which proceed in two steps, I employ multiple strategies to assess and to control for the effects of physical attributes on reclassification and the hypothesized processes. In a longitudinal analysis of demographic surveys, I use income to measure class and proxy for skin tone while testing observable implications. In an analysis of a national survey, I use a direct skin-tone proxy to isolate the effects of education and assess how and if this attribute conditions the effects of education on patterns of reclassification.
Affirmative Action and the Instrumental Hypothesis
Skeptics will be quick to point out that Brazil began experimenting with race-targeted affirmative action in the early 2000s, an institutional change that likely generated incentives for blackness. In 2001, President Fernando Henrique Cardoso broke with the state’s decades-long posture of colorblindness when he explicitly endorsed affirmative action for Afro-descendants.Footnote 87 Federal affirmative action legislation wasn’t passed until 2012, although states began implementing racial quotas in universities as early as 2001.Footnote 88 These policies targeted the absence of nonwhites and the lower classes in public universities, which were the near-exclusive domain of light-skinned elites.Footnote 89 University quotas remain the dominant form of affirmative action policy in Brazil, though in reality most of these policies are means-tested, targeting race only in conjunction with socioeconomic criteria.Footnote 90
Still, affirmative action policies comport with dominant theories that attribute identity change and salience to material incentives generated by demographic structures or institutions.Footnote 91 Indeed, “institutions that structure incentives” is one prototype of identity change outlined by Kanchan Chandra.Footnote 92 In this view, identity salience is the product of means-ends calculations in contexts of resource scarcity.Footnote 93 Affirmative action features explicitly in this literature. Joane Nagel, for example, argues that affirmative action incentivized Native American identification in the United States,Footnote 94 and Chandra argues that in India these policies created incentives for ethnic groups to mobilize and demand inclusion as policy targets.Footnote 95
Although instrumental explanations are attractive for their parsimony, they struggle to explain the enduring identity change evident in Brazil’s census. First, affirmative action benefits aren’t awarded based on responses in the census, which by law are anonymous. Second, the adoption of affirmative action hasn’t eliminated the status quo incentives for whiteness, which are perpetuated through informal institutional racism. Fluid boundaries allow savvy opportunists to manipulate their declared race when and where necessary while otherwise reaping the rewards of whiteness. And third, the misuse of affirmative action carries real risks. Implementing these policies in a context of racial ambiguity has undoubtedly raised thorny issues of where to draw “the color line.”Footnote 96 Some universities have created councils to determine the eligibility of applicants tentatively admitted via racial quotas.Footnote 97 Yet even absent such councils, students deemed guilty of fraud can face expulsion.Footnote 98
There’s empirical support for these misgivings. In panel studies of Brazilian university students before and after the implementation of quotas, Andrew Francis-Tan and Maria Tannuri-Pianto find evidence that applicants manipulate their identifications for admission, but that students are likely to revert to lighter identifications after matriculation.Footnote 99 These studies also reveal that darker-skinned students in particular are more likely to adopt nonwhite identities after matriculation, and that they’re likely to adopt colloquial labels promoted by the black movement within five years of completing university, suggesting motives beyond crude instrumentality.Footnote 100
Despite these misgivings, the instrumental hypothesis merits assessment. Of course, the two hypotheses aren’t mutually exclusive; individuals may exhibit similar behaviors for different reasons. But my objective is to test this hypothesis as a plausible explanation for the reclassification evident in the census, rather than to probe for evidence of instrumental behavior writ large.
IV. Testing the Political Identity Hypothesis
Longitudinal Analysis
The key observable implication of the political identity hypothesis is that better-educated Brazilians, especially those in lower classes (that is, the darker-skinned), will be most likely to reclassify in darker racial categories over time. It would be ideal to have microlevel panel data allowing for repeated observations of individuals’ identifications over time, but in the absence of such data, I test this hypothesis using a “pseudo panel,” which has become common in social analysis following Angus Deaton’s pioneering application.Footnote 101 In many cases, researchers interested in testing hypotheses that require panel data only have access to successive surveys with random samples that are annually drawn anew. Such surveys allow researchers to construct synthetic panels and generate estimates of aggregated individual-level behavior by tracking cohorts or groups with fixed membership over time. I track birth cohorts in annual household surveys to estimate the aggregated likelihood that individuals in birth cohorts will identify as nonwhite in successive surveys. Pseudo-panel analysis replaces individual-level probabilities with cohort means as indirect estimates of aggregated microlevel behavior.Footnote 102 I analyze the Pesquisa Nacional par Amostra de Domicílios (pnad), a demographic survey conducted by the Brazilian census bureau (similar to the American Community Survey). To ensure consistency in the racial classification scheme employed and to cover the relevant time period, my analysis covers surveys conducted in 1993, 1998, 2003, 2008, 2013, and 2015, the final survey-year.Footnote 103
This strategy offers several advantages. First, pnad provides samples that are large enough to compute reliable estimates for birth cohorts.Footnote 104 Second, because the first survey-year analyzed is 1992, long before affirmative action policies became a topic of national debate, my analysis can be restricted to individuals who completed university before nonwhite identification offered benefits. If instrumental motivations alone accounted for the observed patterns of reclassification, then older cohorts—unlikely to seek to benefit from racial quotas in university admissions—should demonstrate stability in their racial identification. This approach offers leverage on the central hypothesis by allowing me to isolate the effects of education for specific cohorts without potential inferential contamination from affirmative action policies.
Pseudo-panel analysis makes two key assumptions. First, cohorts identified across surveys must be based on stable membership over time.
Birth year, the criterion employed here, is a typical choice.Footnote 105 Second, cohorts must be based on stable underlying populations.Footnote 106 This second stipulation is relevant with respect to age (used to identify cohorts) and education (the explanatory factor of interest), limiting the cohorts suitable for pseudo-panel analysis. Because mortality rates spike among Brazilians above 55 years of age, the underlying population of cohorts that reach this age during the period in question is unstable.Footnote 107 And because younger individuals are more likely to gain additional education over time, educational attainment is unlikely to remain stable in younger cohorts, and apparent shifts might be due to changing levels of education. The analyses below focus on cohorts selected to be old enough to have completed university education in 1992, but whose mortality rates by the final survey year had not yet spiked: individuals born between 1960 and 1964 (cohort 3) and those born between 1965 and 1969 (cohort 4).Footnote 108 Because we’re interested in self-identification, the sample is also restricted to heads of household. The pooled sample for these cohorts contains 137,410 observations.
The dependent variable is measured using the official, closedended census question, which asks respondents to self-classify as white (branco), brown (pardo), or black (preto). Due to the small number of observations, I exclude Asian and indigenous responses. I analyze racial identification coded dichotomously (white or nonwhite) and trichotomously (white, brown, or black). The dichotomous coding collapses black and brown categories and reflects the goal of understanding the growing adoption of nonwhite identities. The trichotomous coding provides a fuller picture of whether declines in white identification are met by growth in black and/or brown identification.
The independent variable of interest in this analysis is education, measured as the respondent’s level of formal education completed, categorized as follows: (1) less than primary, (2) primary, (3) high school, and (4) university or more. The models include controls for income, measured as the respondent’s decile of household income per capita, and dummies for gender and migration status at the municipal and state levels. Fixed effects for state of residence control for unobserved state-level heterogeneity. Following the pseudo-panel literature, I instrument for individual-level fixed effects with a survey-year and lagged cohort mean interaction term.Footnote 109 I also include lagged cohort means to control for autocorrelation in the dependent variable. Summary statistics for independent variables can be found in Table C4 in the supplementary material.Footnote 110
I estimate the longitudinal probability of identifying as nonwhite as a time-interactive, autoregressive, fixed-effects logit model of the form
 $\[\log ({Y_{i,c,t}}) = {\alpha _0} + year \cdot {\tau _t} \cdot ({\bar y_{c,t 1}} \cdot {\rm{\lambda }} + edu{c_{i,t}} \cdot {\rm{\gamma }} + \sum\nolimits_k {X_{i,t}^k \cdot {\beta _k} + {\delta _{i,t}} \cdot \zeta ),} \]$
where Y is the binary variable indicating nonwhite identification for individual i in cohort c in year t. Year is a survey-year fixed effect, ȳ is the cohort-mean lag of Y, educ is the categorical education variable, X is a matrix of control variables, and ? represents state fixed effects. Because I hypothesize change over time in the relationship between covariates and the probability of nonwhite identification, I interact the survey-year variable with the full model. I estimate the dichotomous dependent variable with logistic regression and the trichotomous variable with multinomial logistic regression. Because I hypothesize educational effects for particular class sectors, I estimate models on the full sample as well as on subsamples based on income. Full model estimates are presented in tables C6 and C9 in the supplementary material.Footnote 111 I focus on interpreting the substantive findings of over-time change in the predicted probability of racial identification by level of education.
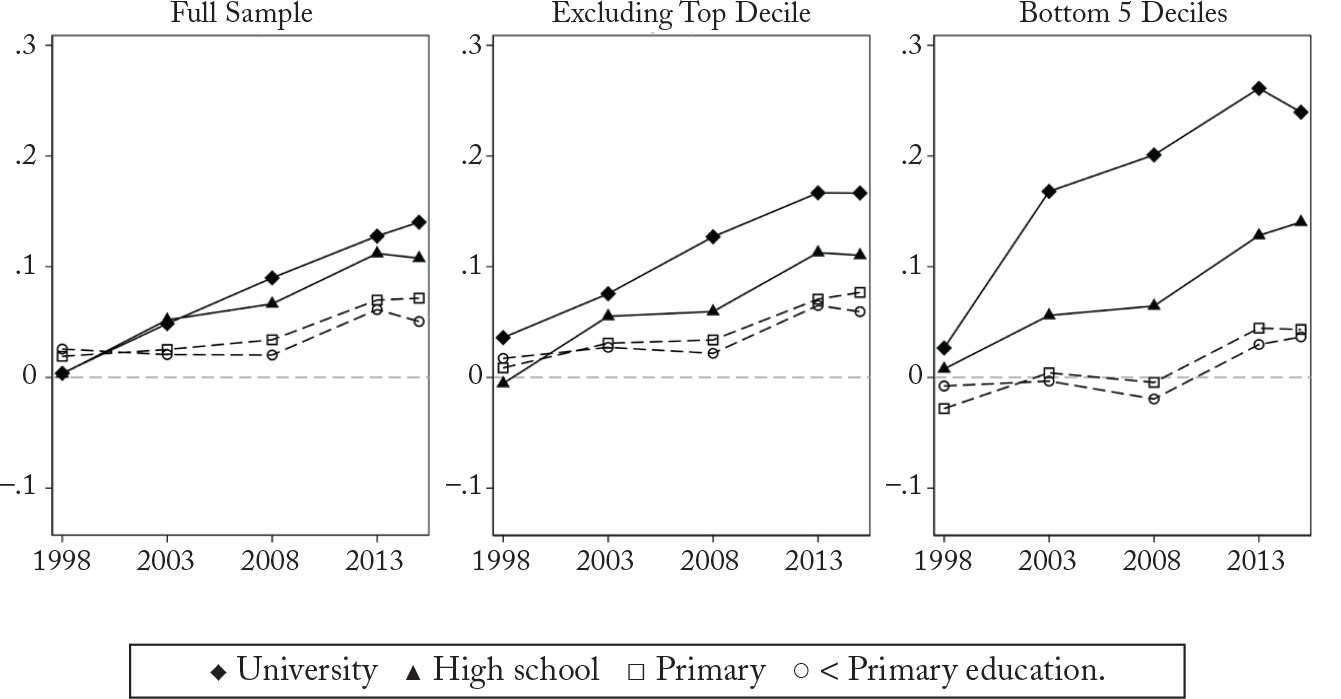
The left-hand panel of Figure 4 displays the substantive findings from the model estimated from the full sample, showing over-time changes in the probability of identifying as black or brown relative to the baseline probability in 1993. As these are pseudo-panel estimates, they can be interpreted as changes in the aggregate probability that individuals in these cohorts will identify as nonwhite over time, given their level of education. This model estimates a monotonic relationship between greater educational attainment and growth in the likelihood of nonwhite identification over time. For universityand high school– educated people in particular, there is consistent growth. Between 1993 and 2015, this probability grew by fourteen points (0.29 to 0.43, p <.05) for the university educated and eleven points (0.41 to 0.52, p <.05) for the high school educated (tables C7 and C8 in the supplementary material).Footnote 112
Logit Model Estimates of Change in Pr(Nonwhite ID) by Education Relative to 1993, 1998–2015

Findings from the full analysis support the hypothesis that the adoption of nonwhite identities is associated with greater education. The hypothesis further expects the greatest tendency for reclassification among the lowest class strata. I estimate the model on income-based subsamples, intended to serve as proxies for skin tone.Footnote 113 The middle panel of Figure 4 excludes from the analysis those in the top income decile and indicates a longitudinal pattern similar to that of the full sample, suggesting that these findings aren’t driven by high-income (and, by proxy, lighter-skinned) individuals. As with the full sample, there is a monotonic relationship between greater levels of education and the over-time change in the probability of nonwhite identification.Footnote 114
In the right panel, probabilities estimated on respondents in the bottom five income deciles (the most likely candidates for reclassification) indicate that the hypothesized relationship between greater education and over-time change in the probability of nonwhite identification is pronounced. Among the better-educated, there are consistent and substantial gains in the likelihood of nonwhite identification. For the university educated, this probability increased by twenty-four points between 1993 and 2015, from 0.36 to 0.6 (p < .05); among the high school–educated it increased fourteen points, from 0.51 to 0.65 (p < .05). By contrast, among those with primary education and less, change in this probability is statistically insignificant—estimated at four and three points, respectively.
Findings from these analyses are based on two birth cohorts specifically chosen to meet the assumption of pseudo-panel estimation and to avoid contamination from the presence of affirmative action policies. As a robustness check, I also estimate these models on an expanded data set that includes four additional cohorts (two older and two younger). Full estimates and results from these analyses are presented in tables C16 to C25 in the supplementary material.Footnote 115 These expanded analyses replicate the findings presented here, showing that better-educated Brazilians are most likely to adopt nonwhite identities over time, in particular those in the bottom half of the income structure.
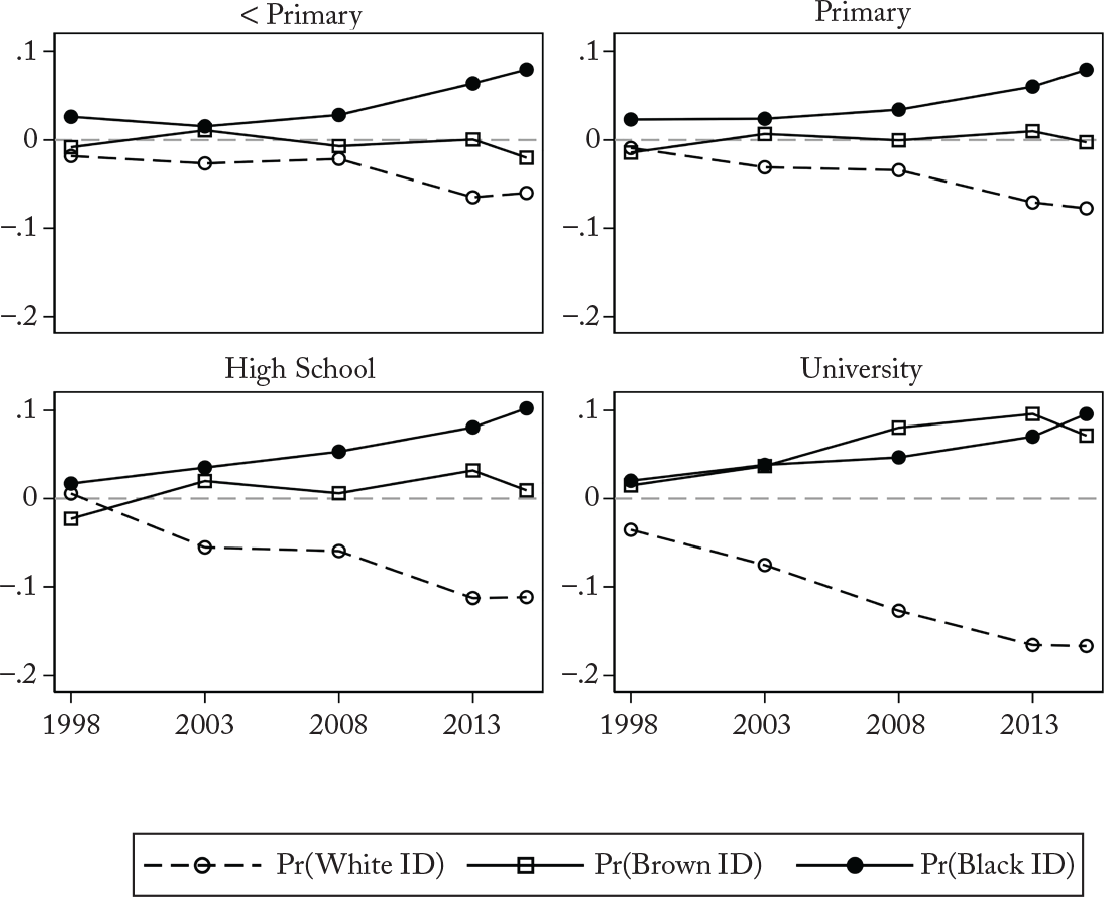
Although the findings from the analysis of the dichotomous variable make clear that higher education is associated with greater brown or black identification over time, analysis of the trichotomous variable sheds additional light on the longitudinal dynamics of brown and black identification. Estimates from a multinomial logit model, computed on the sample excluding the top income decile and analogous to those presented in the dichotomous case, are presented in Table C26.Footnote 116 Figure 5 presents the substantive findings, displaying over-time change in the predicted probability of identifying in each racial category, relative to the baseline year of 1993. As with the previous analysis, this one reveals that over time, the sharpest declines in the probability of white identification are found among those with university education (–17 percent, p < .05) and high school education (–12 percent, p < .05), as predicted. Among the university educated, these declines in white identification are met with gains in both brown and black categories. Between 1993 and 2015, growth in the black category (10 percent, p < .05) is estimated to be slightly higher than in the brown category (7 percent, p <.05), though over-time differences across categories aren’t statistically significant. But this isn’t the case more generally. Across other education levels, any observed declines in white identification are met most consistently with growth in the stigmatized black category, rather than in the brown category.Footnote 117
Multinomial Logit Model Estimates of Change in Pr(Racial ID) by Education, Relative to 1993, 1998–2015

Of course, these pseudo-panel data are intended for demographic purposes, and the relationship between greater education and reclassification is at best suggestive of growing racial consciousness among the population—a phenomenon distinct from racial identification.Footnote 118 But the fact that over-time growth is most consistent in the black category is striking in part because this category is stigmatized and because scholars argue that black identification in particular is associated with racial consciousness.Footnote 119 This is in contrast to the more heterogeneous brown category.Footnote 120 Thus, although pseudo-panel analyses find support for the observable implications of the political identity hypothesis, I also conduct a supplemental analysis of national survey data to directly test the relationship between education, racial consciousness, and patterns of racial identification.
National Survey Analysis
For this analysis I draw on a nationally representative survey on race and racism in Brazil conducted in 2008 by the survey firm Datafolha.Footnote 121 Because this survey took place prior to the passage of the 2012 federal affirmative action law, it’s well suited to further evaluate these propositions: it includes multiple questions pertaining to racial identification and subjective racial attitudes and experiences, allowing for more direct measurement of the dimensions of racialized political identity as articulated by the interviewees.
To measure racial identification, respondents are first asked to selfidentify in an open-ended format, and then to self-classify in one of the official census categories.Footnote 122 As with the pseudo-panel analysis, self-identifications are coded both dichotomously and trichotomously.Footnote 123 Prior to collecting self-identifications, survey interviewers were instructed to classify the survey respondents in one of the census categories, which I employ as a proxy for respondent skin tone.Footnote 124 The sample thus includes respondents self-classifying in white, brown, and black categories. The white response option is retained to ensure replication of the choice set presented by the census and to reflect the reclassification dynamic from whiteness toward blackness.
To measure racialized political identity, I construct an index of racial consciousness with eight survey items that align with the dimensions articulated by interviewees when describing their politicized racial identity and the rationale for their racial identification. The index includes a battery of questions probing respondents’ subjective perceptions of experiencing race-based discrimination, their awareness of the potential for internalizing or complying with racial hierarchies, their belief in the stigmatization and negative portrayal of Afro-descendants, and, as a proxy for exposure to alternative racial discourses, their participation in the black movement. Survey language that doesn’t reference specific racial categories or groups would be ideal to measure the racial consciousness of those identifying with any racial category. But the language used suffices, given the focus on reclassification into nonwhite categories. Each dimension is coded dichotomously and combined additively into a summary racial consciousness measure that ranges from zero (low racial consciousness and disagreement with all items) to four (high racial consciousness and agreement with all items).Footnote 125 Selfidentified black respondents exhibit the highest mean levels of racial consciousness (1.55), followed by self-identified brown (1.12) and white (1.03) respondents.
Education is measured categorically according to whether individuals (1) have not completed primary school, (2) completed primary school, (3) completed high school, or (4) have some university education or greater. Estimates also adjust for baseline demographic and socioeconomic characteristics, including household wealth, age, gender, and geographic region of residence. To control for political attitudes or ideologies that might correlate with education or racial consciousness, I include fixed effects for partisan identification. Information on all variable coding is available in Appendix C in the supplementary material. Below, I present substantive findings from multivariate analyses. Full model estimates for these are available in tables C31–C33.Footnote 126
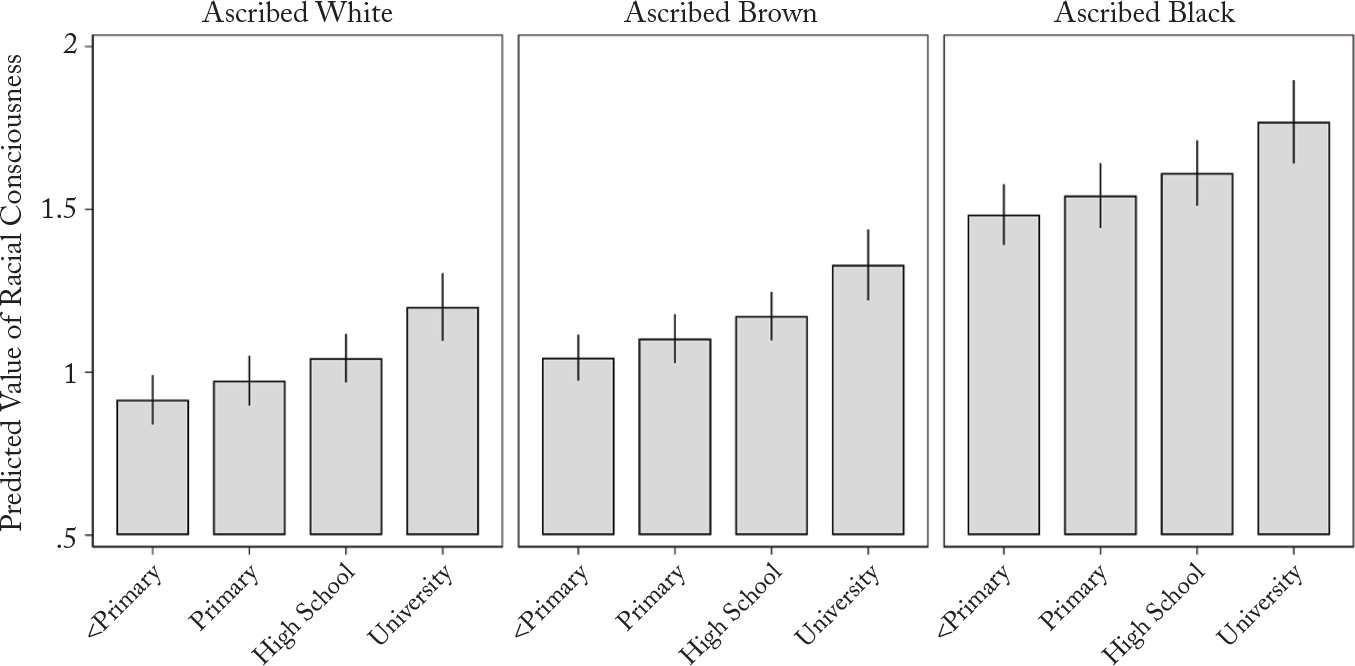
Figure 6 displays covariate-adjusted estimates of racial consciousness according to level of education and racial ascription. Estimates from this analysis reveal a positive and robust relationship between education and exhibited levels of racial consciousness. On average, moving from the lowest education level to high school is estimated to increase the racial consciousness measure from 1.02 to 1.22 (p < .05), and to 1.41 for the university educated (p < .05). The analysis also reveals considerable differences across racial ascriptions, the skin-tone proxy. The darkestskinned and highest-educated respondents exhibit the greatest levels of racial group consciousness, while the lightest-skinned and leasteducated exhibit the lowest levels. Categorically, the darkest-skinned respondents exhibit levels of racial consciousness higher than either ascribed white or brown respondents. And although ascribed brown respondents exhibit slightly higher levels of racial consciousness than do white respondents, substantive differences are greater between education levels within white and brown racial ascriptions rather than simply between racial ascriptions. Nevertheless, across racial ascriptions there is a positive relationship between education and racial consciousness, as predicted. My analysis supports the argument that education increases racial consciousness, as suggested by interviewees.
Regression-Adjusted Estimates of Racial Consciousness by Ascribed Race and Educationa
a Bars indicate predicted values of racial consciousness. Figure displays 95 percent confidence intervals.

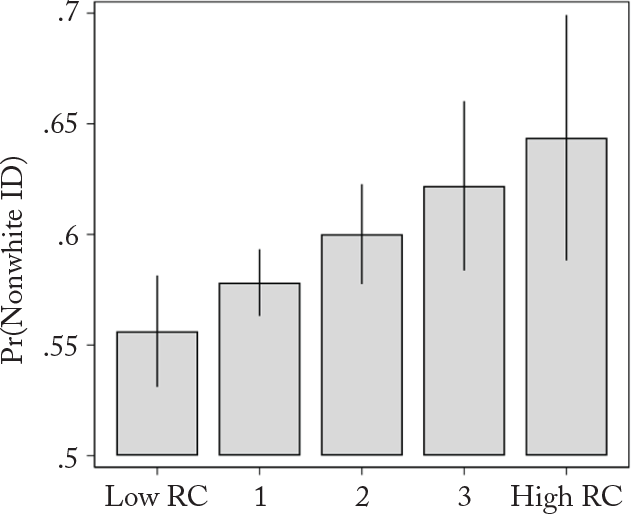
Figure 7 presents predicted probabilities from logit models estimating the association between racial consciousness and the likelihood of identifying as nonwhite. Estimates are adjusted for socioeconomic and demographic factors, as well as for respondent skin tone, to isolate the effects of racial consciousness from the potentially confounding influence of physical attributes that form the basis of racial commonsense.Footnote 127 Models estimate a significant and robust relationship between racial consciousness and nonwhite identification, even when controlling for respondent skin tone. The model estimates that a one-unit increase in racial consciousness increases the probability of nonwhite identification by two percentage points on average (p < .05), and estimates that moving from the lowest to highest level of racial consciousness increases this probability by nine percentage points (p < .05), from .55 to .64. Analysis of the dichotomous racial identification variable confirms that racial consciousness is indeed associated with nonwhite identification, above and beyond skin tone and socioeconomic factors.
Predicted Probabilities of Nonwhite ID by Level of Racial Consciousnessa
a Estimates are regression adjusted and computed from model 3 of Table C32 in the supplementary material (De Micheli 2020b). Figure displays 95 percent confidence intervals.

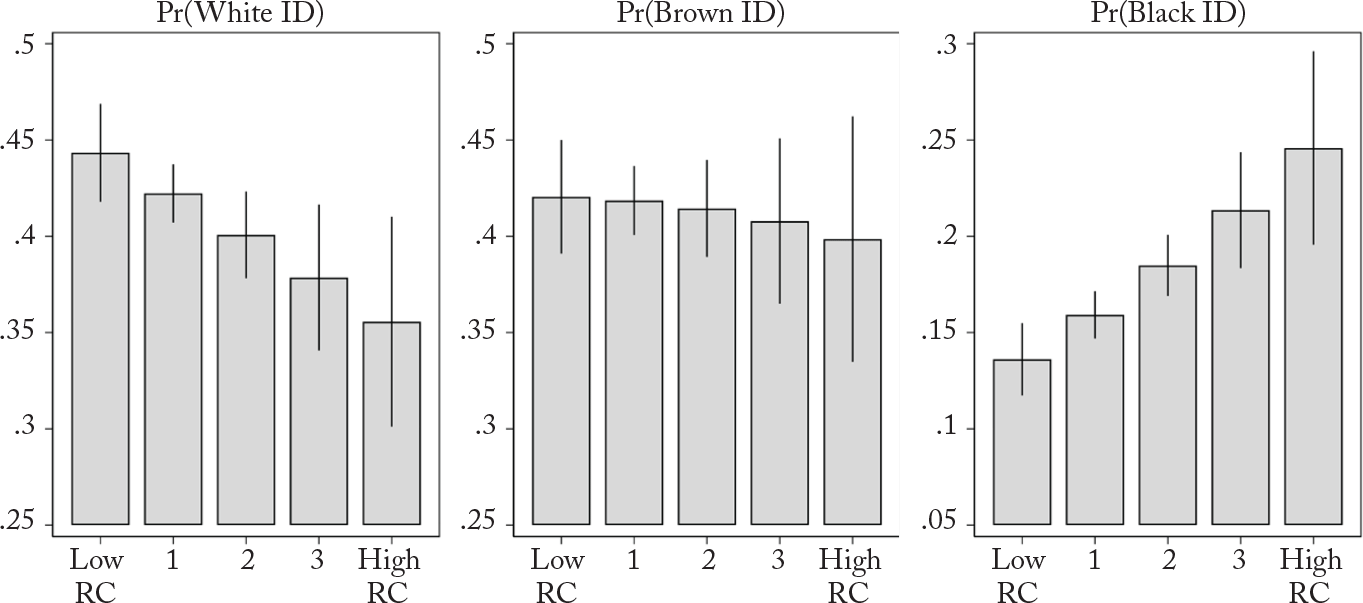
Again, examination of the trichotomous identification variable sheds additional light on the dynamics between racial consciousness and identification, particularly whether racial consciousness is associated with black or brown identification.Footnote 128 Figure 8 displays predicted probabilities from an analogous multinomial logit model, showing the probability of identifying in each racial category by level of racial consciousness, controlling for skin tone and socioeconomic factors. On average, the model estimates that a one-unit increase in racial consciousness decreases the probability of white identification, and increases the probability of black identification, by two percentage points (p < .05), but has no statistically significant effect on brown identification. Moving from the lowest to highest level of racial consciousness, the probability of white identification is estimated to decrease by roughly nine percentage points (p < .05), from 44 to 36 percent. The same change in racial consciousness is estimated to increase black identification by roughly eleven percentage points (p < .05), from 14 to 25 percent. The model estimates no corresponding increase in the probability of brown identification. As in the pseudo-panel analysis, the results indicate that the decline in white identification is met with significant growth in the black category, which is most closely associated with racial group consciousness.
Predicted Probabilities of White, Brown, and Black ID by Level of Racial Consciousnessa
a Model estimates available in Table C33 in the supplementary material (De Micheli 2020b). Figure displays 95 percent confidence intervals.

The above estimates aim to isolate the effects of consciousness on identification by controlling for factors like skin tone, which is known to influence identification strongly according to racial commonsense. These survey data offer one final opportunity to determine which individuals are most influenced by education and consciousness when it comes to identification. Although I don’t theorize a direct correspondence between skin tone and racial identification, I do hypothesize that lower-class sectors are more likely to be candidates for reclassification because they’re typically darker-skinned and can usually make more plausible claims to nonwhite identities. To assess this, I estimate the average partial effects of education and consciousness on each identification outcome according to the respondents’ racial ascriptions (the skintone proxy). Estimates are presented in Figure C1 in the supplemental material.Footnote 129
In short, respondents with medium skin tone are the closest fit to the hypothesized pattern: a one-unit increase in both education and racial consciousness is associated with a significant decrease in white identification and increase in black identification. Among the darkestskinned respondents, the largest effects of education and consciousness are on black identification, with the most substantive corresponding decrease coming from brown identification. The effects on lighterskinned respondents are more ambiguous. While education and racial consciousness are estimated to decrease white identification for these respondents, the effects on brown and black identification are substantively or statistically insignificant. One exception is the effect of education, which is estimated to significantly increase brown identification among the lighter-skinned.
Results from this supplemental analysis highlight two points with regard to skin tone. First, although it is a significant factor, skin tone doesn’t fully limit the effects of either racial consciousness or education to individuals of certain physical attributes. And second, education and racial consciousness shape the patterns of even darker-skinned respondents (those perhaps thought to be most constrained by phenotype), though this reclassification occurs from the brown to the black category.
Overall, my systematic analyses of microlevel census and supplemental survey data provide ample support for the political identity hypothesis. Pseudo-panel analysis demonstrates that over time, lower-income and highly educated Brazilians were the most likely to adopt nonwhite identities. Reclassification, moreover, is most consistently associated with the adoption of black, rather than brown, identities. Survey analysis allowed for more direct testing of the association between education and racial consciousness, and of racial consciousness and patterns of identification. Survey data allowed for more direct measurement of racial consciousness and found that education was indeed a robust predictor of the dimensions of racial consciousness that interviewees described when discussing their own paths toward reclassification. In turn, this racial consciousness was also robustly associated with declines in white identification and increases in black identification above and beyond the phenotypical characteristics and socioeconomic criteria typically associated with racial identification. Ultimately, then, these analyses substantiate the argument that shifting patterns of racial identification are a consequence of educational expansion in Brazil’s recent era of social inclusivity and color consciousness.
V. Testing the Instrumental Hypothesis
Evidence in favor of the political identity hypothesis doesn’t simply dispel questions about whether the reclassification apparent in the affirmative action era might also be driven by instrumental motivations. I assess this hypothesis with two survey experiments: first, a priming experiment designed to determine whether individuals manipulate their racial identifications in response to information about material incentives, and second, a list experiment to probe for evidence that individuals manipulated their past identifications. Experiments were conducted in person on stratified random samples in São Paulo and Recife. Each city is broadly representative of its geographic region, with oversamples of highly educated darker-skinned and less-educated lighter-skinned respondents.Footnote 130
The Priming Experiment
The first experiment tests the hypothesis by randomly priming respondents with information about the material benefits offered by racetargeted affirmative action policies and then asking them to selfclassify using the official census categories.Footnote 131 Treated respondents were informed or reminded that the government began to reserve slots for black and brown Brazilians in university admissions and in public sector jobs. Respondents were then asked to self-classify in the white, black, brown, Asian, or indigenous categories. The sample contains 236 control and 239 treated respondents. Tables D3 and D4 in the supplementary material report balance tests across treatment conditions and summary statistics of sample characteristics.Footnote 132
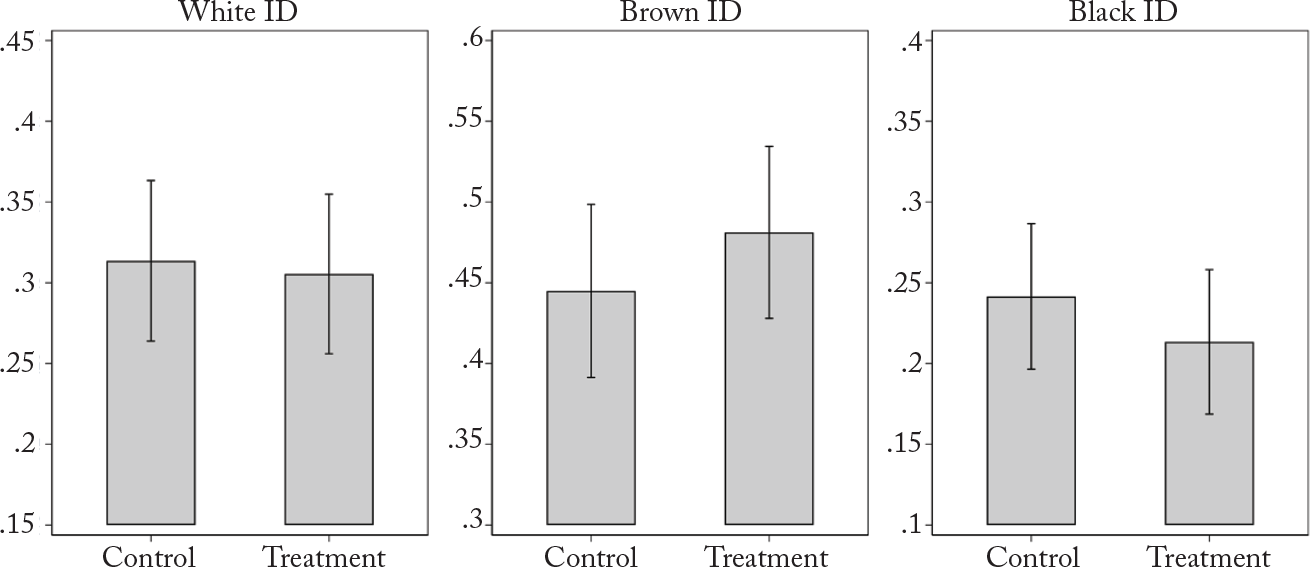
Figure 9 displays mean probabilities of identifying in white, brown, and black categories across treatment groups. The effects of priming respondents about race-targeted quotas are substantively small and statistically insignificant, decreasing the estimated probability of white and black identification by about one and three points, respectively. The estimated probability of brown identification increases by roughly 4 percent in the expected direction, but this change isn’t statistically significant. More precise covariate-adjusted estimates return similar findings (Table D5). Subgroup analyses don’t reveal significant heterogeneity according to respondents’ skin tones, as observed by survey enumerators (Table D6), nor to their level of education, as one might expect if those qualifying for university admission or public sector jobs might be most likely to manipulate their racial identifications for material benefits (Table D7). Only one instance shows evidence of a treatment effect: the covariate-adjusted effect among high school–educated respondents estimates an increase in the probability of brown identification, though this is met with a decline in black identification and no change in white identification (in other words, a whitening effect). Therefore, the priming experiment doesn’t lend support to the instrumental hypothesis.
Mean Racial ID across Treatment Groupsa
a Figure displays 90 percent confidence intervals.

The List Experiment
It may still be the case that savvy opportunists know well that answers to a questionnaire won’t lead to material benefits, so they have no real incentive to alter their racial identification in the context of a survey. Such individuals may have manipulated their identification in the past to take advantage of quotas, yet asking them outright about this behavior will likely lead to biased responses. I assess the prevalence of this behavior with a list experiment, employing a list of ethically questionable behaviors:
—1. I used a fake ID to get discounts or free items.
—2. I used the Internet to watch TV or movies without paying for them.
—3. I tipped a civil servant to get something I needed.
—4. I changed my declared color to qualify for a racial quota.
Untreated respondents received the first three items; treated respondents received all four items. The analysis covered 498 control respondents and 495 treated respondents. Balance tests show that randomization was successful, and analysis of control and treatment groups reveals no evidence of design effects on treated respondents’ answers to control items (tables D8 and D9).
I employ Graeme Blair and Kosuke Imai’s multivariate analysis, which leverages covariates to more efficiently estimate affirmative responses to the sensitive item and determine how this varies according to respondents’ characteristics.Footnote 133 I include covariates for age, gender, education, and skin tone. Following Blair and Imai, I estimate least squares and maximum likelihood models. Given concerns of fraud in affirmative action by light-skinned university applicants in particular, I leverage covariates and estimate probabilities according to education and respondent skin tone (see figures D1 and D2).
Full model estimates are presented in Table D12. Figure 10 presents the substantive findings from these models, as well as a differencein-means estimate. The difference-in-means test and linear models estimate that an insignificant proportion of respondents answered affirmatively to the sensitive item. Maximum likelihood models estimate that a small but statistically significant proportion of the sample responded affirmatively, roughly 8 and 4 percent in the constrained and unconstrained models, respectively. Multivariate analysis provides suggestive evidence of past manipulation, although these estimates are inconsistent and substantively small.
Estimated Proportion of Sample Responding Affirmatively to Sensitive Itema
a Figure displays 90 percent confidence intervals.

Estimates computed by education level (Figure D1) and skin tone (Figure D2) show similar findings. In both cases, estimates are inconsistent across model specifications, and insignificant in linear models. Constrained maximum likelihood models indicate some heterogeneity along values of these covariates, but these patterns are modeldependent and are not found in any other specification. Moreover, in the case of education the relationship suggests that high school– and university-educated respondents are least likely to have manipulated their racial identification. And even when proportions statistically distinguishable from zero are estimated, these proportions are substantively small.
Multivariate analysis of the list experiment reveals that evidence in support of the instrumental hypothesis is substantively insignificant at best and inconsistent at worst. The list experiment hints at evidence of manipulation, but it remains unclear that past manipulation of one’s identification leads to sustained or long-term nonwhite identification. These findings are perhaps best read in light of the panel studies mentioned above that identify short-term opportunism among university students.Footnote 134 Opportunists who wish to manipulate their identification to take advantage of quotas likely know when and where to do so, and are well aware that they have little to gain from their responses to any given questionnaire. This raises questions about the validity of survey experiments as tests of such behavior, but it still stands to reason that such individuals also understand that their anonymous responses to census-takers similarly offer no material benefits.
VI. Additional Explanations
Electoral Mobilization from Above
The foregoing analyses tested the instrumental hypothesis, but questions may linger about other alternative explanations. One such explanation is that political elites politicize or incentivize nonwhite identification through top-down electoral mobilization. In this view, rent-seeking politicians politicize social cleavages that are sizable enough to win elections and to maximize distributive payoffs for voters and elites.Footnote 135 But such explanations fall short in this context. Scholars have traditionally argued that there are few social bases in Brazil’s fragmented electoral system, let alone racial ones;136 instead, politicians are said to disarticulate social differences through clientelistic politics.Footnote 137 Moreover, the fluidity of ethnoracial identification in many Latin American contexts complicates elites’ strategic use of exclusively ethnic appeals to mobilize constituencies. Rather, politicians have found electoral success by employing broad and inclusive appeals, not exclusive and ethnoracial ones.Footnote 138 What’s more, few nonwhite politicians win office in Brazil,Footnote 139 and scholars argue that politicians who seek to mobilize voters on race tend to lose elections.Footnote 140 From the voters’ perspective, it remains unclear whether voters prefer candidates of their same race or colorFootnote 141 and insofar as race enters voters’ calculations, evidence from Latin America suggests that all voters simply prefer lighter-skinned candidates.Footnote 142 But above all, there simply has been no significant or recent pattern of explicit, top-down electoral mobilization of race in Brazil. Electoral mobilization from above finds no traction on this question.
Social Movements and Mobilization from Below
Social movements, which are said to foster collective identity formation and consciousness, also offer a potential explanation. Of course, exposure to social movements and networks forms part of my argument, and many racially conscious Brazilians seek out social movements as venues for articulating their political identities. But it remains unclear whether social movements, and the black movement in particular, operate as an independent cause of these patterns rather than as one path through which education leads to reclassification. Social movements have wielded considerable influence in Brazil’s redemocratization and 1988 constituent assembly,Footnote 143 and the black movement has had tremendous success in influencing policy at the highest levels of the state.Footnote 144 But while the movement has been successful in this regard, it has had less success with mobilizing the masses.Footnote 145 Scholars disagree on why, but one compelling explanation is that the black movement’s leadership and rank and file tend to be populated by middle-class professionals, who face resistance from the masses about being mobilized along racial lines. This is in part, scholars argue, because the movement’s prerequisite that participants adopt politicized black identities is too great a hurdle for Brazil’s darker-skinned masses, who prefer to distance themselves from blackness.Footnote 146 More recent scholarship argues that race-based activism and mobilization are on the rise in diverse interest arenas,Footnote 147 but it’s unclear that participation in the black movement has become widespread among the mass public. Thus, it’s important to distinguish between influencing state elites and mobilizing the masses. Social movements have recently made great strides, but the black movement in particular has long struggled to mobilize and connect with the mass constituencies it aims to represent. Social movements are more likely one possible (but not exclusive) path of exposure, rather than an independent cause of wide-scale reclassification.
State-Centered Race-Making
An additional explanation focuses on how states “make race” by naturalizing or making salient social boundaries and differences.Footnote 148 In one vein, scholars have focused on official censuses as sites where states institutionalize and actively shape boundaries and identities,Footnote 149 a line of argument that finds a seemingly clear parallel in the Brazilian case.Footnote 150 But as mentioned above, the Brazilian state’s classification scheme and enumeration practices haven’t changed in recent decades. Therefore, theories that suggest census enumeration as a mechanism of shifting or politicizing racial boundaries simply can’t account for the dramatic shifts evident during this period.Footnote 151
In another vein of state-centered arguments, scholars emphasize the symbolic dimension of state policies and institutions and their impact on racial subjectivities.Footnote 152 From this perspective, race-targeted affirmative action, cultural policies recognizing and celebrating racial differences, international cultural influences, and a changing discourse on racial inequality and discrimination are all sources of symbolic institutional change that can lend legitimacy to alternative racial discourses or make salient altered racial boundaries and identities.Footnote 153 Although these changes may well be part of the exposure to new information and discourses that I describe, national-level factors are analytically too blunt to account for individual-level variation in reclassification. Diffuse institutional changes wouldn’t predict the heterogeneous patterns of reclassification segmented along educational and class lines. If these factors alone were responsible for shaping racial subjectivities writ large, then we would expect more uniform patterns of reclassification across social sectors. Of course, the evidence I present doesn’t shed light directly on this symbolic question, but the pseudo-panel analysis sought to control for such changes by focusing on cohorts who gained access to education before Brazil’s color-conscious era. Even granting the symbolic significance of recent institutional changes, there’s still more to be said about alternative roles the state can play that help make sense of microlevel patterns of identity change and politicization.
VII. Conclusion
Recent patterns of racial reclassification mark a stunning shift in Brazil, the perennial paradox in the comparative study of ethnoracial politics. This article shows that the sudden reversal in patterns of racial identification can’t be dismissed as artifacts of census enumeration practices nor simply as the product of intergroup differences in demographic trends. Instrumental explanations also fall short in explaining the adoption of sustained nonwhite identities evident in the census. Instead, I find that individuals are increasingly adopting stigmatized identities as a result of state-led educational expansion for the lower classes, which increased individuals’ personal exposure to racial inequalities and discrimination, reshaped their racial self-understandings, and led them to develop and articulate racialized political identities.
These findings from the Brazilian case further underscore that structural conditions alone are insufficient explanations for how or why identities become politicized. Brazil has long been among the world’s most unequal and racially stratified societies, but its racial identities and cleavages remained politically latent. Although social hierarchies and inequalities might underpin or legitimate the politicization of specific identities, structure is no guarantee that individuals will even claim identities that coincide with the discrimination or disadvantage they inevitably face, let alone articulate their identities in ways that make them available for political mobilization. In this case, institutions of social citizenship—the accessibility of social rights and benefits allocated by the state—are critical to understanding the newfound tendency to adopt identities laden with social stigma. Educational access, in particular, encouraged individuals to adopt and politicize black identities as they became increasingly and personally exposed to racialized inequalities and discrimination.
This article presents an account of identity politicization that’s markedly distinct from dominant theories in political science, which have come to revolve around instrumental and strategic calculations based on demographic structures—calculations often made by political elites.Footnote 154 The empirical patterns I examine ought to give scholars pause before placing central theoretical weight on demography. While presumptions of stable social boundaries (and demographic structures) might be valid in some contexts, it’s clear in this case that the longitudinal dynamics of racial identification would fundamentally complicate strategic calculations based on easily observable or readily identifiable demographic groups. Not all cases resemble Brazil’s context of racial fluidity and ambiguity. And scholars might simply assume away the complications this case underscores in unreflectively imposing theoretical assumptions on the nature and meaning of social boundaries, categories, and identities. But whether such assumptions are deemed plausible in a given context should be based on empirical scrutiny rather than on lip service paid to the tenets of constructivism.
Of course, such considerations raise questions about the generalizability and implicit scope conditions of extant theorizing. But more critically, they also raise questions about the compatibility of theoretical assumptions made in so-called constructivist theories with fundamental and widely accepted tenets of constructivism: that social boundaries and identities are subjective, mutable, and reconstructed over time.Footnote 155
That reclassification in terms of race—commonly if too presumptively believed to be immutable, even among scholars—raises such questions reveals how analytical simplifications in service of theoretical parsimony can assume away the very empirical implications of constructivism itself. At the very least, the patterns of identity change and politicization examined here should renew attention to constructivist due diligence in the study and analysis of identity politics.
In another respect, my findings also depart from dominant accounts by suggesting an alternative role for the state and political elites in the processes of identity politicization. By restricting citizenship rights in the past and more recently extending them, elites were indeed central to the institutional reforms that proved critical in this case. Political elites behaved strategically in many ways, motivated by the incentives and imperatives of competing for the support of the newly enfranchised poor. But there’s little evidence to suggest that elites engaged in the deliberate, top-down electoral mobilization of identities or cleavages that influential theories have led us to expect. Instead, elites played a far more indirect and unintentional role by unleashing waves of upward mobility for lower-class citizens via social policy expansion. Thus, the reshaping and politicization of racial identities in Brazil are better understood not as a simple function of elite political strategy, but rather as a kind of policy feedback effect wherein extending social policies to broader segments of the citizenry generated a new and racialized politics of identity. Political elites certainly deserve credit for the institutional reforms they oversaw, but the politicization of newfound racial identities was ultimately shaped from the bottom up by citizens’ personal and subjective experiences.
As interest in identity politics continues to grow, scholars have called for greater attention to the ways in which identities come into formation in the first place.Footnote 156 This article contributes to this agenda by focusing on a phenomenon in a case that has puzzled scholars and observers for decades. But the general disregard paid to factors like social stigma and hierarchies in much comparative political science theorizing on the politicization of identities and inequalities—in analyses of this and other cases—is noteworthy. Scholars should consider these factors in future studies that aim to understand why certain identities do or do not become politicized, as well as what role, if any, the institutions and experiences of citizenship play in inhibiting or encouraging the politicization of stigmatized identities, social categories, and inequalities. Brazil’s social policy expansion and state-led efforts to better incorporate marginal citizens are far from unique and have lately received considerable attention from scholars of Latin American politics. But even more broadly, as democracies across the developing world aim to extend and to fulfill the promises of democratic citizenship, the interaction between social structures and citizenship institutions may well provide a fruitful point of departure as scholars seek to understand the politicization of identities and contestation of inequalities.
Supplementary Material
Supplementary material for this article can be found at https://doi.org/10.1017/S0043887120000179.
Data
Replication files for this article can be found at https://doi.org/10.7910/DVN/KPAXSZ.
Acknowledgments
I am grateful to the editors and three anonymous reviewers of World Politics for their insightful feedback and comments. I would especially like to thank Ken Roberts, Gustavo Flores-Macías, Michael Jones-Correa, and Jamila Michener, as well as Liz Acorn, Michael Allen, Reid Andrews, Sidney Chalhoub, Alejandro de la Fuente, Jana Morgan, Rachel Schwartz, Whitney Taylor, and Chris Way. I am also grateful to colleagues at the Center for Inter-American Policy and Research at Tulane University, as well as the participants of the Mark Claster Mamolen Workshop at Harvard University and the 2018 meeting of the Network for the Study of Political Economy in Latin America (repal). I am also indebted to the many friends, colleagues, activists, research assistants, and interviewees in Brazil who made this research possible by generously lending their time and support to this project in many ways. Datafolha and pesb survey data were made available by the Centro de Estudos de Opinião Pública (cesop) at the Universidade Estadual de Campinas.
Funding
Original data collection was supported by the National Science Foundation and the Fulbright-Hays Foundation, as well as Cornell University’s Mario Einaudi Center for International Studies, Center for the Study of Inequality, and Department of Government.
Authors
David De Micheli is an assistant professor of political science and ethnic stud- ies at the University of Utah. His research interests include ethnic and identity politics, inequality, and citizenship, with a focus on Latin America. His current book project centers on the consequences of educational expansion for the politi- cization of racial identities and inequalities in Brazil. He can be reached at david. demicheli@utah.edu.