

INTRODUCTION
In the oceans, growth conditions of phytoplankton are controlled by spatial and seasonal changes linked to physical and chemical parameters, such as interactions on the sea surface, temperature, turbulence, vortices, winds, upwelling, currents, precipitations, salinity and distribution of nutrients (Souza et al., Reference Souza, Luz and Mafalda2010; Racault et al., Reference Racault, Le Quéré, Buitenhuisb, Sathyendramatha and Platt2012).
Islands, banks and seamounts are the main topographic features in the ocean bottom that stimulate physical, biological or geological alterations and/or perturbations in the marine ecosystem. They may create a potential variability in the space, and an alteration in the dynamics, productivity and distribution of nutrients. Thus, they are considered important ecosystems for the biota of remote regions from the continent by favouring the formation of vortices and upwelling, and by conditioning the generation of microbiotopes or ‘oases’, which influences the increase in productivity, diversity and biomass of planktonic microorganisms (Racault et al., Reference Racault, Le Quéré, Buitenhuisb, Sathyendramatha and Platt2012; Santos et al., Reference Santos, Moita, Bashmachnikov, Menezes, Carmo, Loureiro, Mendonça, Silva and Martins2013).
The presence of islands and seamounts stimulates changes in the termohaline and the hydrodynamic structure of oceanic environments. This phenomenon is called the island mass effect, which is when a mixture of recirculation currents and upwelling cause nutrient-rich waters of moderate depth to reach the photic zone (Doty & Ogury, Reference Doty and Ogury1956). One of the main influences on the marine environment is increased biomass plankton around these areas (Boehlert, Reference Boehlert1988).
In the water column of the tropical oceanic region, it is common to find a vertical stratification of great stability, with three distinct layers: one surface layer of mixture, hot and poor in nutrients; one layer of thermocline, that is, a region of abrupt changes of temperature, density and nutrients; and one or more deep layers, cold and rich in nutrients (Valentin et al., Reference Valentin, Paranhos, Faro and Gonzalez2007).
According to Fenell & Boss (Reference Fennell and Boss2003), there are some processes that favour the accumulation of phytoplanktonic organisms at the top of thermocline, such as increased cellular growth rate due to satisfactory conditions of light and nutrients, diminishment of herbivory when compared to the superficial zone of mixture, cellular accumulation and chlorophyll detritus that deposits in the pycnocline, and the mono-specific growth of cells with high levels of chlorophyll per biomass.
The St. Peter and St. Paul Archipelago (SPSPA) is an emerging point of a rocky submarine that rises from a depth of 4000 m in the vast oceanic area of the Equatorial Atlantic. For this reason, it becomes an important point of support for migratory organisms and for secondary production (Miguens, Reference Miguens1995).
Some previous studies have already been conducted in the SPSPA to determine the floristic composition in horizontal transects of the superficial layer (Koening & Oliveira, Reference Koening, Oliveira, Viana, Hazin, Vieira and Carvalho de Souza2009; Queiroz, Reference Queiroz2011; Tiburcio et al., Reference Tiburcio, Koening, Macêdo and Melo2011). However, the vertical distribution of these species and the influence of oscillating penetration of the thermocline have never been verified.
The present study aims to investigate the chemical and physical influence on the phytoplankton assemblage and its distribution patterns in the water column, especially at the thermocline depths.
MATERIAL AND METHODS
Study area
In the Equatorial Atlantic Ocean, the SPSPA is the smallest and most isolated Brazilian archipelago inserted in the Exclusive Economic Zone (EEZ). It is also the only one in the country in the Northern hemisphere, located 100 km north from the Equatorial Line, between 0°55′10″N and 29°20′33″W. It is formed by a group of ten islands and rockheads that rise from depths that reach 4000 m (Campos et al., Reference Campos, Petta, Theye, Sichel, Simões, Srivastava, Neto, Andrade, Viana, Hazin, Vieira and Carvalho de Souza2009).
The main currents flowing towards the west on the surface layer, reaching the SPSPA, are the North Equatorial Current (NEC) and the South Equatorial Current (SEC). The NEC presents a relatively broad and continuous flow. On the other hand, the SEC consists of three zonal branches separated by a countercurrent of relatively weak intensity (Stramma & Schott, Reference Stramma and Schott1999).
The SPSPA region is under the influence of the Intertropical Convergence Zone (ITCZ) from January to May (rainy season). In the second semester, from June to September, the ITCZ moves northward and there is less rainfall in the region (dry season). The maximum recorded monthly accumulated rainfall was 370 mm in April. Prevailing winds in the region are the south-east trade winds with a fairly constant intensity of around 7 ms−1 (Soares et al., Reference Soares, Oliveira, Skielka, Servain and Hazin2009). In studies conducted by Macedo et al. (Reference Macedo, Flores Montes, Costa, Viana, Hazin, Vieira and Carvalho de Souza2009), air and sea surface temperatures close to the archipelago showed a similar seasonal cycle. The air temperature varies between 26°C and 28°C, with higher values in April and May, and lower temperatures between July and September (Soares et al., Reference Soares, Oliveira, Skielka, Servain and Hazin2009). The sea surface temperatures range from 27°C to 27.2°C, and this difference rarely exceeds 1°C.
The thermocline in equatorial and tropical areas is permanent throughout the year and it is located at depths that range from 50 to 120 m. On the other hand, in areas suffering the influence of banks and oligotrophic tropical ocean islands, the thermocline is considered temporal and rises close to the archipelago through the influence of relief, due to the encounter of water masses with a physical barrier, which in this case is the archipelago. However, they do not arise due to the strong stratification of the water (Medeiros et al., Reference Medeiros, Macêdo, Feitosa and Koening1999; Travassos et al., Reference Travassos, Hazin, Zagaglia, Adivíncula and Schober1999). According to Macedo et al. (Reference Macedo, Flores Montes, Costa, Viana, Hazin, Vieira and Carvalho de Souza2009), salinity varies between 33.38 and 34.99 on the surface, presenting a sub-surface maximum between 35 and 35.5, from 100 to 150 m. According to Flores-Montes (Reference Flores Montes2003), the region of maximum phytoplankton productivity is found at a depth of around 70 m, well above the maximum peak of vertical nutrient concentration.
Sampling design
The expedition was on board the Cruzeiro do Sul Hydro-oceanographic ship, which belongs to the Brazilian Navy, and it took place from 21 to 23 July 2010, during the dry season of the region.
An Acoustic Doppler Current Profiler (ADCP) mounted on the hull was used to determine the direction and velocity of the prevailing current. Two transects were delimited in function of this current, one west (W) and another east (E) of the Archipelago, each one composed of three oceanographic stations (Figure 1). For both transects, the stations were numbered in ascending order starting from the SPSPA (1 – closest, 2 – intermediate and 3 – distant). Thus, stations were defined as W1, W2, W3 and E1, E2, E3.
Location of transects west (W) and east (E) and oceanographic stations in the St. Peter and St. Paul Archipelago.

For qualitative and quantitative samples, vertical integrated hauls were performed during the day (D) and night (N), and samples were identified as W3D, W3N, W2D, W2N, W1D, W1N, E3D, E3N, E2D, E2N, E1D and E1N. For the physicochemical and phytoplankton density samples, the following parameters were obtained: depth of the thermocline and of the subsurface chlorophyll peak (CTD with fluorometer).
Physical and chemical analysis
The levels of dissolved oxygen were determined aboard using the Winkler Method modified by Strickland & Parsons (Reference Strickland and Parsons1972). The rate of saturation of dissolved oxygen was obtained using the International Oceanographic Tables (UNESCO, 1973), by correlating the levels of dissolved oxygen with values of temperature and salinity. The pH was measured using a pH meter, model HANNA 8417.
For the analysis of dissolved inorganic nutrients, water samples were placed in 300 ml plastic bottles, immediately frozen and subsequently transported to the Laboratory of Chemistry of the Department of Oceanography at Universidade Federal de Pernambuco (UFPE). At the laboratory, analyses of dissolved nutrients (nitrite, nitrate, ammonia and phosphate) were performed as described by Strickland & Parsons (Reference Strickland and Parsons1972), and silicate as described by Grasshoff et al. (Reference Grasshoff, Ehrhardt and Kremling1983).
Temperature and salinity profiles were obtained using a CTD (model SBE-SeaBird Electronics Seacats 19).
Water samplings were obtained at the following depths: surface (SURF.), 25, 50, 10 m above the DCM – deep chlorophyll maximum (DCM + 10), DCM and 10 m below the DCM (DCM-10). However, in some stations with lower depths, some samplings were not performed.
Phytoplankton composition
For qualitative analysis of the community, vertical integrated hauls were performed with a 20-μm mesh conical-cylinder net 10 m below the thermocline (from 75 to 105 m) up to the surface, totalling 12 samples.
Samples were fixed on board in neutralized formaldehyde solution (4%), and four sub-samples of 0.5 ml were analysed and counted. All material was deposited in the collection of the Department of Oceanography of the UFPE.
For quantitative analysis, samples were collected with the aid of Niskin bottles at the same depths as physicochemical samples, and they were also fixed with neutralized formaldehyde (4%).
Phytoplankton density (cel l−1) was analysed in an inverted microscope (model Zeiss Axiovert), under magnifications of 200× and 400×, employing the sedimentation method of Utermöhl (Reference Utermöhl1958), described by Hasle (Reference Hasle and Sournia1978).
Taxonomic identification of the species was based on specific literature. For Cyanobacteria: Desikachary (Reference Desikachary1959), Komárek & Anagnostidis (Reference Komárek and Anagnostidis2005); Dinophyta: Balech (Reference Balech1988), Tomas (Reference Tomas1997) and Gómez (Reference Gómez2005); and Ochrophyta: Tomas (Reference Tomas1997). For taxonomic updating, all scientific names were checked in the international database ALGAEBASE (http://www.algaebase.org) from 21 to 23 January 2012.
Statistical analysis
The relative abundance of taxa was calculated according to Lobo & Leighton (Reference Lobo and Leighton1986), considering the categories: Dominant – species whose numerical occurrence was greater than 50% of the total number of cells in the sample; Abundant – species whose occurrence exceeded the average value of cells in the sample; Rare – species whose occurrence was lower than the average value of cells in the sample.
In the frequency of occurrence, taxa were considered very frequent (≥70%), frequent (70–40%), less frequent (40–10%) or sporadic (≤10%), according to Matteucci & Colma (Reference Matteucci and Colma1982). The relative abundance and frequency of occurrence of taxa were calculated only for samples that were collected using the net.
The Shannon index (Shannon, Reference Shannon1948) was used to calculate specific diversity, and the resulting values were classified according to Valentin et al. (Reference Valentin, Macedo-Saidah, Tenenbaum and Silva1991): high diversity when the results were ≥3.0 bits cel−1; average, with results between 2 and 3 bits cel−1; low, between 1 and 2 bits cel−1; and very low, with the result ≤1 bit cel−1. Equitability was obtained according to Pielou (Reference Pielou1977). These indices were calculated using statistical software PRIMER 6 (Plymouth Routines in Multivariate Ecological Research).
The similarity between pairs of samples was calculated using the Euclidean distance (abiotic data) and the Bray Curtis index (data from the phytoplankton community). The One Way Analysis of Similarity (ANOSIM) was used to test the significance of abiotic data. The Principal Components Analysis (PCA) technique was adopted for multivariate analysis. For these statistical tests, PRIMER 6 software was used, with a significance level of P < 0.05.
The Spearman correlation coefficient was used to assess the degree of association between the abiotic values and the density of species, and total density of organisms, through Sigma Plot software. Values of P < 0.05 were considered significant.
RESULTS
Results concerning physical data in the vicinity of the SPSPA showed that, in both transects, there was a temperature variation with depth, of 28.6°C at the surface and 15.6°C at a depth of 100 m. The thermocline was located between 50 and 110 m in the W transect, and between 40 and 100 m in the E transect (Figure 2).
Temperature and salinity profiles of oceanographic stations in transects west (W) and east (E) around the St. Peter and St. Paul Archipelago.
In relation to chemical data, salinity varied with depth. A slight variation was observed at the surface, with an average of 35.43, evidencing an increase in salinity between depths of 50 and 110 m in transect W and between depths of 40 and 100 m in transect E (Figure 2).
The Temperature and Salinity diagram showed the predominance of two masses of water: Tropical Water (TA), characterized by temperatures above 18°C and salinity between 34 and 36; and South Atlantic Central Water below the TA, with low temperatures (between 5°C and 18°C) and a high level of dissolved oxygen (Figure 3).
T-S diagram of oceanographic stations in transects west (W) and east (E) around the St. Peter and St. Paul Archipelago.
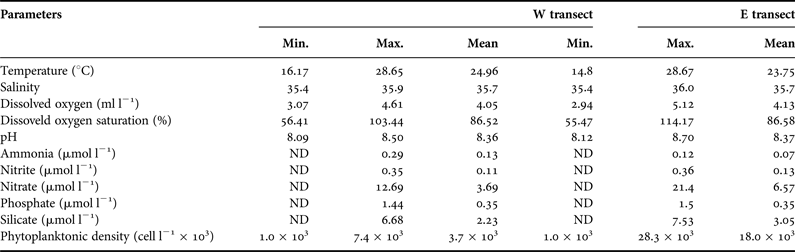
Dissolved oxygen ranged between 3.07 and 4.61 ml l−1 in the W transect, and from 2.94 to 5.12 ml l−1 in the E transect between surface and maximum depth. The saturation rate of dissolved oxygen varied between 56.41 and 103.44% in the W transect and from 55.47 to 114.17% in the E transect. The pH values were constantly alkaline, with values between 8.09 and 8.50 for the W transect and from 8.12 to 8.70 for the E transect (Table 1).
Data from abiotic and biotic variables sampled around the St. Peter and St. Paul Archipelago, according to the stations and depths of collection, respectively.
Min., Minimum; Max., Maximum; ND, not detectable.
Regarding inorganic dissolved nutrients, vertical distribution showed low values on the surface layer, and elevated concentrations with the increasing depth. The value of ammonia concentrations ranged from below the limit of detection (ND or DL) to 0.29 µmol l−1 in the W transect, and from ND to 0.12 µmol l−1 in the E transect.
Nitrite values ranged from ND to 0.35 µmol l−1 in the W transect, and from ND to 0.36 µmol l−1 in the E transect. Nitrate values ranged from ND to 12.69 µmol l−1 in the W transect, and from ND to 21.40 µmol l−1 in the E transect. Phosphate values ranged between ND and 1.44 µmol l−1 in the W transect, and between ND and 1.50 µmol l−1 in the E transect. Silicate values ranged from ND to 6.68 µmol l−1 in the W transect, and from ND to 7.53 µmol l−1 in the E transect (Table 1).
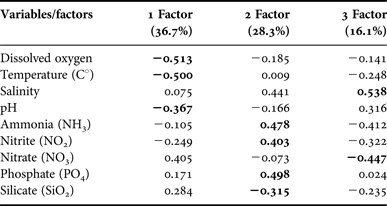
In the PCA performed using abiotic parameters and samples collected in the net hauls, the first two components explained 65% of the data variation (Table 2). Factor 1 highlighted a direct relation between dissolved oxygen, temperature and pH. Factor 2 showed a direct relation between ammonia, nitrite and phosphate, and an inverse correlation with silicate.
Principal component analysis for environmental variables.
Abiotic variables that were the most significant factors are shown in bold.
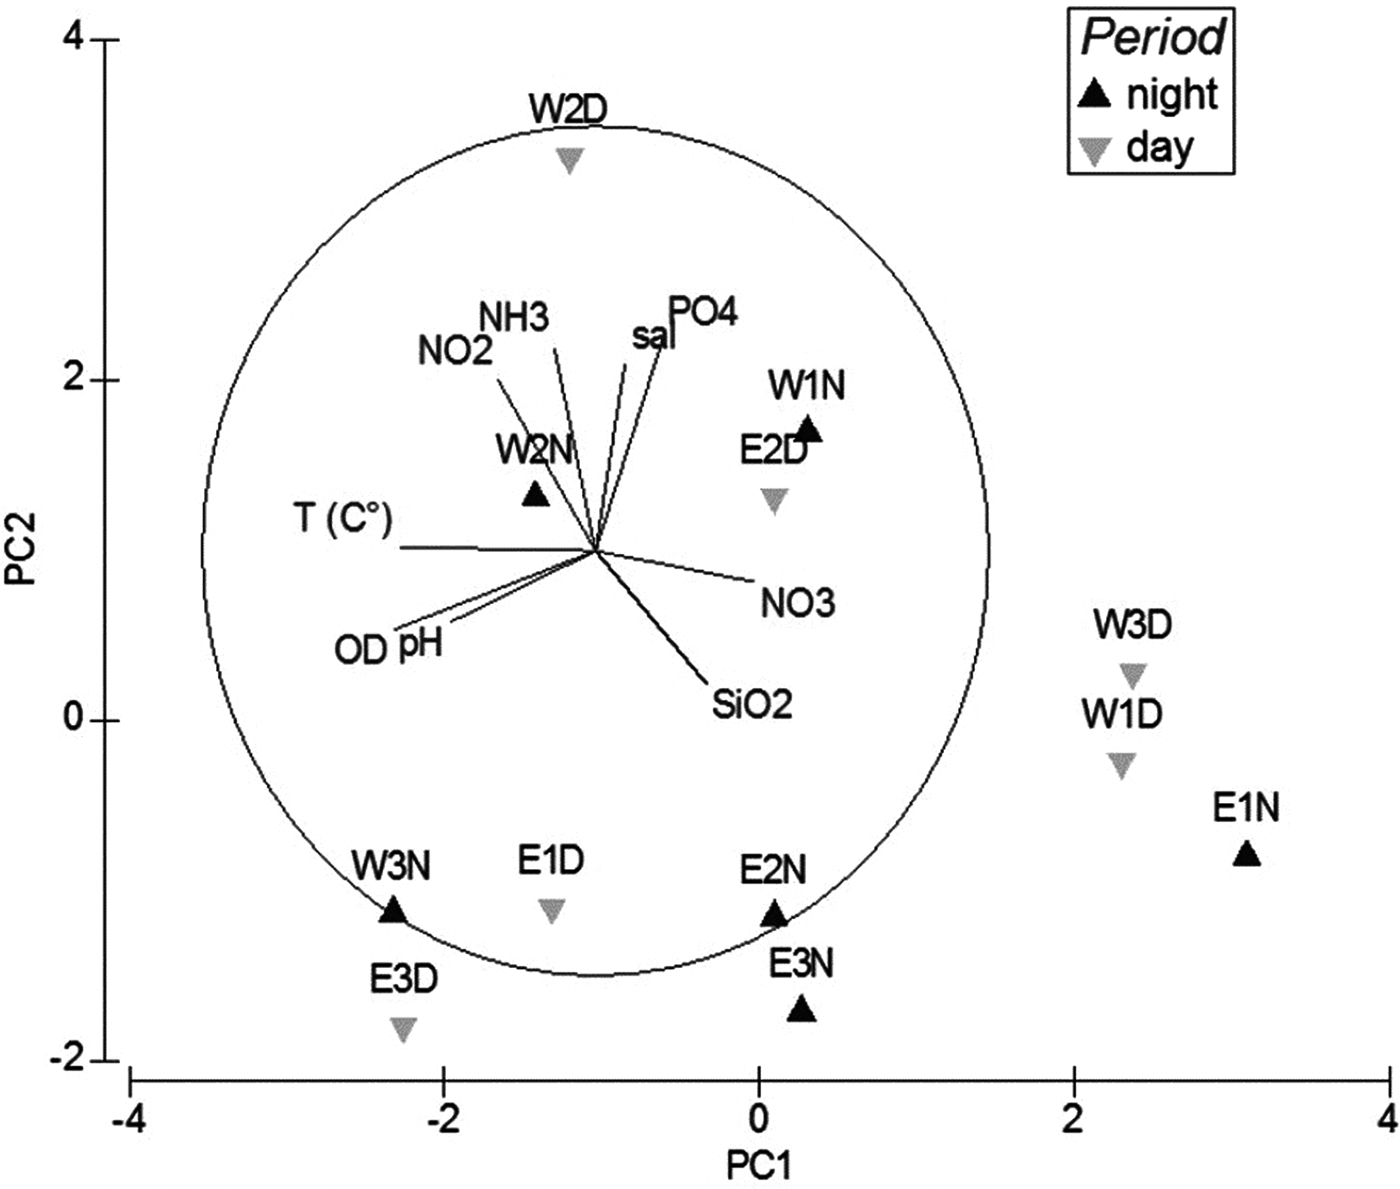
The distribution of samples according to time of day (day and night) and per transect (W and E) with the environmental variables that may influence them, are displayed in the graphical representation of the PCA (Figure 4). A division between transects was observed, considering that most samples from the W transect were associated with nutrients and salinity, while samples from the E transect were influenced by temperature, dissolved oxygen, pH and silicate (related to factor 1).
Graphical representation of environmental variables that influence the stations of the sampled network in the vicinity of the St. Peter and St. Paul Archipelago. Samples: W3D, W3N, W2D, W2N, W1D, W1N, E3D, E3N, E2D, E2N, E1D and E1N; Sal, Salinity; T, Temperature; PC1, PC2, factors of the principal component analysis.
The relationship between physical and chemical parameters and the most abundant species found in the vertical distribution was analysed using the Spearman correlation. The most abundant species were cyanobacteria Trichodesmium thiebautii Gomont, and dinoflagellates Oxytoxum longiceps Schiller and Protoperidinium minimum Schiller. For the biotic factors, only those correlated with some abiotic factor are shown in Table 3.
Spearman's correlation matrix between abiotic and biological variables of the phytoplankton of the St. Peter and St. Paul Archipelago.

P < 0.05- *; P < 0.01- **; P < 0.001- ***.
DO, Dissolved oxygen.
The ANOSIM shows a relation between temperature and total density (P < 0.001) and the species T. thiebautii (P < 0.001) and O. longiceps (P < 0.05). There was a negative correlation between salinity and total density (P < 0.001), and the species T. thiebautii (P < 0.001) and O. longiceps (P < 0.01), and a positive correlation with P. minimum (P < 0.001) (Table 3).
There was also a positive correlation between dissolved oxygen, saturation of dissolved oxygen and pH with Total Density (P < 0.001) and T. thiebautii (P < 0.001). In relation to nutrients, nitrite significantly correlated only with T. thiebautii (P < 0.05) and phosphate had a negative correlation with the Total Density (P < 0.05).
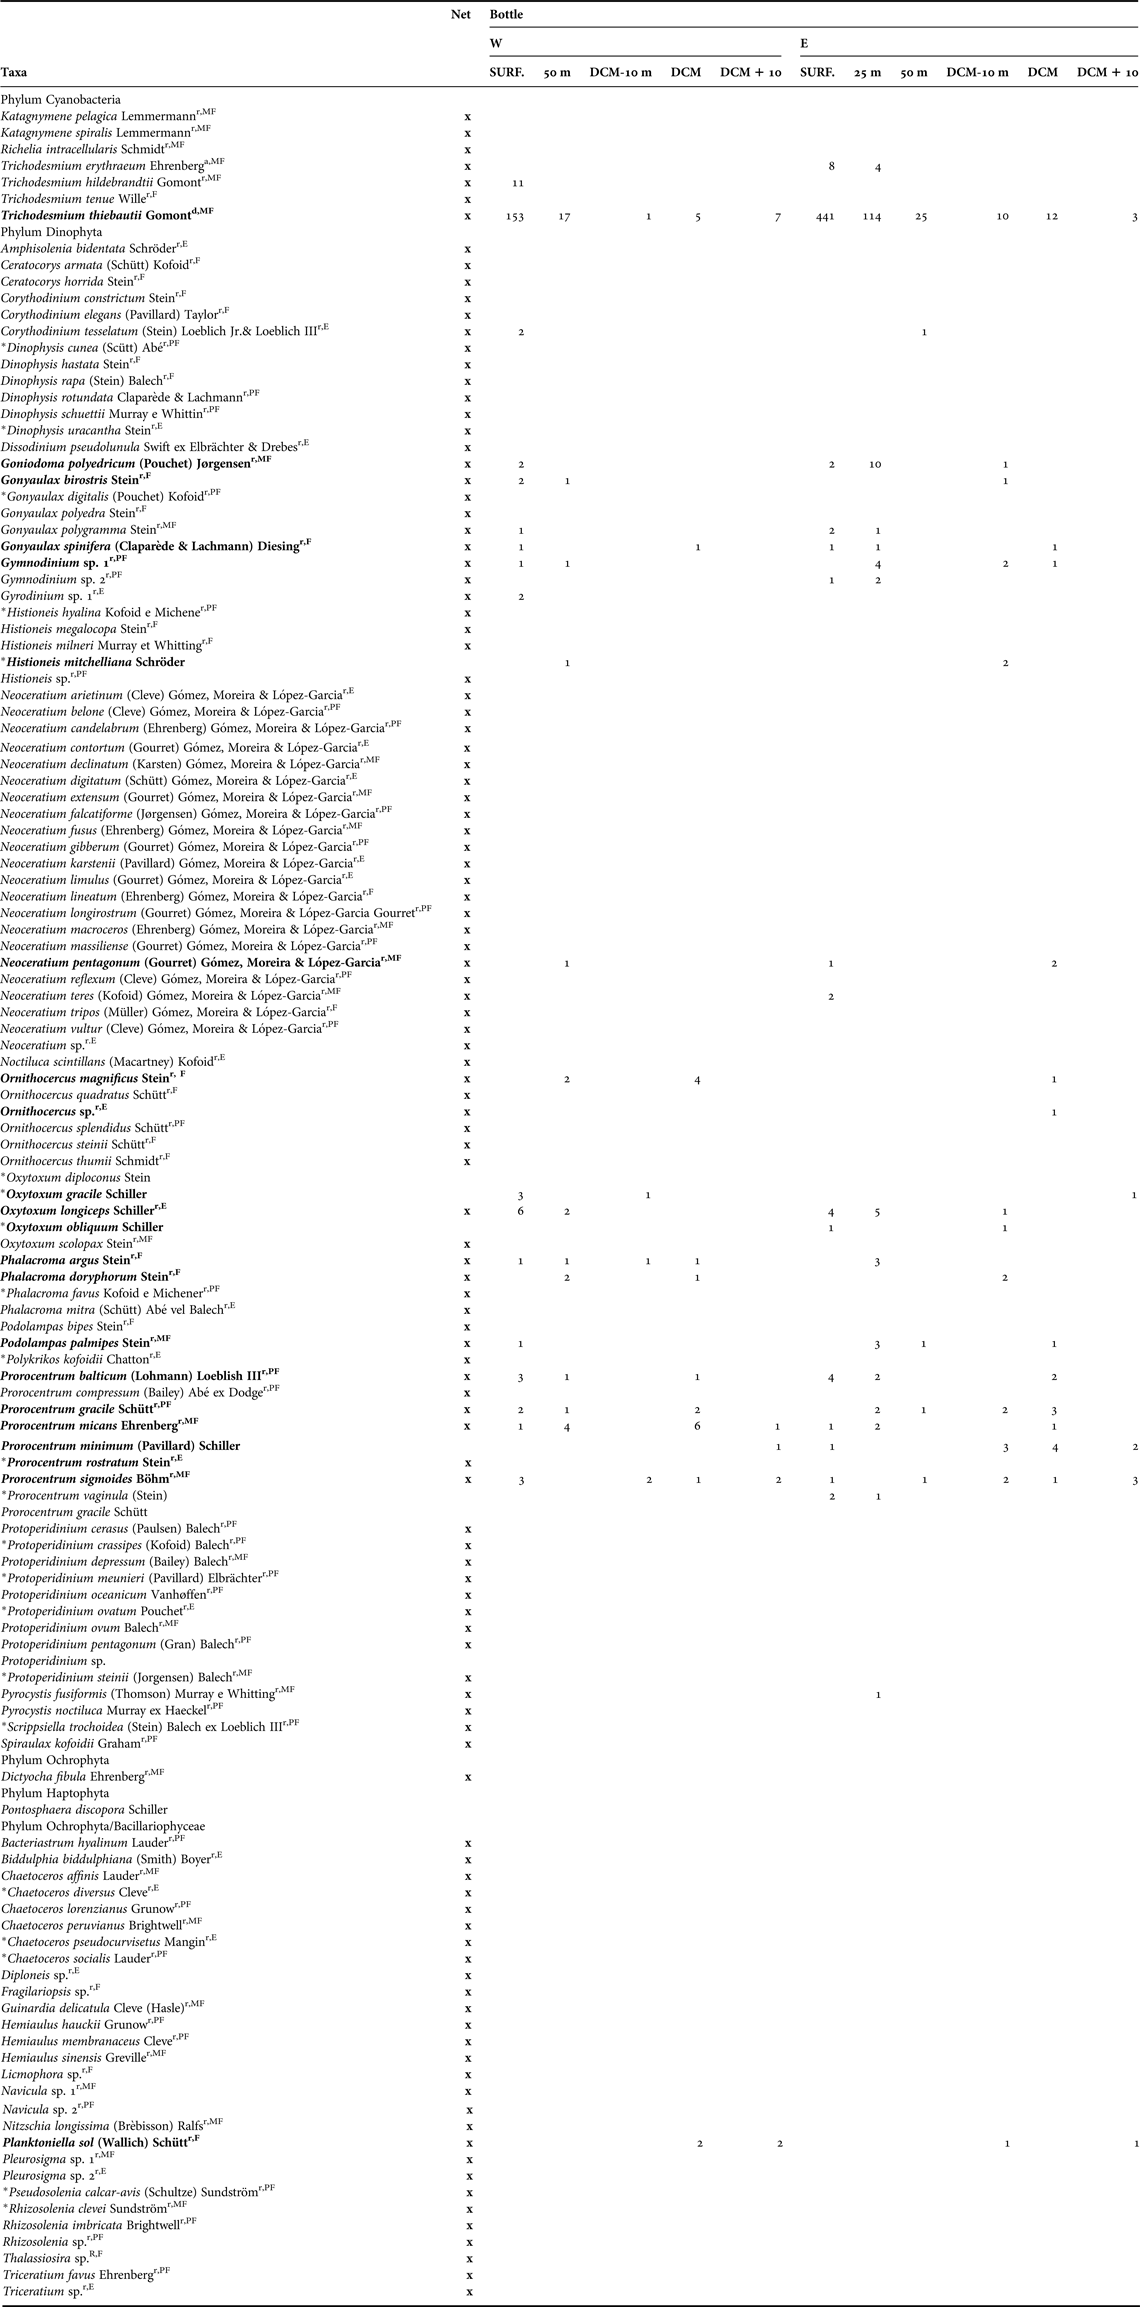
The phytoplankton community of the SPSPA was represented by 128 species distributed into four phyla (Table 4).
Composition of the phytoplankton community in the vicinity of the St. Peter and St. Paul Archipelago according to relative abundance, frequency of occurrence of taxa per transect and identification of the species collected in the net, and the respective depths of the bottled collection.
SURF., surface; DCM, deep chlorophyll maximum; DCM-10 m, deep chlorophyll maximum minus 10 m deep; DCM + 10 m, deep chlorophyll maximum plus 10 m deep; W, transect 1; E, transect 2.
Relative abundance: d, dominant; a, abundant; r, rare. Frequency of occurrence: VF, very frequent; F, frequent; IF, infrequent; S, sporadic.
*new occurrences.
The species in bold refer to the species that were present in the thermocline (between 50 and 100 m).
Among the species sampled in vertical hauls, the seven observed species of cyanobacteria were very frequent. However, only T. thiebautii was considered dominant in nine out of 12 studied stations (Table 4).
Regarding the phylum Ochrophyta, 28 species were observed, with a predominance of the genera Rhizosolenia Ehrenberg and Chaetoceros Ehrenberg. Only Dictyocha fibula Ehrenberg was very frequent in both transects, albeit rare in relative abundance. Nine species were very frequent in the W transect and eight species in the E transect, although all were characterized as rare in relative abundance in both transects.
In spite of the large number of species reported in the area, some were recorded for the first time for the SPSPA in the present study (Table 4).
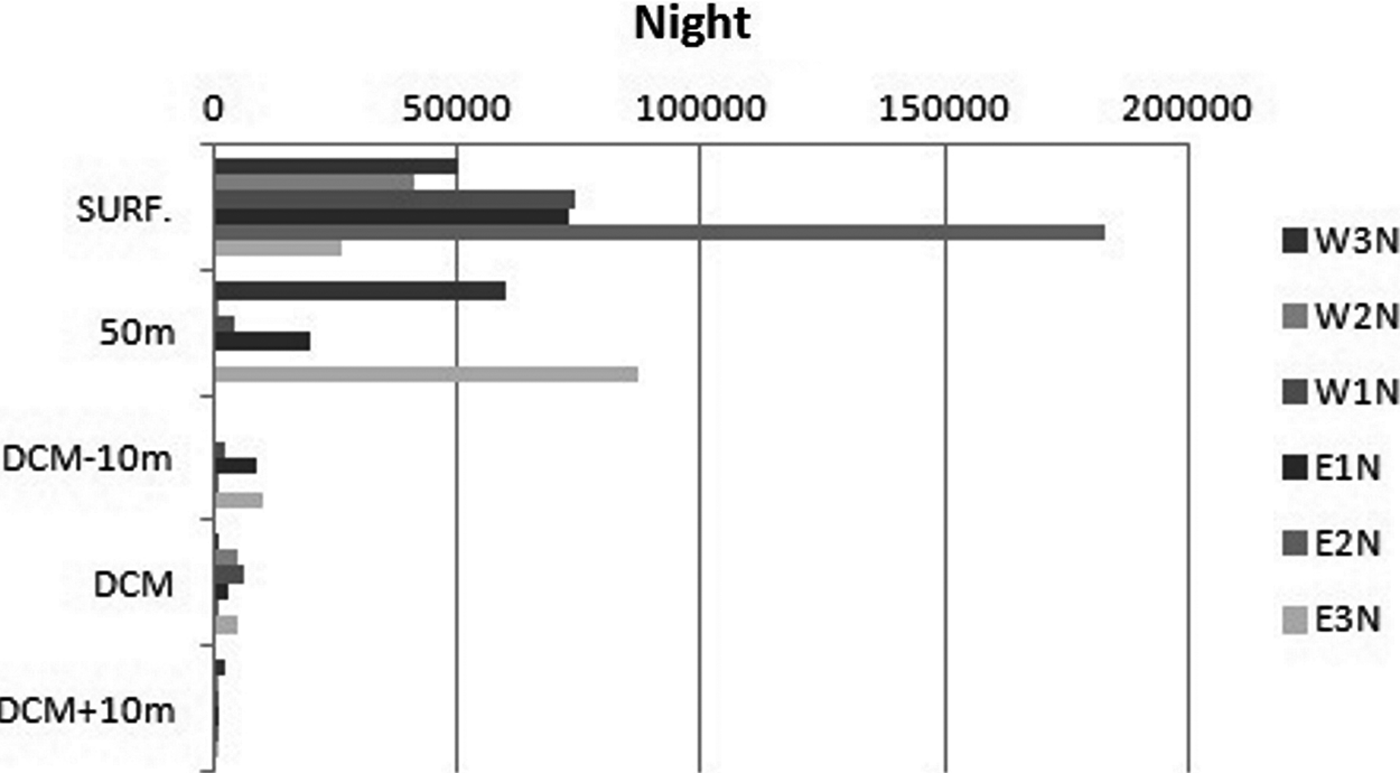
With regard to vertical distribution, higher density values were found at the surface of station E2N with 183 cel l−1 × 10³. Regarding the depths, the highest values were found at a depth of 50 m at station W3N with 60 cel l−1 × 10³ and at station E1N at a depth of 50 m with 87 cel l−1 × 10³ (Figure 5). These high values are especially due to the dominance of T. thiebautii that had a maximum density of 65 cel l−1 × 10³.
Phytoplankton density (cells per litre) for the oceanographic station in DCM at night around the St. Peter and St. Paul Archipelago. SURF., surface; DCM, deep chlorophyll maximum; DCM-10 m, deep chlorophyll maximum minus 10 m deep; DCM + 10 m, deep chlorophyll maximum plus 10 m deep. Samples: W3N, W2N, W1N, E1N, E2N, E3N.
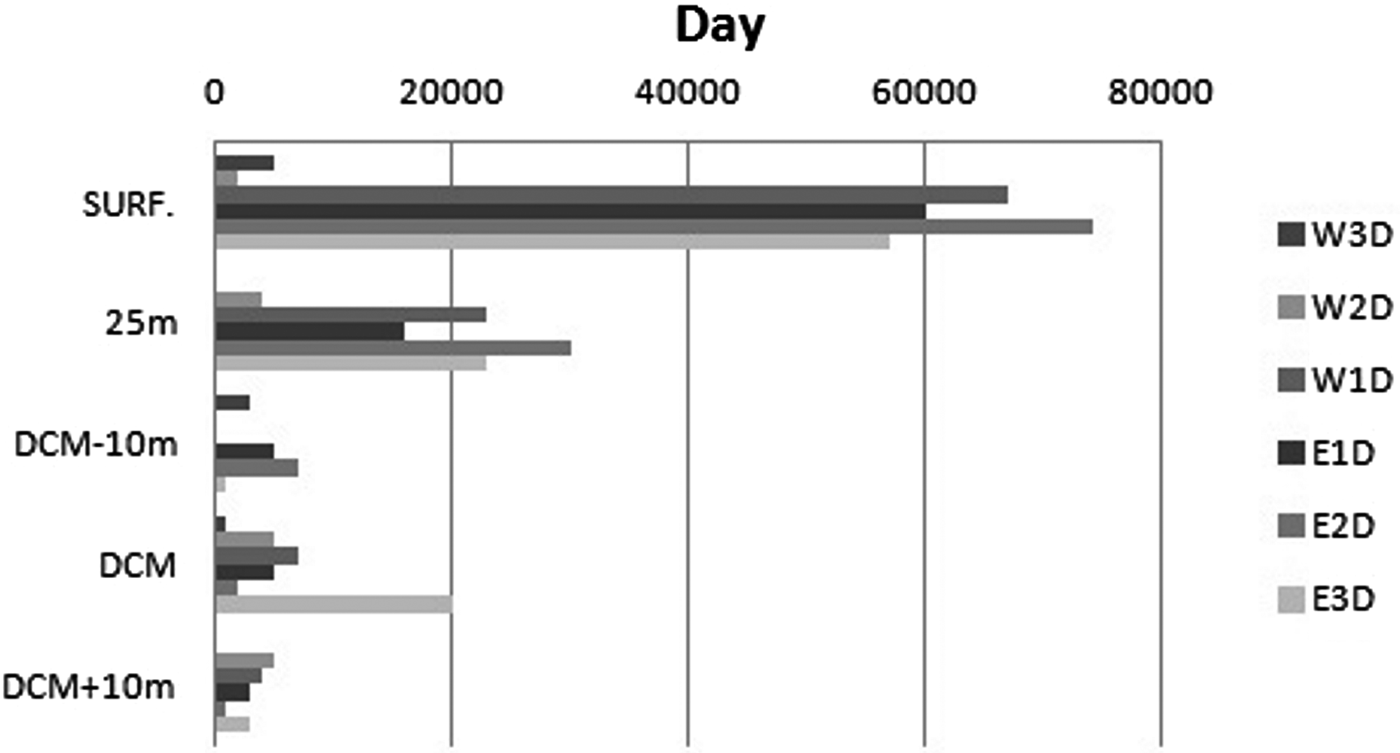
Figure 6 shows the vertical distribution of phytoplankton organisms during the day. A higher concentration of organisms in the surface layer at most stations was observed (W1D, E1D, E2D, E3D) with values between 50 and 74 cel l1 × 103. However, there was also relatively high densities at a depth of 25 m (30 cel l−1 × 10³ at station E2D and 23 cel l−1 × 10³, at stations W1D, E3D).
Phytoplankton density (cells per litre) for oceanographic station in DCM at day around the St. Peter and St. Paul Archipelago. SURF., surface; DCM, deep chlorophyll maximum; DCM-10 m, deep chlorophyll maximum minus 10 m deep; DCM + 10 m, deep chlorophyll maximum plus 10 m deep. Samples: W3N, W2N, W1N, E1N, E2N, E3N.

Specific diversity and evenness rates varied widely in the phytoplankton community. In the W transect, specific diversity ranged from a minimum of 1.44 bits cel−1 (sample W1D) to a maximum of 4.32 bits cel−1 (sample W1N), while evenness varied between 0.25 (sample W1D) and 0.73 (sample W1N).
In the E transect, minimum diversity was 0.72 bits cel−1 (sample E3N) and maximum diversity was 3.89 bits cel−1 (sample E2N). Evenness varied from 0.12 (sample E3N) to 0.64 (sample E3N), respectively.
DISCUSSION
In tropical and subtropical oceanic regions, there is a vertical and horizontal structure of water with little physical change, with the thermocline occurring between depths of 60 and 120 m. Variations in depths at which the thermocline starts are related to the presence of SPSPA, which is a geological feature that allows input of the richest water at the base of the photic layer. Normally, the thermocline it is located between depths of 80 and 90 m, while in the archipelago depth of the thermocline ranged from 40 to 50 m.
Travassos et al. (Reference Travassos, Hazin, Zagaglia, Adivíncula and Schober1999) found no evidence of upwelling due to the interaction between currents and topography in the archipelago, while Bröckel & Meyerhöfer (Reference Bröckel and Meyerhöfer1999) observed no surface enrichment or a biological parameter that could indicate increased productivity due to resurgence in the archipelago. However, Araujo & Cintra (Reference Araujo, Cintra, Viana, Hazin, Vieira and Carvalho de Souza2009) indicate that the interaction of currents with the topography of the archipelago can cause physical processes such as the production of vortices, disturbances of thermohaline structure and possible mechanisms of local upwelling.
Accordingly, Philips et al. (Reference Philips, Badylak and Grosskopf2002) state that temperature may influence the metabolism of phytoplankton organisms, which increases the photosynthesis rate, and the growth and reproduction of these organisms.
Salinity and temperature values found in this study are consistent with studies by Valentin et al. (Reference Valentin, Paranhos, Faro and Gonzalez2007) for the central region of the Brazilian EEZ, by Cordeiro et al. (Reference Cordeiro, Brandini, Rosa and Sassi2013) in studies in the Fernando de Noronha chain, and by Zagaglia (Reference Zagaglia1998), Macedo et al. (Reference Macedo, Flores Montes, Costa, Viana, Hazin, Vieira and Carvalho de Souza2009) and Soares et al. (Reference Soares, Oliveira, Skielka, Servain and Hazin2009) in the SPSPA.
In the study area, a supersaturation of dissolved oxygen was observed on the surface, which decreased along the water column. The high levels of dissolved oxygen reflect a good oxygenation of the water. This finding is similar to observations reported by Rezende et al. (Reference Rezende, Andrade, Suzuki, Faro, Gonzalez, Paranhos and Valentin2007), Macedo et al. (Reference Macedo, Flores Montes, Costa, Viana, Hazin, Vieira and Carvalho de Souza2009) and Queiroz (Reference Queiroz2011).
The pH values found in the study area were alkaline and considered typical of oceanic regions, following the pattern found in other studies in similar regions (Niencheski et al., Reference Niencheski, Baumgarten, Roso and Bastos1999; Rezende et al., Reference Rezende, Andrade, Suzuki, Faro, Gonzalez, Paranhos and Valentin2007; Queiroz, Reference Queiroz2011).
The distribution of nutrients in the oceans is determined by ocean circulation, consumption by biological processes, resuspension and mineralization, the deposition of organic matter fragments through the water column and the subsequent regeneration of nutrients, and by the continental input. For the oceanic region of North-eastern Brazil, Flores-Montes (Reference Flores Montes2003) stated that nitrogen is the limiting nutrient of the basic processes of primary productivity.
In the SPSPA, nitrite was the limiting factor and the inverse relationship with the high density of organisms in the surface layer (0–50 m deep) benefited Trichodesmium thiebautii. In addition to this cyanobacteria, the presence of some species of dinoflagellates, such as Ornithocercus, Podolampas and Prorocentrum, was observed at a depth of up to 105 m, and diatomaceous Planktoniella sol at depths greater than 75 m. The species mentioned above are distributed vertically in other tropical oceanic areas (Boonyapiwat, Reference Boonyapiwat2001; Tenenbaum et al., Reference Tenenbaum, Gomes, Guimarães and Valentin2007; Souza, Reference Souza2010).
When the correlation between physicochemical parameters and the species was analysed, only T. thiebautii, Oxytoxum longiceps and Prorocentrum minimum showed a significant correlation.
The factors tested by the Spearman correlation for T. thiebautii demonstrated that high light intensity and temperature, dissolved oxygen, buffer pH and little vertical mixture, besides the consumption of nutrients (especially nitrite) and low surface salinity, are parameters found in the area that may be associated to the high concentrations found by Capone et al. (Reference Capone, Zehr, Paerl, Bergman and Carpenter1997) and Hood et al. (Reference Hood, Coles and Capone2004).
On the other hand, O. longiceps preferred the warm and slightly saline surface layer, as it was observed mostly up to 50 m deep. The reverse occurred with P. minimum that preferred deeper waters due to the positive correlation with salinity only, which was at its highest value where the species was found (in the halocline and thermocline).
Pelagic cyanobacteria are common in tropical and subtropical oceans. This is particularly true for the genus Trichodesmium that has an established presence and ecological importance in planktonic flora in various regions of the world (Hawser et al., Reference Hawser, O'Neil, Roman and Coddl1992; Negri et al., Reference Negri, Bunter, Jonesc and Llewellyna2004; Capone et al., Reference Capone, Burns, Montoya, Subramaniam, Mahaffey, Gunderson, Michaels and Carpenter2005; Padmakumar et al., Reference Padmakumar, Smitha, Thomas, Fanimol, Sreerenjima, Menon and Sanjeevan2010; Nona et al., Reference Nona, Agawin, Zarruk, Duarte and Agustí2013).
In the SPSPA, T. thiebautii Gomont ex Gomont was the only dominant species in the area, as evidenced by low levels of species diversity and evenness in the stations in which it was dominant. It was also evident in past studies in the same area by Koening & Oliveira (Reference Koening, Oliveira, Viana, Hazin, Vieira and Carvalho de Souza2009), Tiburcio et al. (Reference Tiburcio, Koening, Macêdo and Melo2011) and Queiroz (Reference Queiroz2011).
Besides these factors, the high productivity of T. thiebautii and the ability to assimilate atmospheric nitrogen are considered by Hood et al. (Reference Hood, Coles and Capone2004) and Siqueira et al. (Reference Siqueira, Kolm and Brandini2006) as responsible for the increase in planktonic biomass in tropical oligotrophic seas.
According to Capone et al. (Reference Capone, Burns, Montoya, Subramaniam, Mahaffey, Gunderson, Michaels and Carpenter2005), the cycles of nitrogen and carbon in the subtropical and tropical regions of the oceans can only be understood if N2 fixation is included as an important source of nitrogen to the upper water column, comparable to inputs of NO3 trading between water masses along the water column.
A large number of taxa were identified in the SPSPA, which demonstrates the diversity of the area, supported by previous studies in the region. Koening & Oliveira (Reference Koening, Oliveira, Viana, Hazin, Vieira and Carvalho de Souza2009) identified 107 taxa, Tiburcio et al. (Reference Tiburcio, Koening, Macêdo and Melo2011) identified 131 species and Queiroz (Reference Queiroz2011) observed 110 taxa. New occurrences have also been recorded, demonstrating the need for more studies in the area, especially in the deeper layers of the water column.
In spite of the high density of T. thiebautii, dinoflagellates predominated in number of species, surpassing the group of diatoms, thus confirming the broad distribution of these organisms in the oceans, especially in tropical regions (Tomas, Reference Tomas1997). This finding is consistent with studies of Boonyapiwat (Reference Boonyapiwat2001) and Sarojini & Nittala (Reference Sarojini and Nittala2001).
According to Barlow et al. (Reference Barlow, Aiken, Holligan, Cummings, Maritonesa and Hooker2002), the distribution of phytoplankton throughout the water column in oligotrophic regions of the Atlantic Ocean showed that the dominance of cyanobacteria was lower than 2 µm from the surface layer to the depth of the maximum chlorophyll layer. On the other hand, diatoms and dinoflagellates contributed little throughout the water column as shown by Furuya & Marumo (Reference Furuya and Marumo1983) and Boonyapiwat (Reference Boonyapiwat2000, Reference Boonyapiwat2001) in areas of the Pacific. These authors found a high cell density in the thermocline layer, which reached levels that were 2.1 to 7.5 times greater than the surface layer.
The collected data showed the influence of the thermocline in the structure and composition of phytoplankton density. However, the similarities in taxonomic composition of the dominant species in this study and in other areas suggests a high stability of communities in the Equatorial Atlantic.
To more precisely determine the influence of the thermocline in phytoplankton composition and density, however, more knowledge of the short- and long-term effects of the temporal variation, and the effects of the thermocline and vertical migration of the phytoplankton community is necessary.
ACKNOWLEDGEMENT
The authors thank Professor Sigrid Neumann Leitão, the Navy of Brazil, the National Council for Scientific and Technological Development – CNPq and CAPES (Coordination of Improvement of Higher Education Personnel) for PhD scholarship granted to ARQ and PAMCM.