Introduction
The corpus callosum (CC) is the largest white-matter (WM) structure in the CNS, running along the midline of the brain and uniting the two cerebral hemispheres (Hofer & Frahm, Reference Hofer and Frahm2006). The most anterior portion of the CC is termed the genu of the corpus callosum (gCC) which curves ventrally and continues posteriorly.
Axonal fibres comprising the CC join the cerebral hemispheres by way of homotopic and heterotopic connections, with a majority of commissural fibres uniting symmetrical areas of the hemispheres, although a proportion terminate in different contralateral regions from which they emanate. The anteriormost portion of the CC, the genu, connects regions of the frontal cortex (Nolte, Reference Nolte and Notle2002). The genu contains the inter-hemispheric axons connecting the frontal lobes, of critical interest in serious mental illness due to the importance of frontal lobe anatomy and functionality in these disorders (Nolte, Reference Nolte and Notle2002; Hofer & Frahm, Reference Hofer and Frahm2006, Park et al. Reference Park, Kim, Lee, Seok, Chun, Kim and Lee2008). The subgenual region connects the CC to the fornix, and can be located easily as it is positioned directly superior to the amygdala, and is the area containing the gCC (Babcock, Reference Babcock1984). The fornix lies directly beneath the CC and is comprised mostly of efferent fibres from the hippocampus. Hippocampal fibres project via the fornix to the ventral striatum, septal and preoptic nuclei, the orbitofrontal cortex and anterior cingulate, and less prominent connections to the anterior thalamic nucleus and the hypothalamus also exist (Griffiths et al. Reference Griffiths, Batty, Connolly and Reeves2009).
An examination of this structure is critical in the study of schizophrenia (SZ) and major depressive disorder (MDD) as there have been extensive reports of functional and structural changes in the frontal lobes of these illnesses. Structural imaging has consistently shown cortical grey-matter deficits in the frontal lobes in SZ (reviewed in Haukvik et al. Reference Haukvik, Hartberg and Agartz2014), and network models suggest disconnectivity in the frontal lobes is a key problem (Curčić-Blake et al. Reference Curčić-Blake, Nanetti, van der Meer, Cerliani, Renken, Pijnenborg and Aleman2013). WM connectivity within and between the frontal lobes is also thought to be critical in depressive disorders (Bracht et al. Reference Bracht, Federspiel, Schnell, Horn, Höfle, Wiest, Dierks, Strik, Müller and Walther2012; Ozalay et al. Reference Ozalay, Calli, Kitis, Cagdas Eker, Donat Eker, Ozan, Coburn and Saffet Gonul2013), and the extent of frontal cortical thickness has been related to severity of depressive symptoms (Riederer et al. Reference Riederer, Marti, Luechinger, Lanzenberger, von Meyenburg, Gantenbein, Pirrotta, Gaul, Kollias and Sándor2012; Wagner et al. Reference Wagner, Schultz, Koch, Schachtzabel, Sauer and Schlösser2012).
Both SZ and MDD have been demonstrated to have changes in the corpus callosum. In vivo diffusion tensor imaging (DTI) studies have shown decreased fractional anisotropy (FA) in and across the WM in SZ (Davis et al. Reference Davis, Stewart, Friedman, Buchsbaum, Harvey, Hof, Buxbaum and Haroutunian2003), specifically in the fornix and the splenium, but not the gCC (Foong et al. Reference Foong, Maier, Clark, Barker, Miller and Ron2000; Abdul-Rahman et al. Reference Abdul-Rahman, Qiu and Sim2011; Bora et al. Reference Bora, Fornito, Radua, Walterfang, Seal, Wood, Yücel, Velakoulis and Pantelis2011). First-episode SZ has been reported to have no change in callosal FA (Price et al. Reference Price, Bagary, Cercignani, Altmann and Ron2005), but with decreased size of the gCC, body and splenium, in contrast to the finding of overall increased thickness in chronic SZ (Bigelow & Rosenthal, Reference Bigelow and Rosenthal1972; Bigelow et al. Reference Bigelow, Nasrallah and Rauscher1983; Keshavan et al. Reference Keshavan, Diwadkar, Harenski, Rosenberg, Sweeney and Pettegrew2002). In chronic SZ fornix structural magnetic resonance imaging (MRI) reveals an inverse of fornix FA with septum pellucidum length (Davidson et al. Reference Davidson, Kuroki, Alvarado, Niznikiewicz, McCarley and Levitt2012), and DTI also demonstrates fornix FA in SZ males is correlated with negative symptom scores (Kunimatsu et al. Reference Kunimatsu, Aoki, Kunimatsu, Abe, Yamada, Masutani, Kasai, Yamasue and Ohtomo2012).
DTI studies have shown that treatment-resistant MDD has lowered callosal FA, which is not related to illness severity (Guo et al. Reference Guo, Liu, Chen, Xu, Wu, Ma, Gao, Tan, Sun, Xiao, Chen and Zhao2012; Hoogenboom et al. Reference Hoogenboom, Perlis, Smoller, Zeng-Treitler, Gainer, Murphy, Churchill, Kohane, Shenton and Iosifescu2012), and that FA was significantly decreased in the gCC in MDD, as well as bipolar disorder (Carrasco et al. Reference Carrasco, Tajima-Pozo, Díaz-Marsá, Casado, López-Ibor, Arrazola and Yus2012; Xu et al. Reference Xu, Jiang, Ren, Ouyang, Jiang, Wu, Kong, Womer, Liu, Blumberg, Tang and Wang2012), a possible common trend among mood disorders. Multiple cortical regions and subcortical nuclei are decreased in size in MDD (reviewed in Kempton et al. Reference Kempton, Salvador, Munafò, Geddes, Simmons, Frangou and Williams2011). Changes in these structures relate to behavioural factors in these disorders, with self-certainty in first-episode psychosis correlating with fornix FA (Buchy et al. Reference Buchy, Luck, Czechowska, Malla, Joober and Lepage2012), and fMRI in older MDD cases showing frontal processing speed correlating with gCC FA, and episodic memory correlating with FA of the gCC and fornix (Sexton et al. Reference Sexton, McDermott, Kalu, Herrmann, Bradley, Allan, Le Masurier, Mackay and Ebmeier2011).
Neuropathological studies of the callosum have shown no change in axon density in mood or affective disorders. Moreover, no change in oligodendrocyte density or overall gliosis has been reported, although a decrease in astrocyte density has been shown in the gCC in SZ (Nasrallah et al. Reference Nasrallah, McCalley-Whitters, Bigelow and Rauscher1983; Williams et al. Reference Williams, Pearce, Hirsch, Ansorge, Thom and Maier2006, Reference Williams, Hampton, Pearce, Hirsch, Ansorge, Thom and Maier2012). Post-mortem studies also show that overall or medial fornix size is not changed in SZ, MDD or bipolar disorder (Brisch et al. Reference Brisch, Bernstein, Stauch, Dobrowolny, Krell, Truebner, Meyer-Lotz, Bielau, Steiner, Kropf, Gos, Danos and Bogerts2008; Bernstein et al. Reference Bernstein, Klix, Dobrowolny, Brisch, Steiner, Bielau, Gos and Bogerts2012).
Myelin-related and oligodendroglial genes are among some of those that have been studied and found to exhibit decreased transcriptional activity in post-mortem tissue studies, suggesting oligodendroglial dysfunction in SZ. Microarrays have shown significant reduction in expression of myelination-related genes MAG, PLLP, PLP1, gelsolin and ERBB3 in SZ (Aston et al. Reference Aston, Jiang and Sokolov2004). MAG regulates myelination and the development of myelin-producing cells in the CNS (Aston et al. Reference Aston, Jiang and Sokolov2005), while ERBB3 encodes neuregulin receptor Her3 that is required for oligodendrocyte survival and differentiation, and gelsolin is involved in stabilizing the actin cytoskeleton of axons (Hakak et al. Reference Hakak, Walker, Li, Wong, Davis, Buxbaum, Haroutunian and Fienberg2001). The hippocampus and cingulate cortex, both strongly related to the structure and function of the fornix and gCC, caudate, putamen and multiple cortical regions also show decreased expression of myelin-related genes and oligodendrocyte markers in SZ (Hof et al. Reference Hof, Haroutunian, Copland, Davis and Buxbaum2002; Katsel et al. Reference Katsel, Davis and Haroutunian2005).
Oligodendrocyte gene expression is not altered in MDD in thalamic or striatal regions, but two astrocyte markers GFAP and ALDH1L1 are increased across thalamic and striatal regions in both SZ and MDD. By contrast microarray examination of temporal lobe samples from MDD show 17 genes with altered expression, 16 of which are involved in myelin formation of oligodendrocyte regulation (Aston et al. Reference Aston, Jiang and Sokolov2005; Barley et al. Reference Barley, Dracheva and Byne2009). Meta-analyses has shown decreased expression of MAG, ERBB, TF, PLP1, MOBP, MOG across multiple brain regions (reviewed in Sokolov, Reference Sokolov2007).
This study aims to examine the myelin thickness, axonal internal size and density of myelinated axons by means of novel high-resolution light microscopy using an optimized histological stain in the gCC and fornix in well-characterized cohorts of SZ, MDD and controls using precisely optimized histological staining and high-resolution oil-immersion microscopy.
Method
Cases
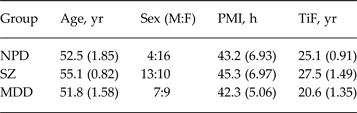
Sagittal blocks containing the gCC were obtained from the Corsellis Tissue Bank in West London Mental Health Trust UK, according to strict inclusion/exclusion criteria. All the brains come from the Corsellis Brain Collection, consisting of over 6500 brains collected during the period 1952–1997. The collection consists of brains of individuals whose death was reported to the coroner's court by Professor Corsellis and retained for further research. The majority of samples come from the county of Essex but a smaller number came from national referrals (Kasper et al. Reference Kasper, Taylor, Janz, Kasper, Maier, Williams and Crow2010). Medical notes were reviewed by a consultant psychiatrist and patients were selected on fulfilment of the WHO International Classification of Diseases, 10th edition (ICD-10) criteria for SZ and MDD, for robustness of diagnosis of the brains of the three diagnostic groups all suffered from chronic psychiatric illness. Assessment for any neurodegenerative, neurovascular or infectious pathology, including Parkinson's disease, was undertaken by a consultant pathologist and affected patients excluded. Patients with any recorded history of alcohol or drug abuse were also excluded. In SZ selection the presence of first-rank symptoms was a necessity, and cases with onset aged >30 years were excluded. Age and post-mortem interval (PMI) matched controls were selected as far as possible within the selection criteria. Fifty-nine cases were examined overall. Twenty controls, 23 SZ and 16 MDD, were included in the study (see individual details in Table 1 and group means in Table 2).
Summary of clinical and histological information on the brains from the Corsellis collection

PMI, Post-mortem interval; TIF, time in formalin; NPD, no psychiatric disorder; NK, not known; SZ, schizophrenia; MDD, major depressive disorder.
Diagnostic codes from ICD-10.
Summary group data

PMI, Post-mortem interval; TiF, time in formalin; NPD, no psychiatric disorder; SZ, schizophrenia; MDD, major depressive disorder.
Age, PMI and fixation time are given as mean (s.e.m.).
Diagnosis codes from ICD-10.
Dissection and tissue processing
The gCC was dissected in the sagittal plane from selected cases (Fig. 1), 10% formalin (4% formaldehyde v/v), and the fornix dissected in the coronal plane, and stored in 10% formalin (4% formaldehyde v/v), before tissue processing. Blocks were processed using a Leica C300 tissue processor on a routine 12-h programme. Blocks were paraffin-embedded, sectioned at 10 μm thickness and mounted on 25 × 75 mm electrostatic glass slides. For each case, 3 × 10 μm slides at 100 μm intervals per region were used for staining. Cases were blinded by an independent investigator before measurement.
Illustration of neuroanatomy of study. Region A is the callosal genu from which measures were taken, enlarged below. Grey boxes in sagittal section of genu are the regions of measurement. Fornix measures were taken at the level of the vertical solid line, enlarged to the right showing the anatomy in the coronal plane.

Histological staining
One 10 μm section from each region was stained with haematoxylin and eosin (H&E). The sections were incubated in xylene for 15 min, then hydrated in 100%, 90%, 70% ethanol (EtOH) and distilled water (dH2O) for 2 min each. Sections were immersed in 50% Mayer's haematoxylin for 5 min before being rinsed in tap water (tH2O) and differentiated in 70% EtOH/1% hydrochloric acid (HCl) by immersing the sections for 3 × 1 s. Sections were incubated in 1% eosin for 5 min, rinsed in tH2O, dehydrated through serial alcohols, immersed in xylene and mounted using DPX.
Two 10 μm sections per region were stained with Luxol Fast Blue (LFB). These were de-waxed in xylene and immersed in two washes of 100% EtOH for 2 min each time. Sections were immersed in 1% LFB/methanol solution overnight in a 60 °C oven. Sections were rehydrated in 100%, 90%, 70% EtOH and rinsed in tH2O until water ran colourless. Sections were differentiated in saturated lithium carbonate solution, dehydrated through serial alcohols, immersed in xylene and mounted using DPX.
All cases were blinded by an independent investigator before image capture and measurement.
Image capture
Sections stained with H&E were used for neuroanatomical guidance, adjacent LFB-stained slides were used for axonal measures. All assay and measurement images were captured at 2096 × 1536 resolution using an Olympus Vanox AHBT 3 micropscope with Q Imaging Micropublisher RTV 3.3 camera and analysed using Image-Pro Plus v. 5.1 software (Media Cybernetics, USA). Density measurements were taken at x400 total magnification, while axonal architecture measures were taken at x1000 under oil immersion.
Measurement assays
The novel nature of these measurements required the assessment of the best manner in which to measure the variables considered in this study. This type of method has been used elsewhere for similar measures in rat spinal cord (Meyer et al. Reference Meyer, Velasco and Gopi2008), although these techniques are more precise and therefore required independent calibration before use. This optimization was done by means of four assays. Image capture was performed using Image-Pro Plus v. 5.1 software. Images were taken at x1000 magnification with oil immersion. Four randomly selected axons with complete myelin rings were used to optimize our technique for measuring the internal diameter of the axons as well as the width of the myelin rings of both regular and irregular axons.
Assay 1: determining the optimum number of myelin width and internal diameter measurements for each axonal fibre
The defined myelin ring was measured using software measurement tools which were used to trace along the inner and outer edges of the myelin ring. A grid mask of multiple symmetrical measurement arms was placed over the axon (Fig. 2). The number of these arms was varied from two to 20, with successive measures made and the mean and s.e.m. calculated. It was found that s.e.m. continued to decrease up to the maximum limit, albeit the rate of error decrease was itself decreasing, therefore a 20-armed measurement mask was used for the axon architecture measures as this was the maximum number that could be accurately assessed.
An axon with a 20-armed asterisk superimposed over it. Measures were made along the axes created by the asterisk.

Assay 2: determining measurement method for irregular axons
This was done following the measures from assay 1, where additional width measures were taken perpendicular to the points at which the arms intersected the inner edge of the ring at all 20 intersection points (Fig. 3). As axons are not perfectly circular some measures in assay 1 were taken at a tangent to the inner myelin ring. Making two types of measures enabled us to compare the measurement sets to determine the more accurate method for thickness measures of the myelin sheath in irregular axons. Twenty measurements were taken for myelin width and 10 for internal diameter per axon using both the tangential and perpendicular methods, with running means and s.e.m.s calculated.
(a) An axon with the 20-armed asterisk superimposed over it used to determine the optimum number of measurements for the internal diameter and the myelin thickness. (b) The same axon with lines showing how the myelin measures were actually taken perpendicular to the inner ring so as to obtain the most accurate values for myelin thickness. Internal diameter measures did not change.

Assay 3: determining unbiased selection method of axons
Images were taken of a test sample of tissue from the fornix at 1000x magnification. All axons within the boundaries of the image were numbered and a random number generator (http://www.graphpad.com; Graphpad Software, USA) used to select axons. Three images were taken of each sample, the first from the centre of the stained region, and samples from immediately above and below, counting in each region to avoid bias due to clustering (Fig. 1). A circular measurement mask was placed over the centre of each of these three areas for axon counting.
Assay 4: determination of measurement area for density measures
Measurement regions were mathematically centred on the exact centre of the sampling region to prevent operator bias. On a randomly selected axon at x400 magnification a circular measurement region was defined, the smallest at 50 μm radius and increased in 50 μm radius increments to 250 μm. Multiple measures within each of these regions were taken at different times and the consistency of axon number counted and compared for intra-operator error. Error was found not to decrease above 200 μm measurement radius, which was then used as the region size for density measures.
Microscopy
LFB-stained sections from the genu and fornix were used for all measures with H&E sections as an anatomical guide. Images for axon measures were all taken with oil immersion at 1000x magnification. Three images per slide were taken under the criterion that they contain more than three axons so that enough measures could be obtained. Axons had to exhibit clearly defined myelin rings that were darker than both the inside of the axon and the surroundings so that they could be traced accurately and without difficulty. A total of eight axons were measured from each LFB slide, giving a total of 16 axons measured per region per case. This number has been determined previously to be the optimum number of neuroarchitectural measures to make for maximum efficiency (Williams et al. Reference Williams, Pearce, Hirsch, Ansorge, Thom and Maier2006, Reference Williams, Marsh, Jain, Macdonald, Pearce, Hirsch, Gentleman, Ansorge and Maier2013).
Images were taken at x400 magnification from the exact centre of the two LFB slides per region per case for density measures.
Measures
All visible transverse axons in each image were tagged and then randomly chosen by a random number generator. Across the three sampled regions from each slide a total of eight axons were measured for myelin thickness and internal axon diameter as described by the assays protocol.
Cross-sectional area (CSA) measures of internal axon diameter and myelin area were measured on static images taken at x1000 as described above. Area was calculated by appropriate calibration of the image to the magnification, and by tracing along the inner and outer edges of the sheath the area of the myelin ring. The calibrated computer software gave CSA in μm2.
The centre of these images had a circular mask of radius imposed over the image. Once fixed, contrast was sometimes used to increase clarity of image for counting. All myelinated axons within the 200 μm radius measurement area were counted.
Data analysis
Slides were unblinded after all measures had been collected and data collected between different slides for the same region and case was merged for analysis. All statistical analyses were performed using Windows SPSS v. 16.0 (SPSS Inc., USA). The four measures of mean myelin thickness, myelin CSA, mean axon thickness and axon CSA were examined independently in the gCC and fornix. Each of the measures was analysed using univariate analysis with general linear model (GLM).
The primary comparison was changes between diagnostic groups, with diagnosis along with sex and age examined in the GLM as interacting variables. Additionally, in each analysis using the GLM potential confounders such as fixation period, incidence of suicide and PMI were examined as confounding variables. As a secondary analysis following significant findings direct tests between single groups were performed using t tests.
Ethics
This project was conducted under ethical permission granted by the London South West local ethics committee reference WL/02/12 (2002), and amendment WL/02/12/AM01, granted by the Ealing and WLMHT local research ethics committee (2006).
Results
The SZ group was significantly older than the MDD group (p = 0.012), and in formalin for a longer period (p = 0.021, see Table 2). There was a significant interaction in GLM analysis between age and myelin CSA (p = 0.038), although regression analysis showed no direct relationship between age and myelin CSA in the gCC (p = 0.880, r 2 = 0.00052) or the fornix (p = 0.896, r 2 = 0.000389). There was no significant effect of age, PMI or formalin-fixation period interacting with any other confounding variable or upon myelin thickness, internal axonal diameter or axon density in the genu or fornix. There was no effect of the incidence of antipsychotic treatment (p = 0.533) or chlorpromazine-equivalent units with presented results (p = 0.895), and no effect of antidepressant treatment (p = 0.440).
The incidence of suicide is unevenly distributed between the groups (controls n = 0, SZ n = 2 confirmed, it was unclear whether drowning in case 29 was accidental, MDD n = 9). Within the groups there was no interaction of suicide on the measurements (SZ, p = 0.473; MDD, p = 0.625).
MDD brains showed significantly larger myelin CSA (controls: 11.0 ± 0.9 μm2, MDD: 14.0 ± 0.9 μm2, df8,46, 27% increase, p = 0.017; F crit 8,46 = 2.15, F obtained = 3.67; Fig. 4) and myelin thickness (controls: 0.85 ± 0.02 μm2, MDD: 0.97 ± 0.03 μm2, df8,46, 14% increase, p = 0.004; F crit 8,46 = 2.15, F obtained = 31.63; Fig. 5) in the gCC compared to SZ and control groups. There was a trend towards increased axonal internal CSA in MDD (controls: 9.1 ± 1.7 μm2, MDD: 10.10 ± 1.0 μm2, df8,46, 11% increase, p = 0.061; F crit 8,46 = 2.15, F obtained = 1.11; Fig. 6), and a trend towards internal axonal diameter (df8,46, p = 0.061; F crit 8,46 = 2.15, F obtained = 5.07; Fig. 7). There was no significant change in the density of myelinated axons between diagnostic groups in the gCC (p = 0.473).
Graph of genu of the corpus callosum myelin cross-sectional area. * p < 0.05 (control: 11.0 ± 0.9 μm2, MDD: 14.0 ± 0.9 μm2, 27% increase, p = 0.017). SZ, Schizophrenia; MDD, major depressive disorder.

Graph of genu of the corpus callosum myelin thickness. *** p < 0.01 (control: 0.85 ± 0.02 μm2, MDD: 0.97 ± 0.03 μm2, 14% increase, p = 0.004). SZ, Schizophrenia; MDD, major depressive disorder.

Graph of genu of the corpus callosum axon internal cross-sectional area. † p < 0.1 (control: 9.1 ± 1.7 μm2, MDD: 10.10 ± 1.0 μm2, 11% increase, p = 0.061). SZ, Schizophrenia; MDD, major depressive disorder.

Graph of genu of the corpus callosum axon internal diameter (p = 0.153). SZ, Schizophrenia; MDD, major depressive disorder.

There was no change in the fornix in MDD between diagnostic groups in myelin CSA (p = 0.903), myelin thickness (p = 0.902), internal axonal CSA (p = 0.883), internal axonal diameter (p = 0.775) or axon density (p = 0.687).
There was no change in the gCC or fornix in SZ between diagnostic groups in myelin CSA (gCC: p = 0.672; fornix: p = 0.291), myelin thickness (gCC: p = 0.445; fornix: p = 0.884), internal axonal CSA (gCC: p = 0.273; fornix: p = 0.316), internal axonal diameter (gCC: p = 0.654; fornix: p = 0.670) or in axon density (gCC: p = 0.806; fornix: p = 0.425).
Discussion
The results demonstrate a significant increase in the myelin thickness of gCC axons in MDD, but no change was observed in the density of these axons. No differences were found in the fornix of MDD, or in either region in SZ.
Methodology
The differences in the two groups in age, and PMI, fixation, although significant, were very small. The significance comes from the very tight selection of cases within these groups (SZ group mean age was only 3.3 years older than MDD group, Table 2). The SZ group was also in formalin fixation for longer than the MDD group, although this had no effect on the results. Previous studies on these disorders from the Corsellis collection have shown formalin fixation period does not affect neuropathological markers using histological staining (Williams et al. Reference Williams, Hampton, Pearce, Hirsch, Ansorge, Thom and Maier2012, Reference Williams, Marsh, Jain, Macdonald, Pearce, Hirsch, Gentleman, Ansorge and Maier2013). The lack of differences between the control and SZ groups in any measurement, and the lack of significant interaction between confounding factors and results, also suggests that any SZ and MDD difference is real and not an artefact of group variability.
It has been found that the nodes of Ranvier and the internodal sections of the axon increase in length in proportion to the diameter of the axon. In the CNS axon diameter varies from 0.2–20 μm and the myelin sheath is interrupted every 1–2 mm by a node of Ranvier ~2 μm in length (Kandel, Reference Kandel, Kandel, Schwartz and Jessel2000). Our sections of 10 μm, 100 μm apart, would not be affected by the size and distribution of the nodes. Increasing numbers of measurements of either myelin width or internal diameter past the optimum did not enhance the accuracy of the results. By measuring on two slides 100 μm apart we negate any interacting effect of nodes.
When quantifying the width of myelin of irregular axons, the most precise data were obtained by measuring the width perpendicular to the intersection points. The lines provided by the asterisk were too long in many cases as they traversed the sheath at very shallow angles and therefore did not reflect the sheath width accurately. The use of a grid mask facilitated the unbiased selection of fixed points at which the width measurements were obtained, even when looking at irregular axons (Fig. 3).
Biological significance
The results presented suggest changes in hemispheric connection via the gCC between the frontal lobes in MDD. The biological effect of this is difficult to analyse. The larger axons and thicker myelin indicate that this may be slower in SZ and controls than in MDD in the genu, as healthy myelin coating of nerve axons is related to signal transmission speed (reviewed in Waxman et al. Reference Waxman, Kocsis and Stys1995). However, as axons carry inhibitory signals as well as excitatory ones, this effect may not be clinically obvious. Evidence from connectivity studies by fMRI studies suggest greater connectivity between regions of the frontal lobe in transmission of pain and between frontal lobe and subcortical structures in MDD (Heller et al. Reference Heller, Johnstone, Light, Peterson, Kolden, Kalin and Davidson2013; Strigo et al. Reference Strigo, Matthews and Simmons2013). While these increased levels of connectivity are observed in detailed studies, it is possible that the dominant negative symptoms of MDD mask clinical indications of greater inter-hemispheric connectivity. The right hemisphere is believed to control negative aspects of emotion and the left hemisphere the positive (Sackheim et al. Reference Sackheim, Greenberg, Weiman, Gur, Hungerbuhler and Geschwind1982). It may be that thicker myelin in the genu of MDD facilitates faster communication between the two hemispheres thereby enabling the depressive features to override the positive emotions, consistent with the emotional lateralization model of depression (reviewed in Bourne & Vladeanu, Reference Bourne and Vladeanu2013).
While myelin thickness is determined by oligodendrocyte function, it is unclear if this is the cause of the changes reported here. Decreases in myelin- and oligodendrocyte-gene expression have been reported in MDD (Aston et al. Reference Aston, Jiang and Sokolov2005; Sokolov, Reference Sokolov2007; Barley et al. Reference Barley, Dracheva and Byne2009), but functional gene network modelling has suggested that this may not indicate large-scale disruption of the gene networks, and hence physiological function, as many changes may be to compensate for other as yet undiscovered alterations (Gaiteri & Sibille, Reference Gaiteri and Sibille2011). These reported changes may compensate for one other and it is unclear if disruption in a network directly relates to decreased physiological output. It is entirely possible that examination of these gene networks by mRNA methods alone without better understanding of protein synthesis, glial cell function and mechanisms is providing an inaccurate picture of myelin synthesis in these illnesses. As similar gene expression changes have been reported in bipolar disorder (reviewed in Sokolov, Reference Sokolov2007) it would be useful to examine this in future studies to contrast both the SZ and MDD findings. Examination of callosal oligodendrocyte density has shown no change in the callosum in either SZ or MDD (Segal et al. Reference Segal, Schmitz and Hof2009; Williams et al. Reference Williams, Hampton, Pearce, Hirsch, Ansorge, Thom and Maier2012). However, studies have shown a reduction in glial density, specifically oligodendrocytes, in the PFC in SZ and MDD compared to controls (Uranova et al. Reference Uranova, Orlovskaya, Vikhreva, Zimina, Kolomeets, Vostrikov and Rachmanova2001, Reference Uranova, Vostrikov, Orlovskaya and Rachmanova2004; Cotter et al. Reference Cotter, Mackay, Beasley, Everall and Landau2002; Vostrikov et al. Reference Vostrikov, Uranova and Orlovskaya2007). PFC neurons traverse the cerebrum via the gCC so this may explain why this study found increased myelin CSA and thickness in the gCC of MDD cases, although it adds complexity as to why there was no observed changes in the axons of SZ cases.
Future work
Further studies of the neuroarchitecture of SZ and MDD axons could examine the diameters, widths and areas of myelinated axons in other regions of the CC. A thorough investigation of splenium axons is necessary as changes in FA have been noted in this structure (Foong et al. Reference Foong, Maier, Clark, Barker, Miller and Ron2000). Replication of this study may help understand why the control cases did not have significantly more myelin than SZ in either region examined. It may be of interest to study the unmyelinated axons of the CC and fornix too, using antibodies against neurofilament to carry out immunofluorescence on these structures. The relative numbers of both types of axons in SZ, MDD and control patients may also be significant as perhaps loss of one type is more pronounced than the other.
Acknowledgements
The authors thank Professor Bishan Radotra for neuropathological advice and Dr Claire Macdonald for assistance with the optimization of histological staining. Thanks are also due to Dr Rabiah Chaudhry and Dr Rachel March for help with dissection. The tissue was obtained from the Corsellis collection in 2008, which is supported by the Starr Foundation and the research supported by funding from the MRC-UK PET Methodology Programme, Grant G1100809/1.
Declaration of Interest
None.