Influenza vaccination of healthcare personnel (HCP) reduces HCP illness and lost work days. Reference Salgado, Farr, Hall and Hayden1–Reference Bridges, Thompson and Meltzer3 Data from long-term care facilities suggest that influenza vaccination of HCP may also improve patient outcomes. Reference Ahmed, Lindley, Allred, Weinbaum and Grohskopf4,Reference Talbot, Babcock and Caplan5 The Advisory Committee on Immunization Practices (ACIP), Reference Fiore, Uyeki and Broder6 Society for Healthcare Epidemiology of America (SHEA), 7 and the Infectious Diseases Society of America (IDSA), 8 among others, recommend influenza vaccination for all HCP.
Vaccine hesitancy is defined by World Health Organization (WHO) SAGE Working Group on Vaccine Hesitancy as a delay in acceptance or refusal of vaccination despite availability of vaccination services. Reference MacDonald9 Hesitancy varies over time, and occurs on a spectrum with some people occasionally requesting exemption from vaccination and others requesting exemption consistently. Reference MacDonald9 The time-dependent spectrum of hesitancy is difficult to measure, but researchers have acknowledged variation in annual influenza vaccine acceptance and have found that acceptance in the past at some point is associated with future acceptance. Reference Hakim, Gaur and McCullers10,Reference Bautista, Vila, Uso, Tellez and Zanon11 However, understanding of the full spectrum of hesitancy over time and its relation to future acceptance and response to interventions are limited.
The WHO SAGE Working Group recommends that vaccination programs be tailored to local needs, and institutions have implemented a variety of policies. Influenza vaccination as a condition of employment has been shown to be more effective for increasing vaccination rates than voluntary influenza vaccination for HCP Reference Black, Yue and Ball12–Reference Babcock, Gemeinhart, Jones, Dunagan and Woeltje14 and strong leadership support is essential. Although mandatory vaccination may be the most effective method of assuring vaccine acceptance, Reference Rebmann, Wright, Anthony, Knaup and Peters15,Reference Wiwanitkit16 it is not appropriate in all settings. Reference Lugo17–Reference Edmond19 Methods for allowing exemptions in the setting of mandatory vaccination may include requiring a signed exemption form without review of an individual’s reasons for exemption or mandating a written application for exemption with critical appraisal of the request. Reference Rakita, Hagar, Crome and Lammert13,Reference Ribner, Hall and Steinberg20–Reference Boone, Johnson, Rolando and Talbot23 Few publications have characterized how critical appraisal of exemption requests affects overall vaccine acceptance in comparison to mandatory exemption policies that do not require critical appraisal.
Herein, we assess the effect on overall acceptance of an intervention requiring critical appraisal of vaccine exemption requests. Prior to the intervention, the institution had required vaccination and accepted annual signed exemption forms and recorded the reasons for their exemption request but did not critically review these exemption forms. With the record of annual exemption reasons, we determined the number of times that individuals changed vaccine exemption reasons over time and those who changed their exemption status; these HCP were termed “inconsistent exempters.” With these data, we assessed whether an intervention critically appraising influenza vaccine exemption requests from HCP affected (1) the institutional rate of influenza vaccine exemption and/or (2) the rate of exemption of “inconsistent exempters” compared to “consistent exempters.”
Methods
Study design
This study was a retrospective, before-and-after analysis of a policy change designed to increase accountability to a healthcare personnel vaccination mandate at a single academic medical center. We analyzed compliance with and exemption from annual influenza vaccination at the University of Virginia Medical Center (UVAMC) between January 1, 2010, and January 1, 2020. The period before the policy change is termed the preintervention period, and ranged from January 1, 2010, to January 1, 2019, when the policy change was enacted. The period after the policy change is termed the postintervention period and continued through January 1, 2020, the deadline for compliance of existing employees under the new policy for the 2019–2020 season. The Institutional Review Board at the University of Virginia (UVA) reviewed the study and considered it a program evaluation study.
Preintervention exemption process
Prior to January 1, 2019, HCP requesting exemption from seasonal influenza vaccination were required to submit exemption forms annually. The form was prepopulated with a series of potential reasons for exemption: (1) severe allergy to a component of the influenza vaccine; (2) anaphylactic reaction or severe adverse event following influenza vaccination in the past; (3) Guillain-Barre-like syndrome within 6 weeks of receiving influenza vaccine; (4) another medical contraindication to influenza vaccine; or (5) religious belief.
The HCP submitting the form would select a reason for exemption and attest to accuracy. Prior to 2016, only reason 4 required a letter from a physician. After 2016, any reported medical reason (reasons 1–4) required a letter from a physician.
During the preintervention period, HCP forms and provider support letters were not critically appraised to determine whether they satisfied CDC criteria for contraindications to influenza vaccination or to determine sincerity of religious beliefs. HCP were required to complete the form annually with potential consequence of termination for noncompliance; however, the enforcement process was not defined and no employees were terminated for vaccine noncompliance before the intervention.
Postintervention exemption process
A multistakeholder workgroup with members from the infectious diseases, occupational health, hospital epidemiology, student health, human resources departments, and others, developed the new vaccination requirement policy. The postintervention period began January 1, 2019, and it affected the 2019–2020 influenza season. HCP requesting a medical exemption were required to submit documentation from a physician or nurse practitioner documenting a contraindication consistent with CDC criteria. HCP requesting a religious exemption were required to express in writing a sincerely held religious belief prohibiting vaccination. Requests were uploaded to an electronic management system accessible to the work group. The work group evaluated medical exemption requests based on CDC-recommended contraindications to influenza vaccination. A human resources (HR)–focused committee, including legal counsel and ethical experts, developed an internal process for evaluating religious exemption requests to determine whether they expressed sincerely held religious beliefs prohibiting vaccination. Before and after evaluation, HCP could upload additional information, correspond with the work group, and submit appeals up to the vaccine deadline. Enforcement of the policy was performed by HR staff with a consequence of disciplinary action up to and including termination for noncompliance. Emphasis was placed on equitable application of the policy to all team members.
Three employees were terminated due to the policy and were not included in the analysis of exemptions. The total number of employees that ended employment due to the policy, both as a result of termination or resignation, is not determinable from the data available to the authors.
Comparison of preintervention to postintervention
In the single-year postintervention period, we assessed the following outcomes: the institutional rate of influenza vaccine exemption and the postintervention changes in individual exemption among consistent exempters and inconsistent exempters. To assess population-level acceptance and exemption rates within the institution, all preintervention years were included in the comparison unless stated. To assess individual changes in vaccine acceptance or exemption before and after the policy was implemented, exemption of the individual in the year before the policy change was compared to exemption in the year after the policy change. This approach allowed assessment of individual choices while accounting for each individual’s history of exemption changes (described below).
Assessment of HCP history of exemption changes
We sought to determine how the intervention affected those with a history of inconsistent exemption (termed “inconsistent exempters”) compared with those with a history of consistent exemption (termed “consistent exempters”). To assess the historical inconsistency of individual HCP, we analyzed exemption reasons (items 1–5) selected by HCP prior to the intervention. We considered that the self-selected exemption reasons 1 and 2 (allergy and anaphylaxis) may be conflated by some HCP and thus analyzed reasons 1 and 2 as a single reason. We categorized reasons 1–4 as medical exemption reason categories, and we categorized reason 5 as a religious exemption.
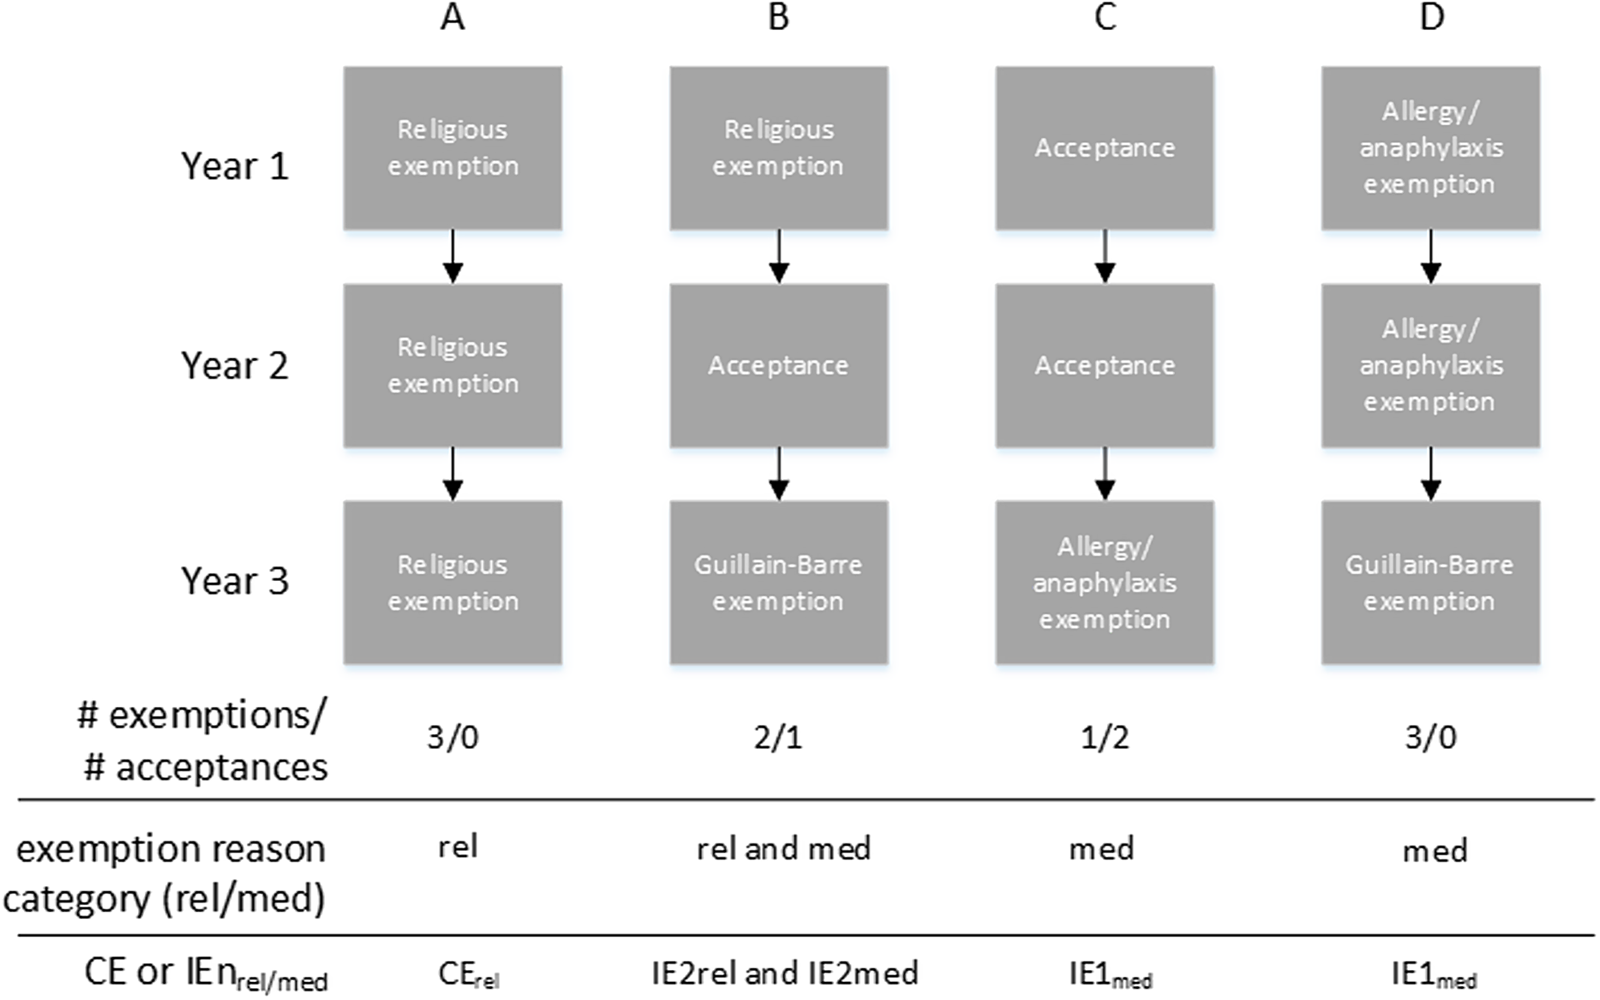
Based on these reasons for exemption, year-to-year changes in exemption reasons and acceptance were assessed among the population to determine the history of each HCP changing exemptions. The number of changes year-to-year were assessed for all HCP throughout the study period. HCP were eligible for being termed either consistent exempters or inconsistent exempters if, in the period before the intervention, they had been employed for ≥3 years and had requested exemption at least once. Among these HCP, those who requested exemption at least once but who neither changed exemption reasons nor accepted vaccination were termed consistent exempters. Those who changed reasons or both requested exemption and accepted vaccination during employment were termed inconsistent exempters. See Figure 1 for a detailed description of consistent exempters and inconsistent exempters.
Methods and examples of determining consistent exempters (CE) and inconsistent exempters (IE). All HCP (N = 29,663) were assessed for year-to-year changes in exemption reasons (see Methods); in addition, change from vaccine acceptance to exemption, or vice versa, was counted as an exemption reason change. HCP were eligible for being designated either consistent exempters or inconsistent exempters if, during the period before the intervention, they had been employed for ≥ 3 years (N = 16,325) and exempted at least once (N = 1,177). Within this group, consistent exempters = zero changes in exemption reason and inconsistent exempters > 0 changes in exemption reason. The number of changes was denoted by “n” after the designation of IE. To denote “n or more” changes, “n+” was used. “IE” is a collective term equivalent in meaning to IE1+ and refers to those IE with 1 or more changes in exemption reason, that is, all those who are inconsistent exempters. IE1+ is used when reporting data values. Exemption reason category included both medical (med subscript) and religious (rel subscript). Examples shown in the figure: (A) Exempted without changing reason each of 3 years, each exemption reason was in the religious category = CErel. (B) Exempted with 2 changes in reason, one reason was in the religious category and the other was in the medical category = IE2rel and IE2med. C) Exempted with 1 change in reason, the exemption was on the medical category = IE1med. D) Exempted with 1 change in reason, all the reasons were in the medical category = IE1med.
Data collection and analysis
Data were collected in the UVAMC Employee Health database (AgilityOM, Net Health, Pittsburgh Pennsylvania). Data were analyzed using SAS version 9.4 software (SAS Institute, Cary, NC). For categorical data, Pearson χ2 was used. P values ≤.05 were considered significant.
Results
Study population characteristics
In total, 29,663 HCP complied with influenza vaccination efforts, and 119,095 vaccination encounters were recorded over the study period, with mean annual encounters of 11,667 (±1792 SD) and a mean of 4 encounters for influenza vaccination per HCP during the study period. The most common job title of an HCP requesting exemption was clinical nurse (22.6%), followed by administrative positions (17.8%) (Table 1). In total, 1,640 HCP (5.5%) requested exemption from influenza vaccination at least once during the study period.
Characteristics of Healthcare Personnel (HCP) Within the Study Period a

Note. CE, consistent exempter; CErel, CE for religious reason; CEmed, CE for medical reason; IE1, inconsistent exempter with 1 change in reason; IE1+, IE with ≥1 change in reason; IE2 IE with 2 changes in reason; IE2+ IE with ≥2 changes in reason.
a All HCP were included in the table, regardless of duration of individual employment.
b Due to the extent and specificity of job titles as annotated in the employee health database, only selected job titles are included here.
HCP history of exemption changes
One objective of the study was to determine how the intervention affected those with a history of inconsistent exemption compared with those with a history of consistent exemption. To evaluate this, we developed a system for characterizing inconsistent exempters, and consistent exempters (Fig. 1 and Methods section). We found that 329 (28.0%) of 1,177 HCP requesting exemption were consistent exempters and 848 (72.0%) of these 1,177 were inconsistent exempters who made 1 or more changes in their reason for exemption (ie, termed EI1+). Among IE1+, the mean number of exemptions was 2.5. Religious exemption was granted at least once during employment for 67.8% of consistent exempters and for 68.0% of IE1+ (Fig. 2). Medical exemption was granted at least once during employment for 32.2% of consistent exempters and for 32.9% of IE1+. Only 1.0% of IE1 and 1.2% of IE2+ (ie, those inconsistent exempters who changed their reason for requesting exemption 2 or more times) requested exemptions for both medical and religious reason categories over time indicating that changes from medical to religious or vice versa were rare. In sum, consistent exempters or inconsistent exempters were not meaningfully associated with religious or medical exemption, although religious exemptions were more common than medical in the preintervention period.
Percent HCP who submitted exemptions within specified exemption reason categories among consistent exempters and IE. X-axis: Exemption changes denoted by consistent exempters and inconsistent exempters (see Methods and Fig. 1 for determining CE and IE). Y-axis: Percent HCP in the preintervention period with acceptance or exemption reason category specified by the bars indicated in the key. HCP were included in analysis if they had at least 1 exemption and were employed for 3 or more years in the preintervention period.
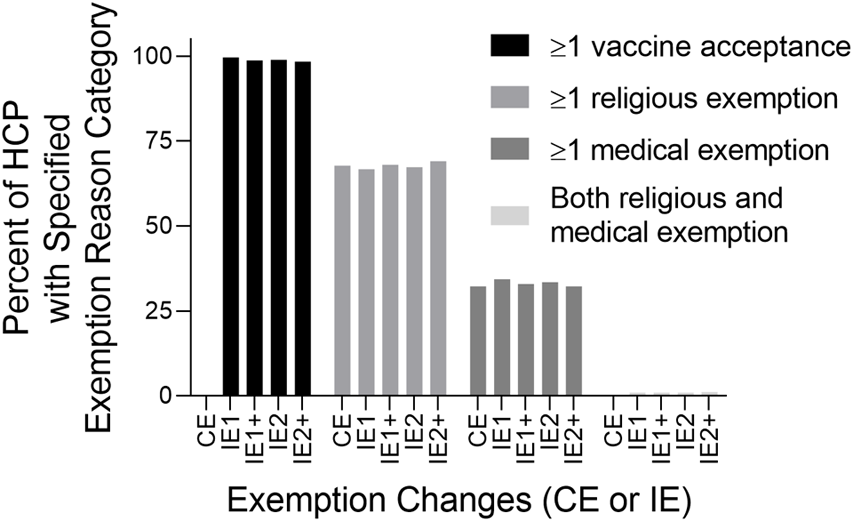
Most inconsistent exempters had received the vaccine at some point during employment in the preintervention period, with 98.7% of IE1+, and 98.4% of IE2+ accepting vaccination at least once during their work history (Fig. 2). Among those with at least 3 years employment who had ever submitted a religious exemption request and were employed throughout the study, 298 (72.5%) of 411 accepted at least 1 vaccine in their history after their index religious exemption. Similarly, among those who had ever submitted a medical exemption and were employed throughout the study, 144 (70.2%) of 205 subsequently accepted at least 1 vaccine in their history after their index medical exemption. Thus, since most received vaccination after exemption, their exemptions were likely not attributable to a contraindication such as a severe allergy that would preclude future vaccination.
Comparison of preintervention to postintervention exemption
In the postintervention year (2019–2020 season), among all HCP, influenza vaccine exemption requests decreased to 1.2% compared to a mean 3.8% in the 9-year preintervention period (2010–2019 seasons), a 68% decrease in exemption requests (P < .001). We asked whether the intervention was associated with increased odds of acceptance in the 2019–2020 season (N = 13,975), compared to the preintervention 2018–2019 season (N = 13,709), controlling for years of employment. The odds of acceptance in the 2019–2020 flu season were 2.9 times that of the 2018–2019 flu season (95% CI, 2.4–3.5; P < .001). Likewise, the greatest number of HCP changed from exemption to acceptance in the postintervention year compared with any of the prior years included in the study (Fig. 3).
Increase in HCP change from exemption to acceptance before and after the policy. Individual HCP decisions for exemption (e) or acceptance (a) in a given year were compared to the prior year to determine whether a given HCP changed from exemption to acceptance (e→a, black bar) or acceptance to exemption (a→e, gray bar). In addition, the acceptance to exemption ratio (a/e ratio) is shown on the right axis as a line graph (•) and text above each set of bars. To determine this ratio, first, the % of HCP a→e and the % HCP e→a were calculated (e.g. [number of HCP e→a]/[total population of HCP during 2-year span of comparison]). The a/e ratio of change was calculated for the population each year (ratio=[% exhibiting e→a]/[% exhibiting a→e]). Note that the first year of the study is not included because there was no comparator year before that.

We next asked whether the rates of postintervention vaccine acceptance increased among consistent exempters and inconsistent exempters. We examined those who had been employed for 3 years before the intervention (N = 16,325) and were present in both the year 2018–2019 before the intervention and the year 2019–2020 after the intervention (N = 9,420), and had requested an exemption at least once (N = 695). We determined the percentage of these individuals who changed exemption status in the postintervention year compared with the preintervention year. Of IE1+ employed after the intervention, 442 (88.9%) of 497 accepted vaccine after the intervention compared with 118 (59.6%) of 198 of consistent exempters (P < .001). Of all HCP who requested exemption at least once before the intervention (ie, both consistent exempters and IE1+) and then accepted vaccination after the intervention, 442 (78.9%) of 560 were IE1+. Thus, change to vaccine acceptance after the intervention was driven by those inconsistently requesting exemptions.
We further assessed whether the population of preintervention exemption requesters who continued to request exemption after the intervention chose medical or religious reasons for exemption. Among IE1+, only 55 (11.1%) of 497 continued to request exemption, with 5.6% requesting exemption for medical reasons and 5.4% requesting exemption for religious reasons (Table 2). Among consistent exemption requesters who chose a medical reason for exemption at least once (CEmed), 33 (54.1%) 61 accepted vaccine after the intervention (Table 2). Of the 28 (45.9%) that continued to request exemption after the intervention, 100% continued to request exemption for medical reasons. Among consistent exempters who requested exemption for religious reasons (CErel), 85 (62.0%) of 137 accepted vaccination after the intervention. Interestingly, among CErel who continued to request exemption after the intervention, 10 changed their reason for exemption to medical after the intervention; therefore, 95 (69.3%) of 137 CErel either accepted vaccination or changed categories after the intervention.
Association of Preintervention Exemption Change With Postintervention Acceptance of Vaccination a

Note. CE, consistent exempter; CErel, CE for religious reason; CEmed, CE for medical reason; IE1, inconsistent exempter with 1 change in reason; IE1+, IE with ≥1 change in reason; IE2 IE with 2 changes in reason; IE2+ IE with ≥2 changes in reason; HCP, healthcare personnel.
a HCP were included in analysis if they had at least 1 exemption, were employed for ≥3 years in the preintervention period and were also employed for the postintervention period. Shown is percent of individuals that changed exemption in the postintervention year compared with the preintervention year.
Discussion
Implementation of the described vaccination policy was associated with a decrease in exemption rate from mean of 3.8% before the intervention to a mean of 1.2% after the intervention. Acceptance in the postintervention year was higher than in any year other during the 10-year study, and conversion from exemption to acceptance was greatest in that year as well (Fig. 3).
The preintervention rate of exemption was likely low because of existing education of HCP, easy access to free vaccine, and leadership endorsement. These are all recommended components of an influenza vaccination program. 24 At our institution, even though an added requirement for medical notes for all medical exemptions was put in place in 2016, critical review was not performed and there was no appreciable increase in acceptance beyond the already high rate (Fig. 3 and data not shown). Nonetheless, the study intervention did increase the acceptance rate, likely due to addition of critical appraisals and better-defined enforcement.
Vaccine hesitancy is defined as delay in acceptance or refusal of vaccines despite the availability of vaccination services. Reference Thomson, Robinson and Vallée-Tourangeau26 Multiple models exist for addressing vaccine hesitancy and acceptance. One is the “5As” model which includes access, affordability, awareness, acceptance, and activation. The first 4 of these 5 factors was addressed before the intervention, and the intervention of critical appraisal and better-defined enforcement addressed the fifth factor, activation, which is the degree to which individuals are nudged toward vaccination uptake. Reference Thomson, Robinson and Vallée-Tourangeau26
Measurement of inconsistent exemption from annual vaccination is a quantitative surrogate marker of hesitancy. Hesitancy is generally measured by questionnaires. Although hesitancy exists on a spectrum, it is difficult to objectively measure. Reference Oduwole, Pienaar, Mahomed and Wiysonge27,Reference Dyda, King, Dey, Leask and Dunn28 Prior acceptance of vaccine has been associated in other studies with subsequent acceptance of vaccine Reference Hakim, Gaur and McCullers10,Reference Bautista, Vila, Uso, Tellez and Zanon11 ; however, the frequency of exemption requests was not assessed to understand the spectrum of hesitancy. Consistent with the concept that inconsistent exemption reflects hesitancy, we found that the intervention resulted in vaccine acceptance more among HCP classified as inconsistent exempters than among those classified as consistent exempters. Inconsistent annual exemption is a novel method of objectively assessing the spectrum of hesitancy.
Our intervention was a mandate with allowance for exemptions. Although vaccination is safe, experts recommend that a trial of voluntary vaccination be attempted prior to mandating vaccination. Patient access, supply, education, and risk-based prioritization of the population to be vaccinated should all be thoughtfully considered prior to a mandate. Reference Mello, Silverman and Omer29,Reference Omer, Salmon, Orenstein, deHart and Halsey30 Without these pieces, public trust may erode, and the effect could spill over into mistrust of all vaccines, which occurred following the Cutter polio vaccination effort Reference Offit31 and the 1976 swine flu vaccination effort. Reference Sencer and Millar32 These legacies negatively influence vaccination efforts in the United States to this day. Reference Trogen, Oshinsky and Caplan33,Reference Gerber and Offit34 The intervention reported herein likely succeeded because the vaccine was safe and time tested, access was free and easy, the acceptance rate was high before the intervention, education was part of the program, and it was supported by leaders. If each piece of a program is not present, then mandating vaccination may not be appropriate. Reference Mello, Silverman and Omer29
The preintervention policy requiring submission of exemption forms with reasons but without critical appraisal, allowed for a novel analysis of vaccination exemption reasons over time. With these data, we have been able to determine not only the number of exemptions by an individual but also the number of changes in exemption reason. The intervention was associated with a reduction in religious exemptions relative to medical exemptions. Before the intervention, the percentages of exemptions were 69.5% religious exemptions and 30.5% medical exemptions. After the intervention, religious exemptions comprised 51.8% and medical exemptions comprised 48.2%. This finding is consistent with studies of state vaccination policies for which easy-to-overcome exemption policies are associated with a higher nonmedical exemption rate than difficult-to-overcome exemption policies. Reference Omer, Pan and Halsey35 Interestingly, 7.3% of those who requested exemptions for religious reasons changed their reason for exemption to a medical reason following mandate. This finding suggests that if an individual wants to be exempt from vaccination, it is possible to identify a provider who will attest to a medical contraindication, consistent with observations in California after eliminating religious exemption from vaccines. Reference Mohanty, Buttenheim, Joyce, Howa, Salmon and Omer36,Reference Delamater, Leslie and Yang37
This study had several limitations. It was conducted in a single institution. We used retrospective analysis. The number of exemptions in the population due to an effective preintervention policy was small. The small exemption number prevented useful multivariate analysis of individual choices. Bias may have resulted if HCP resigned from their positions rather than comply in the postintervention year. These HCP would not be accounted for in the retrospective, prepost analysis and may have introduced bias toward a finding of greater change to acceptance. That said, the ultimate goal of the policy was met; the overall vaccination rate among HCP increased. Because the postintervention period only included a single year, it is possible that the increased uptake will not be sustained. Generalizable observations resulted from the study, nonetheless, that inconsistent exempters were more likely to accept vaccination and that conversion from exemption to acceptance was substantially increased after this intervention (Fig. 3).
The described vaccination policy change may serve as an example of how an institution can achieve high rates of influenza vaccine compliance. The analysis of inconsistent annual exemption is a novel method of quantifying hesitancy. Future study will include an assessment of whether inconsistent influenza vaccine exemption predicts acceptance of noninfluenza vaccines such as SARS-CoV-2 vaccine.
Acknowledgments
Financial support
No financial support was provided relevant to this article.
Conflicts of interest
All authors report no conflicts of interest relevant to this article.