I. INTRODUCTION
Rare earth, as active ions, doped materials have been investigated as upconversion media for several years, but it is still holding a great challenging to find a suitable host material to be applied onto the photovoltaic (PV) device. Glass materials are preferred as a host material due to their stability and the capability of easy shaping for these PV devices into slips, lenses, and all other optical shapes.
Upconversion is difficult to generate in conventional oxide glasses due to their high phonon energies, corresponding to the stretching vibrations of the oxide glass's network former. However, oxide glasses have attractive properties, such as high chemical stability and ease of fabrication. Many oxide glasses have been studied intensively to find the suitable upconversion host material. The prepared glass with the molar composition (mol%) 30B2O3–30Bi2O3–20Li2O–10BaO–10Pb3O4 (B30·Bi30·Li20·Ba10·Pb10) is considered a stable glass with a wide range of transparency (450–2500 nm), high density (6.3 g/cm3). The long infrared cutoff edge indicated that the phonon energy of (B30·Bi30·Li20·Ba10·Pb10) glass is small compared to other conventional oxide glasses. This work is concerned with studying the physical properties of B30·Bi30·Li20·Ba10·Pb10 glass doped with rare earth, erbium ions.
Heavy metal oxide glasses (HMOs) like Pb2O3 and Bi2O3 doped with rare earth oxides (REOs) attract the researchers due to their significant technological applications. These glasses play an important role in the development of many optoelectronic devices such as lasers, sensors, hole burning high-density memories, and optical fibers. Reference Mekki, Ziq, Holland and McConville1–Reference Saddeek4 The HMOs can exist in the glass as a network modifier and as a network former depending on the type of bond between the cation and various counterpart oxides. In addition, lead–bismuth or lead borate glasses have been tested as matrix materials for developing new optical devices, and adding trivalent rare earth ions affects the local structure of the glass network. REO and HMO form new bonds with the surrounding ligands in the glass network that causes a variation in the structure of borate network ligands. The structure of borate glasses is not only a random distribution of BO3 triangle and BO4 tetrahedral, but also an aggregation of different concentrations of these units to form well defined and stable groups, such as diborate, triborate, tetraborate, etc., which constitute the random three-dimensional network. Reference Lavin, Babu, Jayasankar, Martin and Rodriguez5–Reference Kodama7 Aset et al. Reference Acet, Brennan, Cankurtaran, Saunders and Zähres8 studied the temperature dependences of the adiabatic elastic stiffness's C 11 and C 44 and related elastic properties in rare earth metaphosphate glasses. Sampaio et al. measured the elastic moduli for calcium aluminosilicate glasses with <10 mol% of SiO2 doped with Er2O3 and Yb2O3 and concluded that the addition of small amounts (<1.5 mol%) of Er2O3 or Yb2O3 may have induced a decrease <5% in the elastic modulus, consistent with the hypothesis that the rare earth ions act as network modifiers, disrupting the glass lattice. Reference Sampaio, Baesso, Gama, Coelho, Eiras and Santos9 Earlier, Kumar et al. investigated the elastic moduli and other parameters using ultrasound LiF–B2O3 glasses doped with certain rare earth ions. Reference Kumar and Veeraiah10 Honma et al. Reference Honma, Benino, Fujiwara, Sato and Komatsu11 examined electronic oxide polarizability of Bi2O3·B2O3 glasses and clarified that Bi–O bonds are largely ionic. They discovered new nonlinear optical crystalline phase [x 1RE2O3–x 2BiO3–(1 − x)BO3] in the crystallized glasses of RE2O3–Bi2O3–B2O3 (RE: La, Gd, Sm). Thermal and optical properties of glasses Bi2O3·B2O3 systems were studied by Becker Reference Becker12 and Ehrt. Reference Ehrt13 In addition, the optically transparent crystallized glasses Bi2O3·B2O3 containing rare earth ions or nanoregions of ferroelectric crystals have received much interest, because such materials have a potential for laser host, tunable waveguide and tunable fiber grating. Reference Ihara, Honma, Benino, Fujiwara and Komatsu14 The elastic moduli are important parameters which are used in fiber drawing, and it was reported with a view to drawing 20 Bi2O3·80B2O3·1RE2O3 in mol% (where, RE = Pr, Nd, Sm, Eu, Gd, and Er) as a waveguide optical glass. It has been pointed out that the structure of alkali borate glasses is strongly dependent upon the species of alkali ion. Infrared and Raman studies on alkali borate glasses by many researchers Reference Kamitsos, Karakassides and Chryssikos15–Reference Krogh-Moe18 have also shown that the ratio N 4 decreases and the number of nonbridging oxygens (NBOs) increases as the glass content is changed from Li to Cs with the same amount, and different kinds of borate groups are formed. Kodama et al. Reference Kodama7,Reference Kodama, Hirashima and Matsushita19 studied the anomalous behavior of ultrasonic velocity in cesium borate and rubidium borate glasses, they assumed these composite glasses to be composed of three structural units, and that the elastic property of these glasses has been analyzed in terms of the three structural units, N 4 has been calculated as a function of composition to calculate the change in the amount of each structural unit that causes the anomalous behavior of ultrasonic behavior.
Many researchers studied the dimensional parameters of the glass network, the d ratio and the conformable ratio (G/C 12) and the constants of elasticity in different types of glasses Reference Saddeek4,Reference El-Adawy and Moustafa20–Reference El-Mallawany24 were investigated and it was found that these parameters are in a correlation with the constant of elasticity of the glass.
Generally, the ultrasonic technique is one of the best methods to determine the constants of elasticity of such kinds of glasses and to compare these values with previous studies. Reference Makishima and Mackenzie25–Reference Inaba, Fujino and Morinaga31 Therefore, the goal of this paper is to complete the study that has been performed on the elastic properties of these glasses. From these studies, we can extract valuable information about the structure of the prepared glasses. Information about the structure of these glasses can be deduced after calculation of the elastic moduli, Debye temperature, Poisson's ratio, crosslink density, and the fractal bond connectivity.
II. EXPERIMENTAL PROCEDURES
Glass system of composition 30B2O3–30Bi2O3–20Li2O–10BaO–10Pb3O4–xEr2O3 (x-mol%) has been prepared by conventional melting and quenching method, where x = 0, 0.5, 1, 2, 3, and 4. The starting material is reagent grade H3BO3, (BiO)2CO3, Li2CO3, BaCO3, and Pb2O3.
About 25 g of the starting raw materials, with purity 99.99%, were preheated at 200–300 °C to get rid of undesired gasses, then the powder was mated at 950–1000 °C for 20–25 min in a porcelain crucible in the electric furnace in the air atmosphere. The melts were shaken during preparation to ensure homogeneity. The melt was poured into preheated molds at 250 °C. The prepared samples were subjected to annealing at 250 °C for several hours, then the furnace was left to cool to room temperature.
After preparation, the two opposite sides of the samples were polished to be suitable for the ultrasonic velocity measurements. The deviation in the parallelism of the two opposite side faces was about ±8 μm.
A. Glass characterization
X-ray diffraction (XRD) patterns of the prepared samples were recorded with a Philips x-ray diffractometer (Eindhoven, The Netherlands) using monochromatized Cu Kα1 radiation of wave length 1.54056 Å from a fixed source operated at 45 kV and 9 mA.
To determine the glass transition temperature of the prepared glass, differential scanning calorimetry (DSC) was used. The measurements were performed by thermal analyzer SDT Q600 V20.9 Build 20 (TA Instruments, New Castle, Delaware) in the temperature range 25–600 °C with heating rate 10 °C/min in a nitrogen atmosphere.
To study the structure units of the prepared samples, the FTIR absorption spectra were recorded by Jasco FTIR (Jasco Corporation, Tokyo, Japan) in the range 400–4000 cm−1 with a resolution of 1 cm−1 using the KBr pellet technique. The infrared spectra were corrected for the dark current noises and normalized to eliminate the concentration effect of the powder sample in the KBr disc.
The density (ρ) of the glass samples was measured by applying the Archimedes principle at 25 °C using toluene of density 0.868 g/cm3 as an immersion liquid and applying the relation:
 $$\rho = {\rho _{\rm{b}}}\left( {{{{W_{\rm{a}}}} \over {{W_{\rm{a}}} - {W_{\rm{b}}}}}} \right)\quad ,$$
where, ρb is the density of the toluene, W a and W b are the sample weights in the air and the toluene, respectively. The molar volume (V m) has been calculated as M/ρ, and M is the molecular mass of the samples.
The ultrasonic wave velocities longitudinal (U l) and shear (U s) at room temperature were measured using the pulse-echo method. In this method, x-cut transducer operated at fundamental frequency 4 and 2 MHz y-cut transducer (Krautkramer, Hurth, Germany) and a digital ultrasonic flaw detector (Krautkramer USIP 60) were used. The uncertainty in the measurement of the ultrasonic velocity is ±9.5 ms−1 for longitudinal wave velocity and ±3 ms−1 for shear wave velocity. The two velocities besides the density were utilized in determining two independent second-order elastic constants. The ultrasonic velocities and the density were used to determine the elastic moduli and Debye temperature (θD) of the glass system. The uncertainty in the elastic moduli ±0.12 GPa and ±0.006 for Poisson's ratio (σ).
The constants of elasticity such as longitudinal (L), shear (G), bulk (B), and the (C 12) modulus can be determined from the relations Reference Varshneya32,Reference Khalifa, El-Hadi, Moustafa and Hassan33 ;
 $$L = {C_{11}} = \rho \mathop {{U_{\rm{l}}}}\nolimits^2 \quad ,$$
 $$G = {C_{44}} = \rho \mathop {{U_{\rm{s}}}}\nolimits^2 \quad ,$$
 $$B = \left( {L - \left( {{4 \over 3}} \right)G} \right)\quad ,$$
 $${C_{12}} = \left( {{C_{11}} - 2{C_{44}}} \right) = \left( {L - 2G} \right)\quad .$$
Poisson's ratio (σ) is reported to provide more information about the character of the bonding forces than any of the other elastic coefficients. Reference Gao, Xue, Zhang, Sheng, Ji, Dai, Yu and Zeng34,Reference Seo, Kang, Shih and Lee35 Poisson's ratio (σ) is related to Young's modulus (E) and shear modulus (G) by the equation:
 $$\sigma = \left( {{{L - 2G} \over {2\left( {L - G} \right)}}} \right) = {E \over {2G}} - 1\quad ,$$
 $$\sigma = {{\left( {\mathop {{U_{\rm{l}}}}\nolimits^2 - 2\mathop {{U_{\rm{s}}}}\nolimits^2 } \right)} \over {2\left( {\mathop {{U_{\rm{l}}}}\nolimits^2 - \mathop {{U_{\rm{s}}}}\nolimits^2 } \right)}}\quad ,$$
 $$E = {{3\rho \mathop {{U_{\rm{s}}}}\nolimits^{\rm{2}} \left[ {\mathop {{U_{\rm{l}}}}\nolimits^{\rm{2}} - \left( {{3 \over 4}} \right)\mathop {{U_{\rm{s}}}}\nolimits^{\rm{2}} } \right]} \over {\left( {\mathop {{U_{\rm{l}}}}\nolimits^{\rm{2}} - \mathop {{U_{\rm{s}}}}\nolimits^{\rm{2}} } \right)}}\quad .$$
III. RESULTS AND DISCUSSION
A. X-ray studies
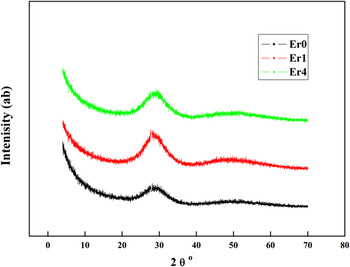
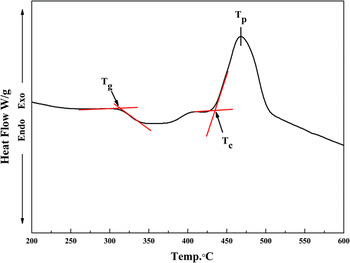
The XRD patterns of 3 sample powders (Er0, Er1, and Er4 mol%) depicted in Fig. 1 were found to show no discrete sharp peaks, but broad halo at around 26–30°, which reflected the amorphous nature of the prepared samples. This indicates the absence of long-range atomic arrangement and the periodicity of the three-dimensional network in the glassy materials. To confirm the glassy state of the prepared samples, DSC measurements were performed as shown in Fig. 2. The characteristic thermal temperatures such as the glass transition temperature, T g, the onset crystallization temperature T c, and the full crystallization peak T p were selected on the DSC curves to confirm the amorphous nature of the samples.
The XRD pattern of the prepared glasses doped with Er2O3 (0, 1, and 4 mol%).

T g, T c, and T p locations on DSC curve of the blank glass sample.

B. Infrared spectra
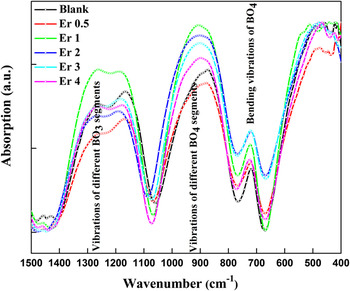
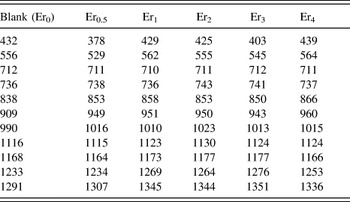
Infrared spectroscopy is usually used to obtain essential information concerning the arrangement of the structural units of the studied glasses. It is assumed that vibrations of structural units of the glass network are independent of vibration of other neighboring units. Reference ElBatal, Marzouk, Nada and Desouky36 Also, it is well known that vitreous B2O3 consists of BO3 units, which can be associated to form six-membered boroxol rings. Therefore, the obtained FTIR data of the prepared glasses in the range 400–1600 cm−1 are shown in Fig. 3. To investigate the role of the glass modifier such as Er2O3 on the active peaks in the measured spectra, a deconvolution process should be taking place using Gaussian fitting. The deconvolution of the measured spectra is shown in Table I. The active peaks of the blank sample were found to be at 432, 556, 712, 736, 838, 909, 990, 1116, 1168, 1233, and 1291 cm−1.
FTIR spectra of (B30·Bi30·Li20·Ba10·Pb10) glass doped with Er2O3 content.

The vibration modes of the studied glasses doped with Er2O3.

It is known from previous work that the vibrational modes of borate glasses can be coordinated as follows:
-
(i) The band observed at 432–556 cm−1 is attributed to the vibration of Bi–O–Bi in the [BiO6] octahedron. Reference Doweidar and Saddeek6,Reference Ardelean, Cor, Lucacel and Hulpus37,Reference Dimitriev and Mihailova38
-
(ii) 712–736 cm−1 originates due to the bending vibration of B–O–B in [BO3] triangles. Reference Iordanova, Dimitrov, Dimitriev and Klissurski39,Reference Manisha Pal, Hirota, Tsujigami and Sakata40
-
(iii). Vibration band at 838 cm−1 (Ref. Reference Dimitrov, Dimitrov and Montenero41) in [BiO3] polyhedral.
-
(iv) 909–990, 1116, and 1168 cm−1 are attributed to the stretching vibration of B–O–B in [BO4] triangles. Reference Sindhu, Sanghi, Agarwal, Seth and Kishore42,Reference Kashif, Abd El-Maboud and Ratep43
-
(v) 1233–1291 cm−1 is attributed to the stretching vibration of the B–O–B in [BO3] tetrahedron. Reference Verhoef and Den Hartog44,Reference Kamitsos, Patsis, Kararkassides and Chryssikos45
It can be noted from Table I and Fig. 3, that further addition of Er2O3 to the blank sample alters the band position and intensity. The addition of Er2O3, to B2O3 network, causes a conversion of BO3 into BO4 units. The relation between BO4 and BO3 is usually determined by N 4 which is given by the relation Reference El-Egili46 :
 $${N_4} = {{{A_4}} \over {{A_4} + {A_3}}}\quad ,$$
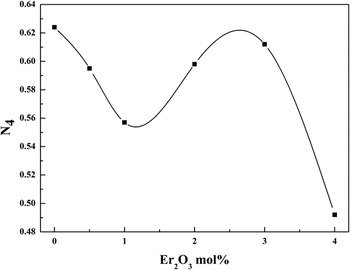
where A 4 presents the relative area under the peak of vibrational modes ranging between 800 and 1200 cm−1 for borate and A 3 is the relative area under the peak of the vibrational modes in the range 600–800 and 1200–1600 cm−1. The N 4 diagram is shown in Fig. 4. The studied glass system is a complex one and contains various structural units, such as B4(Er), B3(Er), B4(Pb), PbO4, and BO3. These units are, respectively, BO4 units modified by Er2O3, BO3 units modified by Er2O3, BO4 units modified by PbO, network former PbO4 units, and symmetric BO3 units. The N 4 values can be used to trace the change in concentration of these structural units as a function of the Er2O3 content. Reference Zhou, Dai, Wang, Xu, Nie and Huang47–Reference Doweidar and Saddeek50 It can be noted from Table I that the addition of Er2O3 to the blank sample alters the band position and intensity. This addition causes a nonuniform behavior of the compositional dependence of N 4 on Er2O3. Now, to investigate the role of Er2O3, the concentration of the various structural units should be computed as follows.
The coordination number N 4 of the glass samples as a function of Er2O3 content.

The concentration, (mol%), of B2O3 in the form of BO4 units, can be given as
 $${C_{{\rm{B}}{{\rm{O}}_4}}} = {N_4}{C_{{{\rm{B}}_2}{{\rm{O}}_3}}}\quad ,$$
where
 ${C_{{{\rm{B}}_2}{{\rm{O}}_3}}}$
represents the concentration (mol%) of B2O3. The quantity,
 ${C_{{\rm{B}}{{\rm{O}}_3}}}$
(mol%), of symmetric BO3 units, is then
 $${C_{{\rm{B}}{{\rm{O}}_3}}} = \left( {1 - {N_4}} \right){C_{{{\rm{B}}_2}{{\rm{O}}_3}}}\quad .$$
Since Er2O3 is considered as network modifier, then the concentration,
 ${C_{{{\rm{B}}_4}\left( {{\rm{Er}}} \right)}}$
(mol%), of B2O3 that forms B4(Er) units would be
 $${C_{{{\rm{B}}_4}}} = 3x\quad ,$$
where x is the concentration of Er2O3, and the concentration,
 ${C_{{{\rm{B}}_4}\left( {{\rm{Pb}}} \right)}}$
, of B2O3 that forms B4(Pb) unit is
 $${C_{{{\rm{B}}_4}\left( {{\rm{Pb}}} \right)}} = {C_{{\rm{B}}{{\rm{O}}_4}}} - {C_{{{\rm{B}}_4}\left( {{\rm{Er}}} \right)}}\quad .$$
It might be clear that
 ${C_{{{\rm{B}}_4}\left( {{\rm{Pb}}} \right)}}$
equals to the concentration of the modifier Pb2O3. It follows that the concentration,
 ${C_{{\rm{Pb}}{{\rm{O}}_4}}}$
, of PbO that forms PbO4 units can be expressed as
 $${C_{{\rm{Pb}}{{\rm{O}}_4}}} = {C_{{\rm{PbO}}}} - {C_{{{\rm{B}}_4}\left( {{\rm{Pb}}} \right)}}\quad .$$
Table II lists the variations of the concentration of the various structural units against Er2O3. It is shown that there is a decrease in
 ${C_{{{\rm{B}}_4}\left( {{\rm{Pb}}} \right)}}$
and an increase in
 ${C_{{{\rm{B}}_4}\left( {{\rm{Er}}} \right)}}$
and
 ${C_{{{\rm{B}}_3}\left( {{\rm{Pb}}} \right)}}$
with increasing Er2O3 content. Also, it is clear that the concentration of B4(Pb) is going to vanish at Er2O3 content >4 mol%. The decrease in the concentration of B4(Pb) units is accompanied by an increase in the concentration of
 ${C_{{{\rm{B}}_4}\left( {{\rm{Er}}} \right)}}$
and
 ${C_{{{\rm{B}}_3}\left( {{\rm{Er}}} \right)}}$
units. Moreover, by using the data presented in Table II and the molar volume values (V
m), the overall concentration (n
u) of the structural units in glass (total number of structural units/cm3)
Reference Doweidar and Saddeek50
can be calculated as a function of the Er2O3 concentration according to the relation;
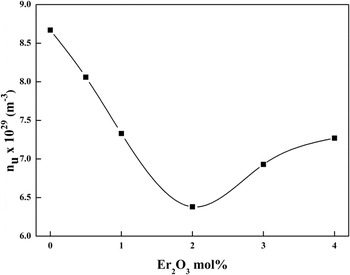
 $${n_{\rm{u}}} = 6.0022 \times {10^{23}}{{\left( {{C_{{\rm{B}}{{\rm{O}}_3}}} + {C_{{{\rm{B}}_4}\left( {{\rm{Er}}} \right)}} + {C_{{{\rm{B}}_4}\left( {{\rm{Pb}}} \right)}} + {C_{{\rm{Pb}}{{\rm{O}}_4}}}} \right)} \mathord{\left/ {\vphantom {{\left( {{C_{{\rm{B}}{{\rm{O}}_3}}} + {C_{{{\rm{B}}_4}\left( {{\rm{Er}}} \right)}} + {C_{{{\rm{B}}_4}\left( {{\rm{Pb}}} \right)}} + {C_{{\rm{Pb}}{{\rm{O}}_4}}}} \right)} {{V_{\rm{m}}}}}} \right. \kern-\nulldelimiterspace} {{V_{\rm{m}}}}}\quad .$$
Change in concentration of various structural units as a function of the Er2O3 content.

Now, Fig. 4 reveals that the addition of Er2O3 into the glass network will decrease the N 4 value from 0 to 1 mol% of Er2O3 while from 1 to 3 mol% increase the N 4 value which is followed by a decrease beyond this concentration. The behavior of N 4 obeys the behavior of the concentration of BO4 structural units. This behavior is confirmed from the decrease of the concentration of the structural units of the HMOs and the increase of the concentration of the structural units of Er2O3. Reference Zhou, Dai, Wang, Xu, Nie and Huang47 This indicates the modifier role of Er2O3 in the glass network, i.e., it affects the probability of BO4 formation by breaking up tetrahedral bonds of BO4 units and introducing coordination defects known as dangling bonds. Reference Maniu, Ardelean, Iliescu, Cinta and Cozar48,Reference Krishna Murthy, Murthy and Veeraiah49 Figure 5 and Table II shows a minimum of n u at 2 mol% Er2O3.
Dependence of the structural unit concentrations (n u) on Er2O3 content.

C. Density and molar volume studies
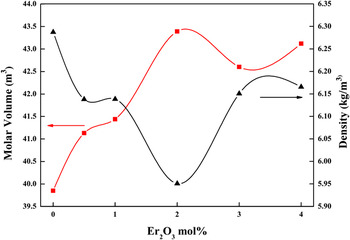
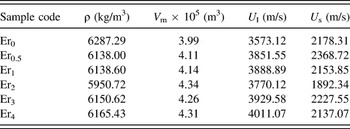
Density in the glassy state depends on the chemical composition of the samples. Then it is important to characterize the structure of the glass (compactness and/or softening), the coordination number, the change in geometrical configuration, and bond density, etc. In general, when metal oxides are added to the glass network, the density may be decreased or increased with increasing the ratios of the oxides without any anomalous behavior. However, in the studied glass system, there is an anomalous behavior. Figure 6 and Table III shows the variation of the density and the molar volume behavior by increasing the Er2O3 content.
Variation of density and molar volume of the prepared glass with increasing Er2O3 content.

Density (ρ), molar volume (V m), and ultrasonic velocity longitudinal (U l) and shear (U s).

Inspection of Table III and Fig. 6 reveals that the density of the blank glass sample, (0 mol% Er2O3), was 6287.29 kg/m3, and by adding the Er2O3 to the glass, the density decreased with no remarkable values to be 6138 kg/m3 at 0.5 mol% Er2O3 content and 6138.60 kg/m3 at 1 mol% Er2O3. Beyond this concentration of Er2O3, density drops to a lower value reaching 5950.72 kg/m3 for the 2 mol% Er2O3 content sample. This may be explained by adding Er2O3 to the glass system that will increase the open structure and the NBOs in the glass network which increases the overall volume and hence decreasing the density. In the range 2 ≤ Er2O3 ≤ 4 (mol%), the density increases remarkably again by increasing the Er2O3 content in the samples from 6150.62 to 6165.43 kg/m3. In this range, Er2O3 starts to enter the glass network by reducing the NBOs and increasing the compactness of the glass and more of bridging oxygens (BOs) will be created leading to increasing the rigidity of the glass. The results are in a great agreement with the results of the infrared (IR).
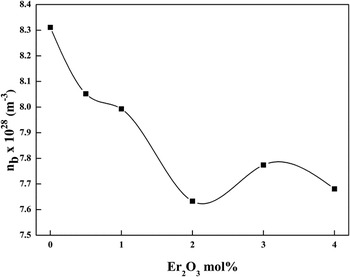
The molar volume showed an opposite behavior to the density behavior with the increasing Er2O3 content. The increase in V m with increasing Er2O3 content up to 2 mol% Er2O3 may be related to the increase of BO3 units. Moreover, according to Wells, Reference Wells51 Er3+ ion is coordinated with seven oxygen atoms, which may participate in the expansion of the studied glass network and increase the molar volume. It might be taken into consideration that one Er2O3 molecule produces six B4(Er) units at the expense of B4(Pb) units, which is responsible for the decrease in the number of network bonds per unit volume (n b) up to 2 mol% Er2O3 as shown in Fig. 7 and Table III. The calculations of n b as a function of the Er2O3 concentration according to the relation;
 $${n_{\rm{b}}} = {{{N_{\rm{A}}}{n_{\rm{f}}}} \over {{V_{\rm{m}}}}}\,\left( {{{\rm{m}}^{ - 3}}} \right)\quad ,$$
where, N A is the Avogadro's number, and n f is the number of network bonds per unit formula.
Dependence of the number of network bonds per unit volume (n b) on Er2O3 content.

The decrease in V m at 3 mol% Er2O3 content can be attributed to the increase in the concentration of [BO4] units and n b which reduces the formation of NBOs.
D. Ultrasonic and elastic moduli studies
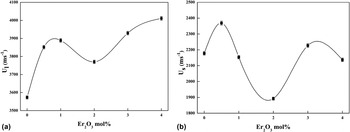
Ultrasonic velocity is very sensitive to the variation of the glass network structure. The experimental ultrasonic velocity data in the glass system are given in Table III and Figs. 8(a) and 8(b). It is inferred from the table and figures that there is an initial increase in velocity up to 0.5 mol% of Er2O3 for the transverse wave and at 1 mol% for the longitudinal force. Both of velocities decreased to reach the minimum at 2 mol% Er2O3 content with a higher rate for the shear velocity. Further addition of Er2O3 causes an increase in the velocities again for up to 4 mol% Er2O3. This can be attributed to the sensitivity of the glass system for the shear stress more than the compression stress.
Ultrasonic velocities (a) longitudinal U l and (b) shear U s with Er2O3 content.

Elastic properties of materials are usually characterized by Young's modulus, shear modulus, bulk modulus, and Poisson's ratio. For isotropic materials only two of these elastic constants are independent and other constants are calculated by using the relations given by the theory of elasticity. The best choice for these two independent moduli is considered as the shear modulus and the bulk modulus. The shear modulus, (G), relates to strain response of a body to shear or torsional stress. It involves a change of shape without change of volume. On the other hand, the bulk modulus, (B), describes the strain response of a body to hydrostatic stress involving a change in volume without change of shape.
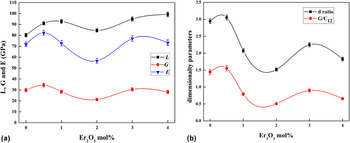
The composition dependence of the elastic moduli showed an initial increase in longitudinal modulus (L), shear modulus (G), Young's modulus (E) and the dimensionality parameters (d) and (G/C 12), Table IV and Figs. 9(a) and 9(b), up to 0.5 mol% of Er2O3. Beyond this limit, there is a decrease in these parameters to reach a minimum value with 2 mol% of Er2O3 then to start to increase again at 3 mol% of the Er2O3 content. At 4 mol% of Er2O3 content, most of the elastic moduli decrease then few slight increases. In the studied glass system, maybe there is a modification of BO4 structural units by Er2O3 by forming B4(Er) and B3(Er) units. As the Er2O3 content increases, the concentration of B4(Er) and B3(Er) units increases at the expense of the units of HMOs. The increase of B4(Er) and B3(Er) units expands the structure, therefore, the changes in the type and concentration of these structural units produce a minimum in the compositional dependence of the constants of elasticity with Er2O3 around 2 mol% Er2O3. The two ratios, d and G/C 12, describing the dimensionality of the structure of the studied glasses have an inversion around 2 mol% Er2O3 in a good correlation with the behavior of the constants of elasticity as shown in Table IV and Figs. 8 and 9.
The mean velocity (U m), longitudinal modulus (L), shear modulus (G), bulk modulus (B), Young's modulus (E), the microhardness (H), ratio (G/C 12), E/G ratio, d ratio and Poisson's ratio (σ) of all glass samples.

Elastic constants (a) L, G, and E (b) the dimensionality parameters with the Er2O3 content.

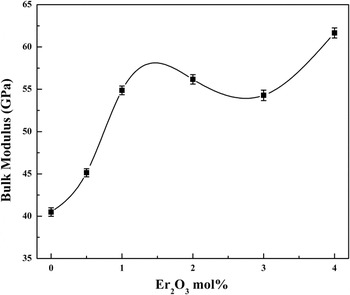
Figure 10 shows the compositional dependence of the bulk modulus (B) against the Er2O3 content. The behavior of the bulk modulus (B) behaves in a different way to that of the other elastic moduli L, G, and E. This abnormal behavior may be due to the fact that the rate of change in the shear stress is greater than that of the compression stress according to the equation. Reference Saddeek4
Composition dependence of the bulk modulus B of the studied glasses.

The differential relationships of σ with E and G, and U l and U s can be obtained by differentiating Eqs. (6) and (7), respectively. The differential forms of the above equations are:
 $${{{\rm{d}}\sigma } \over \sigma } = {1 \over {1 - \left( {{{2G} \mathord{\left/ {\vphantom {{2G} E}} \right. \kern-\nulldelimiterspace} E}} \right)}}\left( {{{{\rm{d}}E} \over E} - {{{\rm{d}}G} \over G}} \right)\quad ,$$
 $${{{\rm{d}}\sigma } \over \sigma } = {{\left( {\mathop {{U_{\rm{l}}}}\nolimits^2 - \mathop {{U_{\rm{s}}}}\nolimits^2 } \right)} \over {\left( {\mathop {{U_{\rm{l}}}}\nolimits^2 - \mathop {{U_{\rm{s}}}}\nolimits^2 } \right)\left( {\mathop {{U_{\rm{l}}}}\nolimits^2 - 2\mathop {{U_{\rm{s}}}}\nolimits^2 } \right)}}\left( {{{{\rm{d}}{U_{\rm{l}}}} \over {{U_{\rm{l}}}}} - {{{\rm{d}}{U_{\rm{s}}}} \over {{U_{\rm{s}}}}}} \right)\quad .$$
Variation of Poisson's ratio (σ) depends on the variation of the values and relative values of E and G in Eq. (10) and U l and U s in Eq. (11). For any material E and G as well as U l and U s tend to increase or decrease together. Therefore, we cannot decide that the variation of σ in the same or opposite direction to that of E and G. Using Eqs. (10) and (11), we can predict the behavior of σ according to which of the two elastic constants varies more than the other. If Eqs. (10) and (11) are positive, then σ varies in the same direction of E or U l, and G or U s and vice versa. However, for isotropic solids, σ is bounded practically by 0 and 1/2.
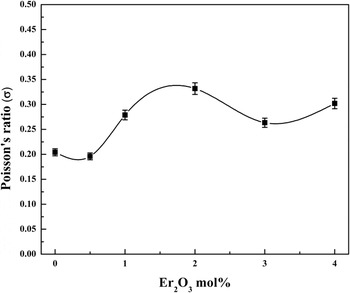
A high crosslink density material has a Poisson's ratio in the order of 0.1–0.2 while low crosslink density materials have Poisson's ratio between 0.3 and 0.5. Reference El-Mallawany52,Reference Rajendran, Palanivelu, Modak and Chaudhuri53 Accordingly, Poisson's ratio of the investigated glass is about 0.2 at 0 and 0.5 mol% Er2O3 content, while it increased to 0.33 at 2 mol% Er2O3 content, Fig. 11.
Relation between Poisson's ratio (σ) of the glass and Er2O3 content.

Microhardness expresses the required stress to eliminate the free volume (deformation of the network) of the glass. The microhardness (H) was calculated from Young's modulus (E) and Poisson's ratio (σ) according to the relationship:
 $$H = {{E\left( {1 - 2\sigma } \right)} \over {6\left( {1 + \sigma } \right)}}\quad .$$
The increase in the microhardness indicates the increase in the rigidity of the glass. The microhardness as shown in Fig. 12 decreases as Poisson's ratio increases and vice versa. However, for isotropic solids, σ is bounded practically by 0 and 0.5.
Variation of microhardness H with increasing Er2O3 content.

Dimensionality of the amorphous structure can be described with two important parameters related to the elasticity's constants, Reference Hwa, Hsieh and Liu54,Reference Chen, Wu and Hwa55 one of them is called the d ratio which equals to 4 G/B. In the three-dimensional tetrahedral coordination polyhedron such as SiO2, the value of the d ratio is 3 and in the two-dimensional layer structures, it equals 2. The second important parameter is the ratio G/C 12, Reference Chen, Wu and Hwa55 which is considered as an indicator of the character of the force field. This parameter equals to 1 in the case of the central force type; otherwise, the force is not central. On the other hand, the G/C 12 ratio approaches unity as the central force field may reduce the fraction of the broken bonds in the network structure of the glass. Reference Hwa, Hsieh and Liu54 Another parameter is the ratio between Young's modulus and shear modulus E/G. The results indicated 2-dimensional network with noncentral force.
The Debye temperature (θD) is an important parameter of solids; it represents the temperature at which nearly all the vibration modes are excited. The softening temperature (T S) is another important parameter defined as the temperature at which viscous flow changes to plastic flow. The two temperatures can be calculated according to the relations;
 $${\theta _{\rm{D}}} = \left( {{h \over {{K_{\rm{B}}}}}} \right){\left( {{{3n{N_{\rm{A}}}} \over {4\pi {V_{\rm{m}}}}}} \right)^{{1 \mathord{\left/ {\vphantom {1 3}} \right. \kern-\nulldelimiterspace} 3}}}{U_{\rm{m}}}\quad ,$$
where, h is Plank's constant, K B is Boltzmann's constant, N A is Avogadro's number, V m is the molar volume, n is the number of atoms in the chemical formula, and U m is the mean ultrasonic velocity.
 $${U_{\rm{m}}} = {\left( {{1 \over 3}\left( {{1 \over {\mathop {{U_{\rm{L}}}}\nolimits^3 }} + {2 \over {\mathop {{U_{\rm{S}}}}\nolimits^3 }}} \right)} \right)^{ - {1 \over 3}}}\quad .$$
The softening temperature can be evaluated from the relation
 $${T_{\rm{S}}} = \left( {{{{M_{\rm{w}}}} \over {c\rho }}} \right)\mathop {{U_{\rm{S}}}}\nolimits^2 \quad ,$$
where M w is the molecular mass and c is constant equals [0.5074 × 105 cm/(K−1/2 s)]. Reference El-Mallawany, El-Khoshkhany and Afifi56
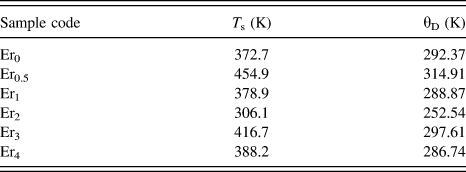
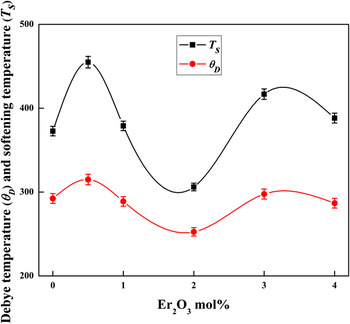
Debye temperature (θD) and the softening temperature (T S) are illustrated in Table V and Fig. 13. It can be observed that both the Debye and softening temperatures increased from 292.37 and 372 K to 314.91 and 454.9 K, respectively, as the content of Er2O3 was increased to be 0.5 mol%. The increase in the mean ultrasonic velocity (U m) and consequently the increase in Debye and softening temperatures are mainly due to the decrease of the number of NBOs as a direct effect of the insertion of Er2O3 ions, with 0.5% concentration, into the glass network structure. By increasing the Er content up to 2% creates NBOs and causes loose packing in the glass structure and a reduction in the vibrations of the lattice, slight increase in n u and NBOs at 3 and 4% Er2O3 concentration. The two temperatures followed the behavior of the ultrasonic velocities.
The softening temperature (T s) and the Debye temperature (θD).

Variation of the (θD) and (T s) with Er2O3 content.

IV. CONCLUSION
The density, infrared bands, and the ultrasonic velocity in the complex glass system doped with Er2O3 plotted against composition are found to exhibit anomalous behavior with increasing mol% of Er2O3. It also shows a maximum and minimum and another maximum depending on the amount of the NBOs. Also, the values of the elastic moduli exhibit the same behavior.