
Introduction
A single cortical neuronal cell extends two types of processes during growth: a long axon and several smaller dendrites. Once the neuron network is formed, the axon sends information to other neurons, while the dendrites receive electrical signals from other axons. To form the network, the axons extend (grow) through a complex environment. The tip of the axon (called the growth cone) is sensitive to a multitude of stimuli: biochemical, mechanical, and geometrical.[Reference Wen and Zheng1, Reference Lowery and van Vactor2] Much of what is currently known about the processes that direct the growth of axons in response to mechanical and geometrical cues comes from studies of neuron growth on patterned surfaces.[Reference Wen and Zheng1–Reference Spedden, Wiens, Demirel and Staii10] Directing axonal growth is also of great importance for bioengineering artificial neural tissue. Therefore, many studies focus both on understanding the biophysical mechanisms that control neuron growth, and on developing biocompatible surfaces for stimulating neuronal regeneration. For example, previous studies have shown the alignment of axonal growth on a variety of surfaces, including surface-bound proteins,[Reference Clark, Britland and Connolly4–Reference Staii, Viesselmann, Ballweg, Williams, Dent, Coppersmith and Eriksson6] signaling molecules,[Reference Rosoff, Urbach, Esrick, McAllister, Richards and Goodhill7] and topographical structures (ridges, indentations, and periodical patterns).[Reference Francisco, Yellen, Halverson, Friedman and Gallo8–Reference Spedden, Wiens, Demirel and Staii10]
In our previous work,[Reference Beighley, Spedden, Sekeroglu, Atherton, Demirel and Staii9, Reference Spedden, Wiens, Demirel and Staii10] we have demonstrated axonal alignment toward a single dominant direction on surfaces with engineered ratchet-like topography (asymmetric tilted nanorod or nano-ppx surfaces). These surfaces have been formed through vapor-phase polymerization and directed deposition of poly(chloro-p-xylylene) as described in Refs Reference Beighley, Spedden, Sekeroglu, Atherton, Demirel and Staii9 and Reference Spedden, Wiens, Demirel and Staii10. The evaporation procedure generates a thin film of tilted nanorods that cluster together to form a periodic surface with a ratchet structure.[Reference Spedden, Wiens, Demirel and Staii10] The geometrical and mechanical properties of these surfaces are comparable to the corresponding properties of the polydimethylsiloxane (PDMS) surfaces used in this study. In our previous work, we have used a theoretical model based on the Fokker–Planck (FP) equation to quantify the angular distribution of axonal growth and to measure the diffusion and angular drift coefficients.[Reference Spedden, Wiens, Demirel and Staii10] We have shown that the angular drift coefficient originates from the axon–surface interaction forces that ultimately produce a “deterministic torque” that aligns the growth cones along certain preferred directions of growth. Here we measure axonal growth on micro-patterned PDMS surfaces. We use fluorescence microscopy to record real-time images of axonal growth and angular distributions on these surfaces for embryonic rat cortical neurons. We demonstrate a high degree of axonal alignment, which is controlled primarily by the surface geometry. We use the FP equation to measure the angular diffusion coefficient and to study its time evolution. We find that the cell–surface forces (torques) that control the axon alignment have a maximum value early during the growth and decrease in time as axons become more aligned with the surface patterns.
Experiment
Surface preparation and cell culture
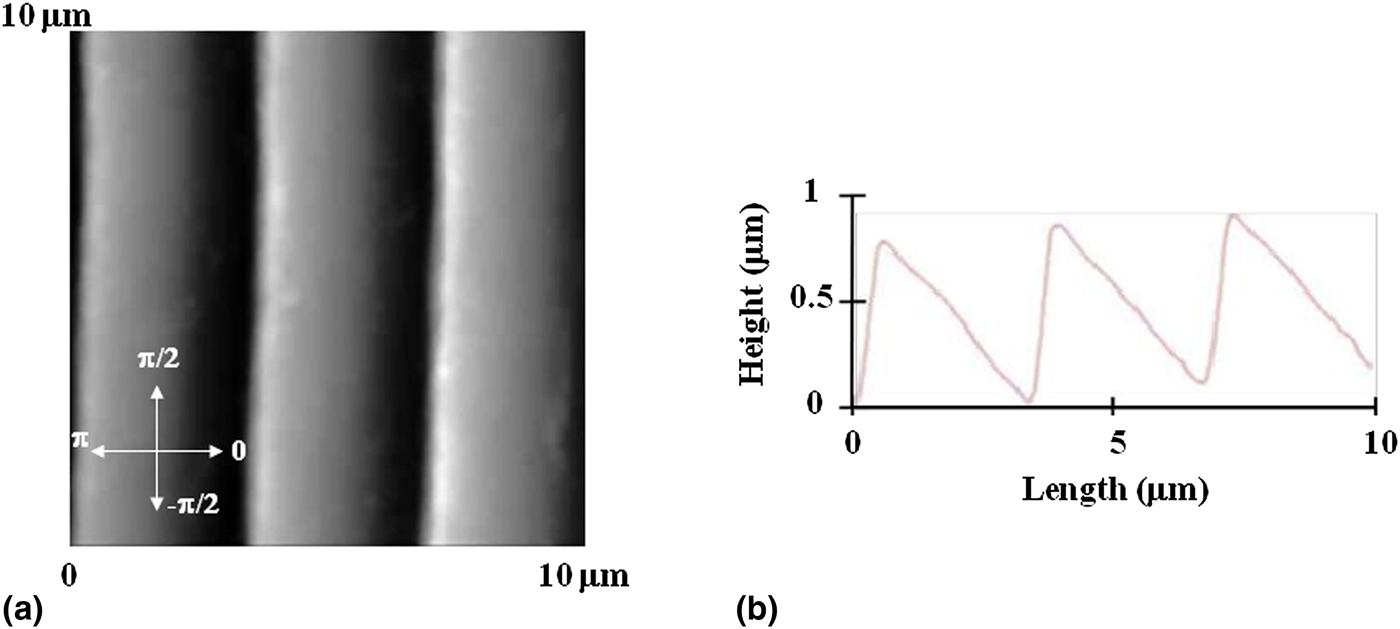
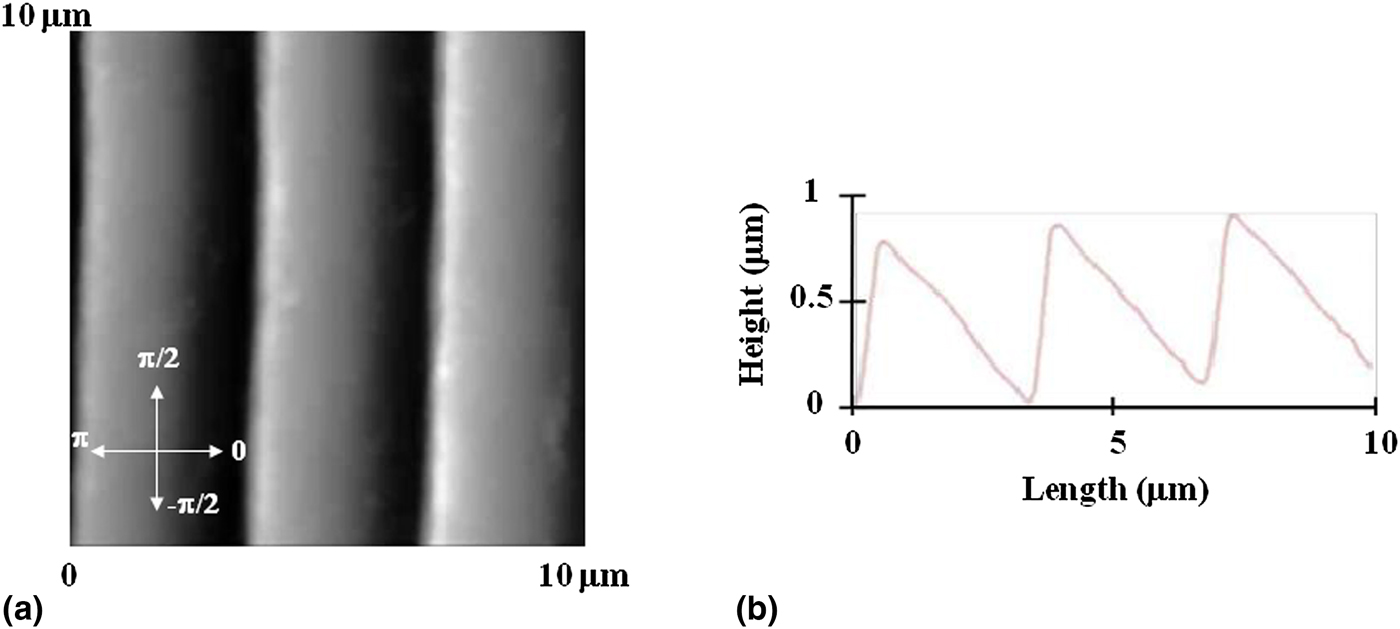
To fabricate micro-patterned substrates, we start with 20 mL PDMS solution (Silgard, Dow Corning, Midland, Michigan) and pour it over diffraction gratings with slit separation of 3 µm and total surface area 25 mm × 25 mm. The PDMS films were left to polymerize for 48 h at room temperature, then peeled away from the diffraction gratings, and cured at 55 °C for 3 h. We use atomic force microscope (AFM) imaging to ensure that the pattern was successfully transferred from the diffraction grating to the PDMS surface [Figs. 1(a) and 1(b)]. The result is a series of periodic patterns (parallel lines with crests and troughs) with the distance between two adjacent lines d = 3 µm [Fig. 1(b)]. The surfaces were glued to glass slides using silicone glue and then dried for 48 h. Next, each surface was cleaned with sterile water and spin-coated with 3 mL of poly-D-lysine (PDL) (Sigma-Aldrich, St. Louis, MO, USA) solution of concentration 0.1 mg/mL. The spinning was performed for 10 min at 1000 RPM. Prior to cell culture, the surfaces have been sterilized using ultraviolet light for 30 min.
(a) AFM topographical scan of the micro-patterned PDMS substrates. The arrows in the inset define the reference directions for the measured angular distributions. The growth angle θ is measured with respect to the direction specified by 0 rad. The growth angle is positive if the axon grows in the “upward” direction: 0 <0 <π, and negative if the axon grows “downwards”:− π<0 <0. Note that +π and − π rad specify the same direction. (b) Height profile (line scan) across a horizontal line. This height profile illustrates the repeating periodic pattern on the substrates with a periodicity d = 3 µm.
Cortical neurons have been obtained from rat embryos (day 18 embryos obtained from Tufts Medical School). The cortices have been incubated in 5 mL of trypsin at 37 °C for 20 min. To inhibit the trypsin, we have used 10 mL of soybean trypsin inhibitor (Life Technologies, Grand Island, NY, USA). Then the neuronal cells have been mechanically dissociated, centrifuged, and the supernatant was removed.[Reference Spedden, White, Naumova, Kaplan and Staii3] Next, the neurons have been resuspended in 20 mL of neurobasal medium (Life Technologies) enhanced with GlutaMAX, b27 (Life Technologies), and pen/strep. Finally, the neurons have been re-dispersed with a pipette, counted, and plated at a density of 5000 cells/cm2.
Fluorescence imaging and quantification of axonal growth
For fluorescence imaging, the cortical neurons have been rinsed with phosphate-buffered saline (PBS). The cells have been incubated for 30 min at 37° C with 50 nM Tubulin Tracker Green (Oregon Green 488 Taxol, bis-Acetate, Life Technologies) in PBS. Next, the samples have been rinsed twice with PBS and re-immersed in PBS solution for imaging. Fluorescence images were acquired using a standard fluorescein isothiocyanate––FITC filter: excitation: 495 nm and emission: 521 nm. The growth of axons was measured and quantified using ImageJ (National Institute of Health). All axons have been tracked and then partitioned into 20 µm segments.[Reference Spedden, Wiens, Demirel and Staii10] The angle for each segment was measured and the results plotted as angular histograms (Fig. 3). All surfaces have been imaged using an MFP3D AFM (Asylum Research, Santa Barbara, CA, USA) using AC 160TS cantilevers (Asylum Research). The PDMS surfaces have been imaged both before and after cell culture, and no significant change in topography was observed for these surfaces. Axon growth was quantified at different time points after plating, in increments of 4 h: t = 8, 12, 16, 20, 24, and 28 h. For each time data point, we have measured between 100 and 170 different cells (corresponding to 5–10 different fluorescent images per time data point). The number of cells (axons) is statistically significant.
Results and discussion
The substrates utilized in this study are PDL-coated PDMS surfaces, with periodic micro-patterns (parallel ridges separated by troughs, Fig. 1). Cortical neurons were plated on the substrates and axon growth was quantified at different time points after plating, in increments of 4 h: t = 8, 12, 16, 20, 24, and 28 h. At each time point, we have measured the total length of each axon as well as the axon distribution as a function of growth angle θ. Growth at θ = ± π/2 rad is defined as axonal elongation in the direction of the micro-patterned surface lines (vertical direction in Fig. 1), while growth at θ = 0 and ±π rad represents growth in the direction perpendicular to the patterns (horizontal direction in Fig. 1).
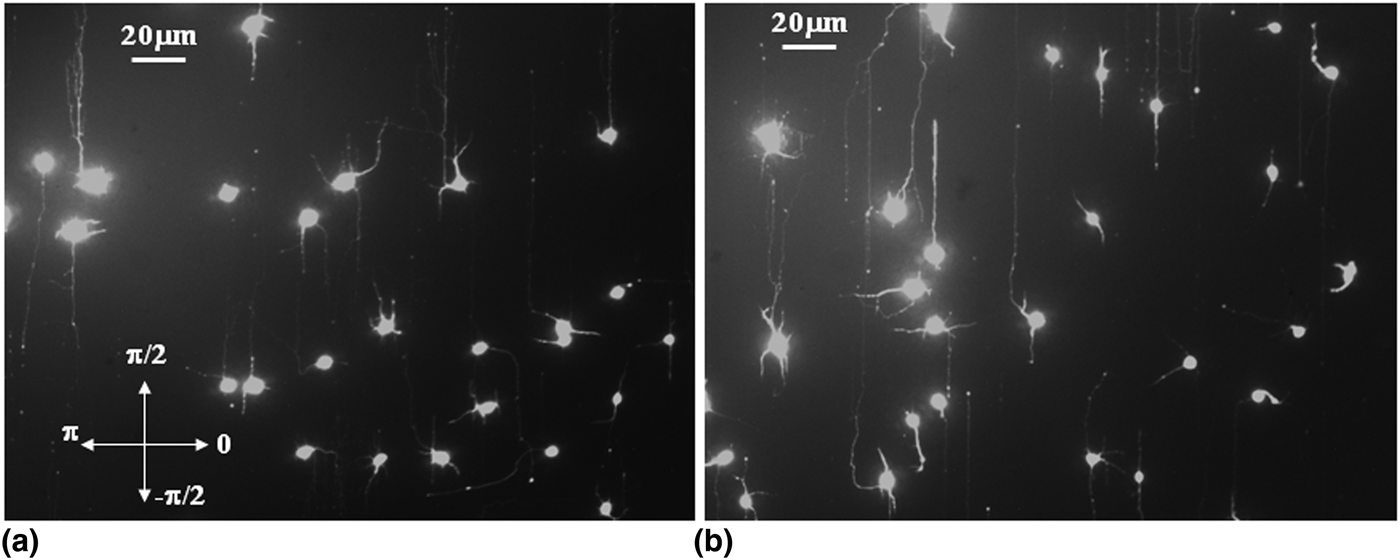
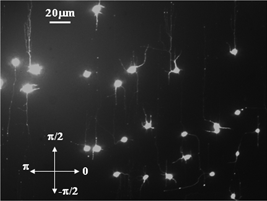
Examples of axonal growth are shown in Fig. 2. To quantify the axonal angular distribution, we have divided each axon into segments of 20 µm in length using ImageJ software.
Fluorescent images for neurons grown on PDMS substrates with periodic micro-patterns similar to the ones shown in Fig. 1. Neuronal cell bodies are shown by rounded features; axons are represented by the long processes outgrowing from the cell body; dendrites are represented by the short processes (for cortical neurons there is only one axon/cell body). (a) Image showing neuron growth 16 h after plating. The arrows in the inset define the reference directions for the measured angular distributions [same as in Fig. 1(a)]. (b) Image showing neuron growth 24 h after plating. Both (a) and (b) demonstrate a high degree of alignment between the direction of the axonal growth and the direction of the micro-patterns (θ = ± π/2).

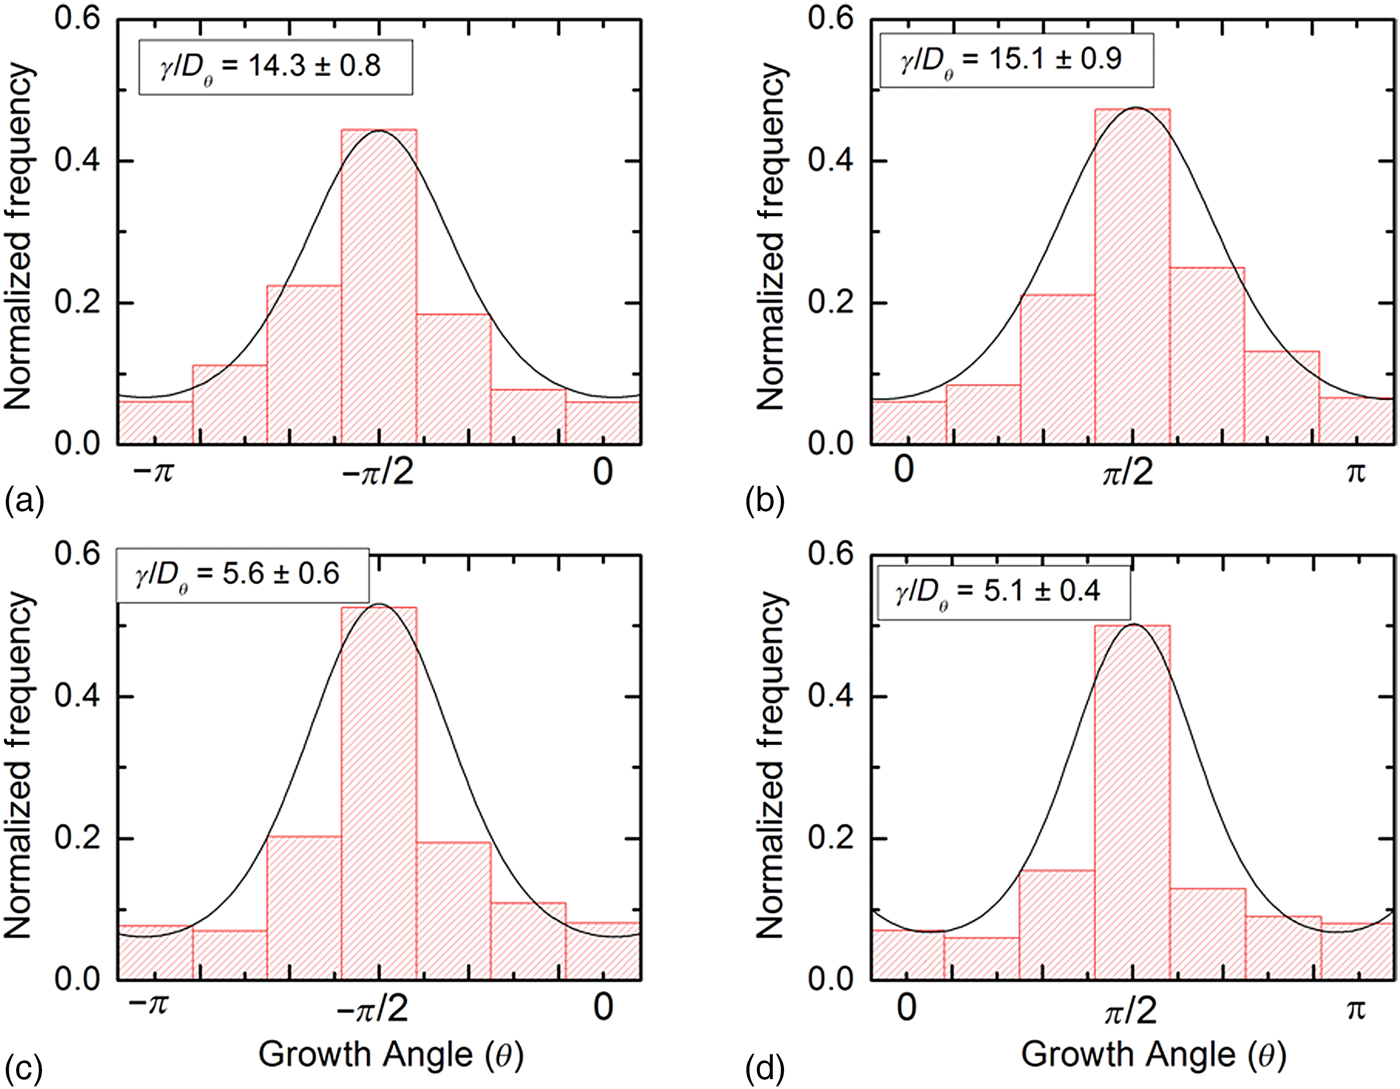
The dynamics of the growth cone is a stochastic process and is influenced by many types of phenomena, including fluctuations of the weak chemical gradients, the fundamental stochastic character of biochemical reactions taking place in the growth cone, polymerization/de-polymerization processes involved in actin and microtubule dynamics, etc. It follows that, quite generally the dynamics of the growth cone on micro-patterned surfaces is controlled both by a deterministic component (tendency to grow in certain preferred directions imparted by surface geometry), and a random deviation from these growth directions due to stochastic processes. In our previous work,[Reference Spedden, Wiens, Demirel and Staii10, Reference Rizzo, White, Spedden, Wiens, Kaplan, Atherton and Staii11] we have used a general formalism based on the FP equation to describe the dynamics of the growth cones on nano-ppx or glass surfaces. A similar formalism has been used by other authors, for example, to describe the motion of human granulocyte cells under the influence of electric fields[Reference Schienbein and Gruler12] or the dynamics of the leading-edge lamellipodia of the growth cones.[Reference Betz, Lim and Kas13] Examples of normalized angular distributions for axons grown on micro-patterned PDMS surfaces measured at two different time points are shown in Figs. 3(a)–(d).
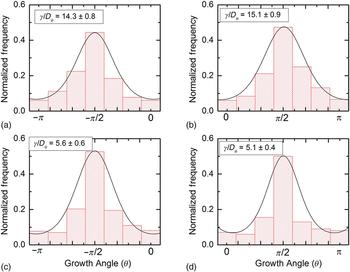
Examples of normalized angular distributions for axonal growth at different time points: t = 16 h for (a) and (b) (N = 128 axons) and t = 24 h for (c) and (d) (N = 143 axons). The continuous curves represent fit of the data with Eq. (2). The distributions show peaks at two angles: θ = −π/2 and + π/2, which correspond to axonal alignment along the micro-patterned lines (see Figs. 1 and 2). The fits to the data for the pairs of histograms: (a)–(d), respectively, give a single value for the ratio γ/D θ at a given time point, as discussed in the text.
Using the angular coordinates defined in Fig. 1(a) for the micro-patterned PDMS surfaces, the FP equation is[Reference Rizzo, White, Spedden, Wiens, Kaplan, Atherton and Staii11, Reference Risken and Haken14]:
 $$\displaystyle{{\partial p(\theta, t)} \over {\partial t}} = \displaystyle{\partial \over {\partial \theta}} [ - \gamma \cdot \cos \theta (t) \cdot p\theta (t)] + D_\theta \cdot \displaystyle{{\partial ^2p(\theta, t)} \over {\partial \theta ^2}},$$
where p(θ,t) is the probability distribution for growth angles and D θ is an effective diffusion (cell motility) coefficient for the angular motion. As in Ref. [Reference Spedden, Wiens, Demirel and Staii10], we interpret the first term on the right-hand side of Eq. (1) as a “deterministic torque,” which tends to align the growth cone with the preferred direction determined by the surface geometry. There is no torque if the motion of the growth cone is parallel to the direction of micro-patterns (i.e., θ = π/2 or −π/2 in Fig. 1). However, if the growth cone moves perpendicular to the patterns (θ = 0 or θ = π), the torque, and the cell–surface interaction that tends to align the axon, has a maximum value. The magnitude of γ quantifies the strength of the interaction between patterned PDMS surface and the growth cone. We note that Eq. (1) is a stochastic differential equation. In the absence of the deterministic torque γ, the angular motion of the growth cone is described by a simple random walk (diffusion) in angular space. The experimentally observed directional bias of axonal growth clearly indicates an additional interaction between the growth cones and the PDMS surfaces, which tends to align the axons with the micro-patterned features.
The angular distributions in Fig. 3 demonstrate aligned growth, with the axons preferentially growing along the micro-patterned lines (peaks at θ = π/2 and −π/2, respectively). Furthermore, if we compare the peak heights for each pair of histograms shown in Figs. 3(a) versus 3(b) and 3(c) versus 3(d), we note that there is no polarized unidirectional growth, i.e., no statistically significant differences in the “upward” (θ = π/2) versus “downward” (θ = −π/2) motion of the growth cones for each PDMS surface. This conclusion holds at each time point considered in these experiments. This result is in contrast with the observed neuronal growth on a different type of directional surfaces (textured nano-ppx surfaces), where we have reported a supplementary unidirectional bias in addition to the preferred alignment along the surface asymmetry.[Reference Spedden, Wiens, Demirel and Staii10]
The stationary solution of Eq. (1) at each time point is given by[Reference Risken and Haken14]:
 $$p(0) = A \cdot {\rm Exp}\left[ {\displaystyle{\gamma \over {D_\theta}} \cdot \vert \sin (\theta ) \vert} \right],$$
where A is a normalization constant. We use Eq. (2) to fit the normalized experimental distributions at each time point considered in these experiments [fits to the data are represented by the continuous curves in Figs. 3(a)–(d)]. We note that at each time point, the experimentally determined angular distributions give only one value for the ratio γ/D θ between the deterministic torque and the diffusion coefficient for the angular motion. For example, by fitting the distributions measured at t = 16 h with Eq. (2) we obtain γ/D θ = (14.3 ± 0.8) [Fig. 3(a)] and γ/D θ = (15.1 ± 0.9) [Fig. 3(b)]. The two values are the same within the estimated uncertainties. A similar fit for the distributions measured at t = 24 h gives: γ/D θ = (5.6 ± 0.6) [Fig. 3(c)] and γ/D θ = (5.1 ± 0.4) [Fig. 3(d)]. These results are in contrast with the previous work on neuronal growth on nano-ppx surfaces[Reference Spedden, Wiens, Demirel and Staii10] where the polarized growth leads to different values for the deterministic torques that control the axonal alignment parallel versus antiparallel with respect to the surface anisotropy.
To determine the effective angular diffusion coefficient D θ, we use the joint fit method we have previously reported for growth on nano-ppx and glass surfaces[Reference Spedden, Wiens, Demirel and Staii10, Reference Rizzo, White, Spedden, Wiens, Kaplan, Atherton and Staii11]: we perform a best fit for all the angular distributions and select that value of D θ which maximizes the likelihood of measuring the experimentally observed data sets. Using this procedure, we perform a joint fit for all surfaces at a given time and obtain an effective value for the angular diffusion coefficient of D θ = (86 ± 8) rad2/h. Remarkably, this value is similar with the value obtained for nano-ppx surfaces[Reference Spedden, Wiens, Demirel and Staii10]: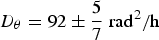 $D_\theta = 92 \pm \displaystyle{5 \over 7}\;{\rm ra}{\rm d}^{\rm 2}/{\rm h}$, which indicates that axonal growth on the two types of directional surfaces (micro-patterned PDMS and nano-ppx) has similar diffusion properties. However, the axonal alignment properties and the axonal–surface interactions quantified by the deterministic torque γ are different, as we discuss below.
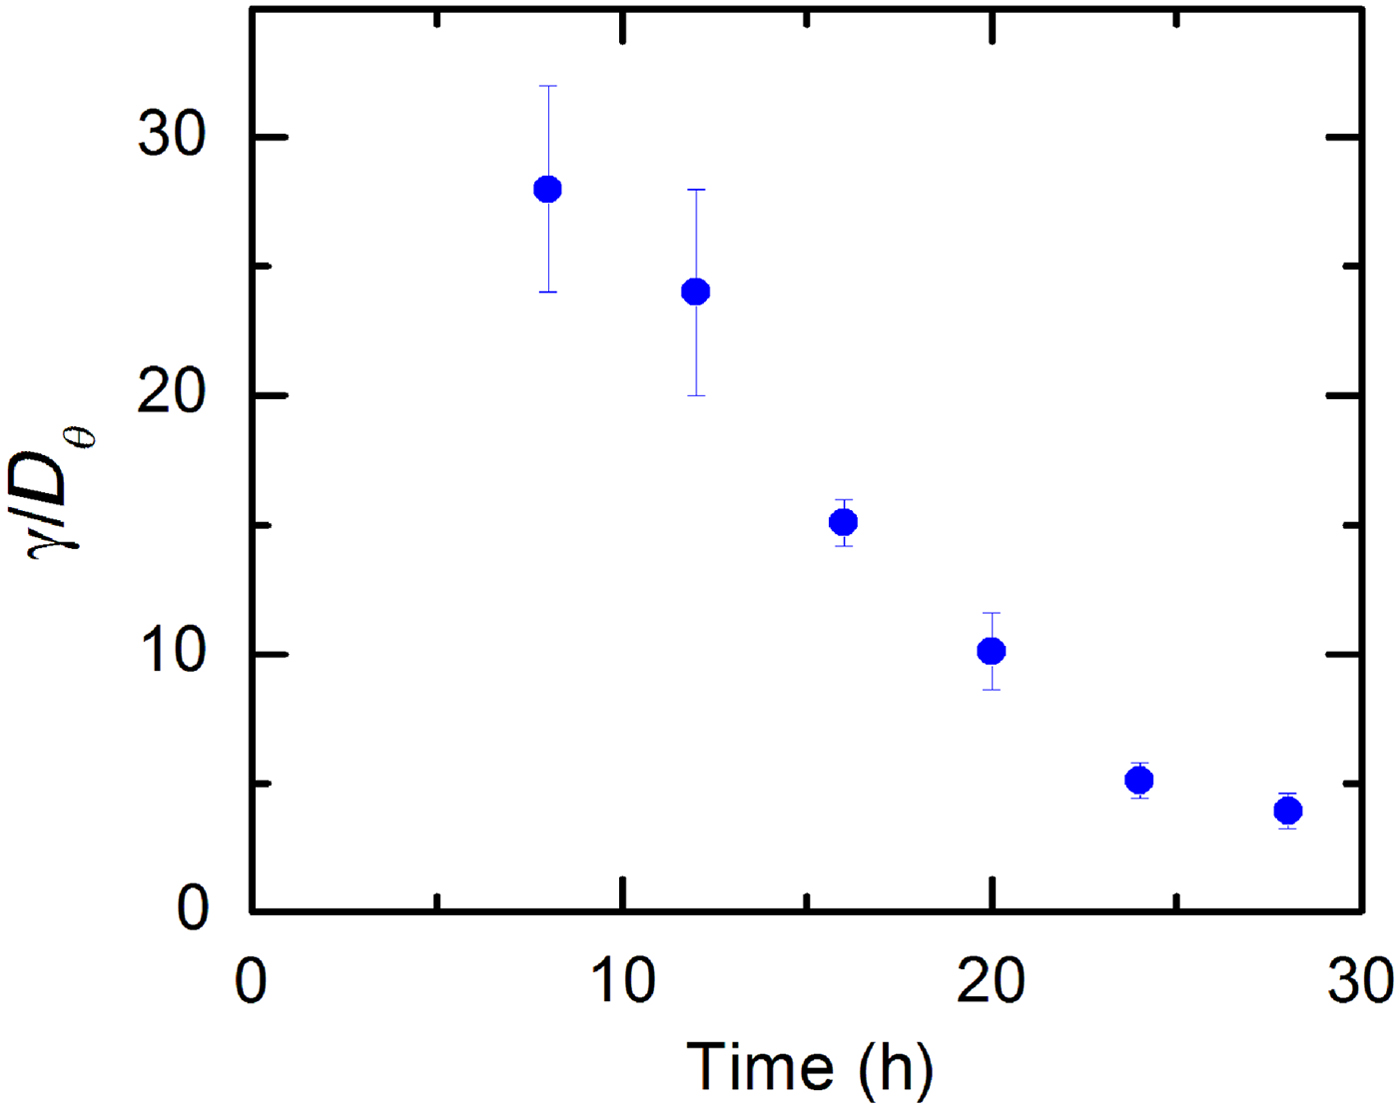
We use Eq. (2) to fit the experimental data and to quantify the variation with time of the ratio γ/D θ between cell–surface coupling torque and the angular diffusion coefficient. Figure 4 shows this variation for the time series considered in these experiments t = 8, 12, 16, 20, 24, and 28 h. Giving that the angular diffusion coefficient has a constant value for all the considered time points, the data in Fig. 4 demonstrate that the magnitude of the deterministic torque γ decreases in time. This implies that the strength of the interaction that tends to align the axons to the patterned lines on PDMS decreases with time. We provide the following interpretation of this experimental result. At earlier times when axons start growing, the growth cone explores the surrounding environment by performing a random walk on the surface.[Reference Wen and Zheng1, Reference Lowery and van Vactor2, Reference Beighley, Spedden, Sekeroglu, Atherton, Demirel and Staii9–Reference Rizzo, White, Spedden, Wiens, Kaplan, Atherton and Staii11] On patterned surfaces, cell–surface forces tend to align the motion of the growth cone along the preferred direction imparted by the surface features. These interactions are stronger at earlier times when the growth cone tends to move in random directions. Once aligned with the patterns, the axons continue to grow preferentially along the direction of the pattern and the corresponding torques that align the motion become less strong. That is, the higher the degree of alignment between the axon and the surface pattern, the less is the magnitude of the torque necessary to produce alignment. This is consistent with our data (Figs. 2 and 3) that shows a higher degree of alignment for later times, hence smaller values for γ. To our knowledge, this is a novel result not only for axonal growth but for the dynamics of any type of cell cultured on the directional surface.
Variation in time of the ratio γ/D θ between the deterministic torque and the diffusion coefficient for the angular motion.
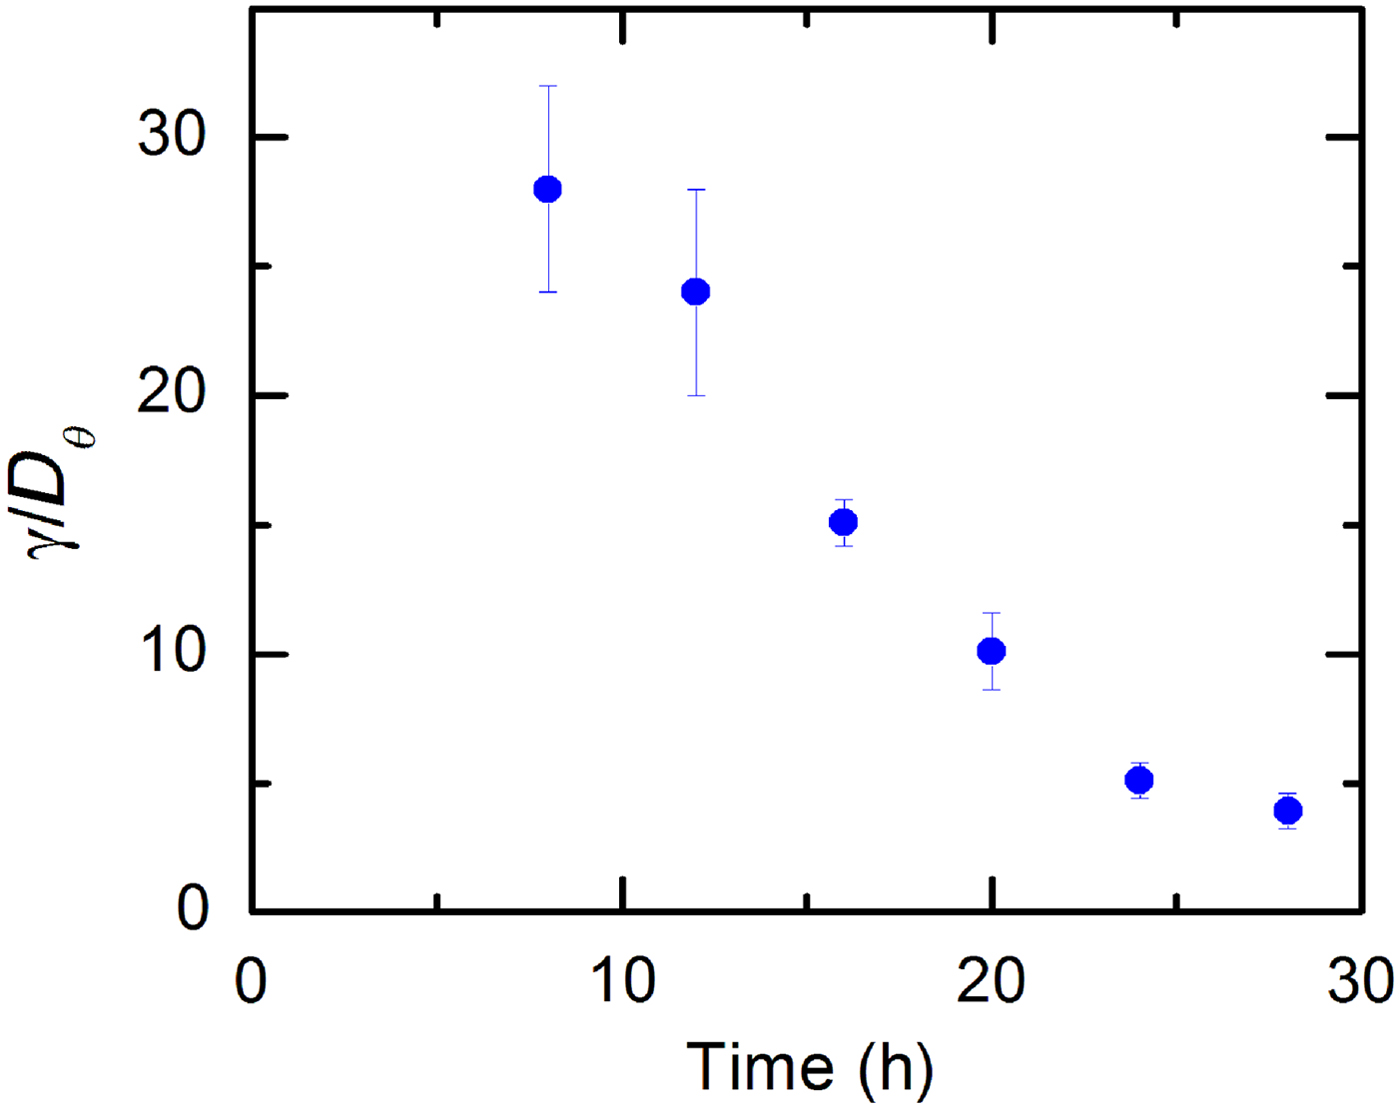
It is interesting to compare the values of ratios γ/D θ for growth on PDMS surfaces with the corresponding values measured for nano-ppx surfaces.[Reference Spedden, Wiens, Demirel and Staii10] On nano-ppx, we found these ratios in the range: 2 <γ/D θ<8.[Reference Spedden, Wiens, Demirel and Staii10] Figure 4 shows that on PDMS, γ/D θ varies between ~28 (t = 8 h) and ~4 (t = 28 h). Given that the angular diffusion coefficient D θ is similar for the two types of surfaces, we conclude that the deterministic torques measured on the micro-patterns PDMS are significantly larger than the corresponding torques on asymmetric nano-ppx. This result is consistent with the higher degree of alignment on micro-patterned PDMS surfaces observed experimentally.
In the previous work,[Reference Spedden, Wiens, Demirel and Staii10] we have related the observed directional bias in axonal growth on nano-ppx surfaces to cellular contact guidance behavior, which leads to an enhanced cell–surface coupling with increasing surface anisotropy. Contact guidance is defined as the capacity of cells to change their motion in response to geometrical features (lines, periodic patterns, curved surfaces, etc.). This phenomenon has been reported for several types of cells, such as granulocytes, fibroblasts, tumor cells, and neurons. Our experiments show contact-guidance behavior for cortical neurons cultured on PDMS surfaces with micro-patterned parallel lines: axons grow preferentially in the direction of the lines. The periodicity of the patterns (3 µm) is comparable with the dimensions of the growth cones. Previous reports have demonstrated that the directional stimulation of cellular motion is enhanced by an increased density of anchored surface receptors.[Reference Moore and Sheetz15, Reference Frey, Tsai, Russell, Hanks and Wang16] Inside the axons, the microtubules act as load-bearing structures: they are resistant to bending, and therefore produce a resistive force that opposes the bending of the growth cone. At the locations where the substrate curvature is large, the adhesion points for a growth cone bend around a steeper angle thus exerting larger forces and determining the creation of more focal adhesion points. Thus, the focal contacts on a growth cone wrapped around a high curvature structure on the PDMS surface (crest of the pattern) will experience higher traction forces than those contacting a smaller angle feature (slope of the patterns). This results in a larger value of the traction force along the features of higher curvature (crests) and consequently in a lower tendency for the axons to change the growth direction. Ultimately this leads to the alignment of axonal growth along the features of larger curvature (micro-pattern lines).
In this work, we have cultured neurons at a constant surface density (5000 cells/cm2), such that the effects of cell–cell interactions are expected to be roughly the same for all the different time points and PDMS surfaces. In the previous work,[Reference Beighley, Spedden, Sekeroglu, Atherton, Demirel and Staii9] we have explored the effects that a varying cell surface density has on the directional growth of neurons cultured on nano-ppx surfaces. We found that the directional bias imparted by surface geometry dominates the axonal alignment at low and medium cell densities (<10,000 cells/cm2) while the cell–cell interactions start to play an important role at high cell densities (above 10,000 cells/cm2). The effects of surface cell density and cell–cell interactions for neurons grown on PDMS surfaces will form the subject of a future study.
Conclusions
We have demonstrated contact-guidance behavior for cortical neuronal cells cultured on PDMS surfaces containing micro-patterned parallel lines. Axons align preferentially along the direction of the patterns. We quantify the growth cone dynamics using a general stochastic model (FP equation) and use this model to measure the effective angular diffusion (cell motility) coefficient and the deterministic torque that controls the alignment of axons on the surface. We demonstrate that the magnitude of the deterministic torque decreases in time as the axons align with the patterned lines: the higher the degree of alignment between the axon and the surface pattern, the less is the magnitude of the torque necessary to produce alignment. Our results are consistent with cellular contact guidance behavior in which the growth cones respond to changes in surface geometry (curvature of the features in the growth environment). Further experiments will explore the role that focal adhesion points and surface receptors such as integrins play in generating traction forces and in controlling axonal dynamics for neurons cultured on micro-patterned PDMS substrates. Our findings could lead to the development of novel techniques that use geometry to control the dynamics of the growth cones and the alignment of axons on surfaces.
Acknowledgments
The authors thank Prof. David Kaplan (Tufts, Biomedical Engineering) and Dr. Stephen Moss (Tufts Center for Neuroscience) for providing embryonic rat brain tissues, using Tufts University approval animal care protocols. This work was supported in part by funds from Faculty Research Award (FRAC) grant at Tufts.