Implications
This study provides an insight on the relative importance of management strategies on productivity of dairy cattle in African smallholder farming. Experimentation, although useful to improve understanding of individual factors affecting productivity, cannot be used to answer questions involving long time-spans and multiple factors – and it is often these interactions that constrain productivity at larger scales than the dairy sub-system. This modelling approach takes the main drivers of dairy production into account and was successfully tested under the conditions to which it was applied. On the one hand, it summarises the available knowledge, while on the other it highlights where more research is needed and how to target interventions.
Introduction
Feeding strategies and involuntary culling are generally the main determinants for lifetime productivity of dairy cows. In high-input dairy systems, the culling policy is based mainly on unsatisfactory reproduction performance (i.e., failure to calve for 1 to 2 consecutive years) (Bagley, Reference Bagley1993). In smallholder dairy production in sub-Saharan Africa, the evaluation of lifetime productivity of individual cows is more relevant than the short-term productivity because it allows assessing long-term investment opportunities for farmers that have few animals and face difficulties to spread risk, and therefore lifetime productivity needs to be maximised (Kebreab et al., Reference Kebreab, Smith, Tanner and Osuji2005). Smallholders do not usually implement replacement policies, because cattle are considered valuable capital assets to the household and an important pathway out of poverty (Perry et al., Reference Perry, Randolph, McDermott, Sones and Thornton2002). Production of feeds in these smallholder farming systems is highly variable in time, in both quality and quantity (Powell and Williams, Reference Powell and Williams1993). Crossbred dairy cattle achieve a productive life of between 5 to 8 years, with three to five lactations (Mukasa-Mugerwa, Reference Mukasa-Mugerwa1989), and lifetime milk production of about 9400 kg (Adeyene and Adebanjo, Reference Adeyene and Adebanjo1978). The main underlying cause of poor productivity is undernutrition resulting from feed scarcity (Kebreab et al., Reference Kebreab, Smith, Tanner and Osuji2005). Undernutrition delays puberty, which shortens the productive life of cows (Bagley, Reference Bagley1993; Osuji et al., Reference Osuji, Saarisalo, Tegegne and Umunna2005). Feeding strategies that promote early body growth may induce sexual maturity and result in a reduction of age at first calving, and of the calving intervals. Limited knowledge on the potential benefits from different feeding strategies prevents farmers from deciding how to feed cows according to their physiological status (Abate et al., Reference Abate, Dzowela and Kategile1993). High calf mortality (ranging from 10% to 45%) and a lifetime production of three to five calves also reduces the availability of females for replacements (De Jong, Reference De Jong1996). The major challenge to maximise lifetime productivity is associated with the reproduction–nutrition interactions, and with high involuntary culling rates (Vargas et al., Reference Vargas, Herrero and Van Arendonk2001). As many processes interact and the long time span that has to be investigated, experimentation can only partly help to assess the effect of management factors on lifetime productivity. Modelling techniques are then useful as dynamic models can be used to evaluate interactions and to support farmers’ decision-making. A considerable effort has focused on the study of replacement decisions (e.g. Van Arendonk, Reference Van Arendonk1985; Dijkhuizen et al., Reference Dijkhuizen, Stelwagen and Renkema1986), but few studies have addressed lifetime productivity in the tropics of sub-Saharan Africa (Kahi et al., Reference Kahi, Thorpe, Nitter, Van Arendonk and Gall2000; Ojango et al., Reference Ojango, Ducrocq and Pollott2005). The objectives of this study were: (1) to quantify the effect of feeding on the lifetime productivity of individual dairy cows using the smallholder dairy systems of the Central Highlands of Kenya as an example; and (2) to identify the best feeding strategy to maximise lifetime productivity. To achieve these objectives, we used a dynamic, individual-based model that simulates reproduction and production of cattle.
Material and methods
The dairy systems from the Central Kenyan highlands
Smallholders produce around 80% of the total milk marketed in Kenya, where supply does not yet meet the demand of the growing population. The Central Province has a relatively good access to the Nairobi market, which is the main market for farm products. In the last decades there has been a shift towards intensification of the dairy systems with stall-fed crossbred cattle. Prolonged calving intervals are often the result of farmers extending the lactation period of their cows to sustain cash flows. Earlier studies indicated that farmers feed less than 2 kg concentrate/animal per day, on average, to lactating animals (Bebe et al., Reference Bebe, Udo and Thorpe2008). The most common feedstuffs are Napier grass (Pennisetum purpureum Schumach), dry maize stover (MS) and dairy meal (concentrates). The main constraints to the production of dairy systems identified for Central Kenya are seasonal fluctuations of feed availability, poor feed quality and labour availability (Staal et al., Reference Staal, Owango, Muriuki, Kenyanjui, Lukuyu, Njoroge, Njubi, Baltenweck, Musembi, Bwana, Muriuki, Gichungu, Omore and Thorpe2001), and high mortality rates in all age classes (Bebe et al., Reference Bebe, Udo, Rowlands and Thorpe2003b).
Model description
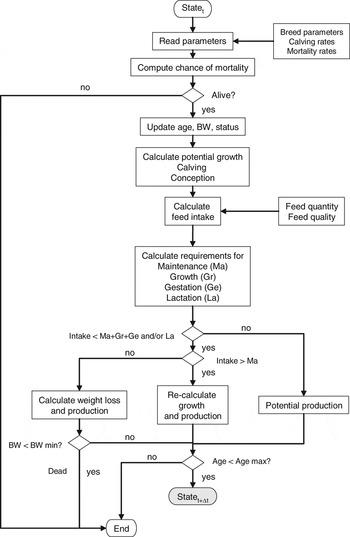
LIVSIM (LIVestock SIMulator) is a dynamic model based on the principles of production ecology (Van de Ven et al., Reference Van de Ven, De Ridder, Van Keulen and Van Ittersum2003). Following these principles, LIVSIM simulates the performance of individual animals in time according to their genetic potential and feeding. Potential production is defined by mature weight, growth rate and milk yield. Figure 1 shows a flow diagram of the model. The model has been designed to evaluate the impact of farmer’s resource allocation on animal productivity. In the model, the only discrete events that are triggered stochastically are conception, sex of the calves and random mortality (involuntary culling). Mortality due to undernutrition, abortion, parturition, age and weight are described deterministically, and simulated using growth and weight loss routines with a minimum bodyweight as threshold. Intake is driven by feed quality and bodyweight. Reproductive performance is evaluated using days to first conception, days open (days between calving and next conception), calving interval and length of the productive life (age at disposal date minus age at first calving date). Productivity may be assessed by number of offspring, milk production, weight gain and manure production. The model is written in MATLAB v.7.0.4 (The MathWorks Inc., Natick, MA, 2005), and the integration time-step was set at 30 days. The basic structure is based on the concepts of the model developed by Konandreas and Anderson (Reference Konandreas and Anderson1982). LIVSIM differs from that model in: (i) the nutritive requirement calculations which are based on AFRC (1993), (ii) feed intake which is based on the model of Conrad (Reference Conrad1966). Furthermore, (iii) excreta production is estimated in LIVSIM, and (iv) decision-making variables (management strategies related to feeding and reproduction) are also included. Potential growth and minimum bodyweight curves were derived by fitting a simplified Brody model to data on the mature weight and growth rates of Friesian × Zebu cattle found in the literature (Kabuga and Agyemang, Reference Kabuga and Agyemang1984; Agyemang and Nkhonjera, Reference Agyemang and Nkhonjera1990; Lanyasunya et al., Reference Lanyasunya, de Jong, Nyakira and Mukisira2000; Jenet et al., Reference Jenet, Fernandez-Rivera, Tegegne, Yimegnuhal, Osuji and Kreuzer2004a). Compensatory growth is accounted for in the model by using different potential growth rates according to the metabolic value of the feed (Tolkamp and Ketelaars, Reference Tolkamp and Ketelaars1994). We used the approach of Konandreas and Anderson (Reference Konandreas and Anderson1982) and data from the literature to determine a feasible age–bodyweight set when heifers achieve reproductive maturity (Trail and Marples, Reference Trail and Marples1968; Knudsen and Sohael, Reference Knudsen and Sohael1970; Agyemang and Nkhonjera, Reference Agyemang and Nkhonjera1990; Masama et al., Reference Masama, Kusina, Sibanda and Majoni2003; Ongadi et al., Reference Ongadi, Wakhungu, Wahome and Okitoi2007). The conception rate is a function of body condition, presence of bull and age of the cow. Calf birth weight is a breed-dependent input to the model. Milk yields are simulated deterministically by using a breed-dependent potential milk yield curve, which is a function of lactation length and is affected by age and the condition of the cow. Lactation length and dry period are characteristics of the system and inputs to the model. It was assumed that calves are weaned at 4 months of age and that the milk allowance for calves starts with 4 l of milk per day at calving and decreases to 0.5 l per day at weaning.
Flow diagram illustrating the structure of LIVSIM (LIVestock SIMulator). Feed intake is compared with nutrient requirements for potential production. When these are not met, a set of priority rules is used to partition energy and protein into lactation, gestation, growth and maintenance requirements. Once production is calculated and if maximum age is not reached, and if the animal is not dead, a next time step (Statet + Δt) is simulated.

Model parameterisation and model testing
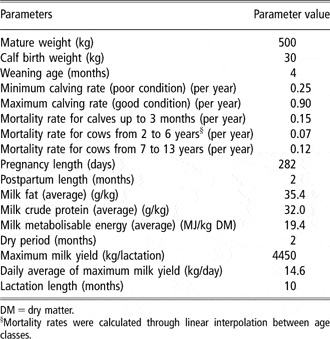
Model inputs and model parameters are presented in Table 1. Individual components of the model were tested against experimental data on age, bodyweight, feed intake, feed quality and milk production from 24 crossbred Friesian Holstein × Boran cows (Jenet et al., Reference Jenet, Yimegnuhal, Fernandez-Rivera, Tegegne, Osuji, McCrabb and Kreuzer2004b). Cows were fed different diets equivalent to 1, 1.2 and 1.4 times the metabolisable energy (ME) requirement for maintenance, calculated as suggested by the Ministry of Agriculture Fisheries and Food – MAFF (1987). The diet consisted of Bermuda grass (Cynodon dactylon L.) hay (65% of the diet), supplemented with wheat bran (35% of the diet). Cows were 3.7 ± 0.2 and 4.9 ± 0.3 years at the beginning of the first and second lactation, and the bodyweight ranged according to the feeding level from 360 to 420 kg and from 350 to 410 kg at the start of the first and second lactation, respectively. We selected the low (maintenance) and high (1.4 × maintenance) feeding levels for the model tests. Intake of the cows at the low level (maintenance) was on average 3.2 ± 0.1kg of hay and 1.8 ± 0.1 kg wheat bran per day over the whole lactation period. At the high feeding level (1.4 × maintenance), intake was 5.1 ± 0.3kg of hay and 2.8 ± 0.2 kg wheat bran per day. There were differences in bodyweight loss during early lactation between the first and the second lactation. This was calibrated in the model by using a bodyweight loss allowance, which mirrored the lactation curve. The best fits were obtained with a maximum bodyweight allowance of 0.7 kg per day in the first lactation and 0.6 kg per day in the second lactation. The normalised root of the square mean errors (NRMSE) were 15% and 17% at the high feeding level and first and second lactations, and 7% and 10% at the low feeding level and first and second lactation, respectively. The differences in milk yields were larger between feeding levels than between lactations. The NRMSE were 9% and 7% at the high and low feeding levels, respectively. More details on model inputs and parameters can be found in Rufino et al. (Reference Rufino, Herrero, Van Wijk, Dury, De Ridder and Giller2008).
LIVSIM (LIVestock SIMulator) model inputs and parameters

DM = dry matter.
§Mortality rates were calculated through linear interpolation between age classes.
Scenario analyses
To evaluate the relative impact of feeding on the lifetime productivity of the cows we first analysed the effect of different diets on lifetime productivity (Scenario 1), and on reproductive performance (Scenario 2), and the combined effect of diets and random mortality on lifetime productivity (Scenario 3).
Scenario 1: Supplementing diets
The recommended practice for the smallholder dairy systems in Kenya is to supplement the basal diet of lactating cows with concentrates at a rate of 2 kg per day during the entire lactation (Staal et al., Reference Staal, Owango, Muriuki, Kenyanjui, Lukuyu, Njoroge, Njubi, Baltenweck, Musembi, Bwana, Muriuki, Gichungu, Omore and Thorpe2001). Increasing the ration of concentrates during early lactation was recommended to increase the milk yield of individual lactations (Kaitho et al., Reference Kaitho, Biwott, Tanner, Gachuiri and Wahome2001). To test the effect of supplements on indicators of lifetime productivity, different rations of concentrates were used in model simulations to target different physiological stages. All females were offered a basal diet of Napier grass ad libitum. For the treatments ‘Napier + 2 kg’, ‘Napier + 4 kg’ and ‘Napier + 8 kg’ cows were supplemented with a total of 600 kg in 305 days, i.e., either with 2 kg of concentrate per day during the whole lactation (0 to 305 days), 4 kg per day in early lactation (0 to 150 days), or 8 kg per day during only the first 75 days of lactation. The quality of the feeds is shown in Table 2. For this scenario, involuntary culling (random mortality) was set to zero to evaluate the sole effect of the diets.
Quality parameters of different feedstuffs commonly used in the highlands of Central Kenya, which were used in the simulations of the different scenarios

DM = dry matter; DMD = dry matter digestibility; ME = metabolisable energy.
Scenario 2: Diet composition and reproductive performance
Increasing the number of lactations through improving nutrition has been suggested as one of the key interventions to improve productivity of dairy smallholders (Osuji et al., Reference Osuji, Saarisalo, Tegegne and Umunna2005). We compared the effect of contrasting diets (that represents common practices in the Kenyan highlands) on age at first calving and calving intervals. Napier grass was supplemented with finely chopped MS from January to March and from July to September (Napier + MS). The second diet was the same but supplemented with 2 kg dairy concentrates per day during the whole lactation (Napier + MS + 2 kg). The third diet was designed to meet the nutritive requirement by varying the amounts of supplemented concentrates according to the physiological stage of the animal (Napier + MS optimal). This diet consisted of Napier grass supplemented with small amounts of concentrates (0.5 kg per day) during calf and heifer development and dry periods, 5 kg during the first 150 days of lactation and 1 kg during the rest of the lactation. All these diets were compared with the sole Napier grass diet (Napier).
Scenario 3: Lifetime productivity with random mortality
Diets from the previous scenario were selected to evaluate the effect of feeding strategies and mortality on indicators of lifetime productivity. Bebe et al. (Reference Bebe, Udo, Rowlands and Thorpe2003b) reported mortality rates for different age classes in Central Kenya (Table 1), where diseases were the main cause of involuntary culling. By using random mortality rates we withdrew individuals from the simulated population that represent an average dairy cow, for which we evaluated lifetime productivity. For the analysis, it was assumed that every cow has the same probability per time-step to be removed from the simulated population, and that cows may reach the average maximum lifetime reported by Bebe et al. (Reference Bebe, Udo, Rowlands and Thorpe2003b) for the case study area, irrespective of the feeding management.
Running the model
In the simulations, we assumed that an average cow reaches a maximum age of 13 years, with typical mortality rates for different ages classes as presented in Table 1 (Bebe et al., Reference Bebe, Udo, Rowlands and Thorpe2003b). Because the model simulates discrete events by using stochastic variables, replications were needed to estimate the distributions of the output variables. We performed simulation experiments to evaluate the minimum number of runs, i.e. replicates that capture the effect of the treatments. For these tests we used the treatments described in Scenario 1 and replicated this 100, 500, 1000, 5000, 10 000 and 20 000 times. The model outputs were analysed with the Kruskal–Wallis non-parametric test. A minimum of 1000 runs was necessary to detect significant differences (P < 0.05) between the treatments (data not shown). Increasing the number of runs (>1000) did not change the contrasts between treatments.
A number of variables and efficiency ratios were selected to evaluate lifetime productivity. Selected variables were number of calves, cumulative milk production (kg/lifetime), milk yield (kg/lactation), days in milk (% per lifetime), days open (days/parity), cumulative gross income (Kenyan Shillings (KSh)/lifetime; 1 US$ = 67 KSh in 2007), income from milk (KSh/lifetime), and income from calves sales (KSh/lifetime). Efficiency ratios were milk production per day in milk (kg/day), milk production per day open (kg/day open), milk per day of lifetime (kg/day lifetime), days in milk per day of lifetime (day/day lifetime), income per day in milk (KSh/day), and income per day of lifetime (KSh/day lifetime).
Statistical analyses
The effect of the treatments on indicators of lifetime productivity was evaluated with the non-parametric Kruskal–Wallis test, and the differences between treatments were tested using the Wilcoxon–Mann–Whitney test. We report medians (m), means, ranges and probabilities. SPSS 15.0 for Windows (SPSS Inc., Chicago, IL) was used to perform the statistical analysis. The statistical technique called survival analysis was developed in medical sciences (Kleinbaum and Klein, Reference Kleinbaum and Klein2005), where the event of interest was death. However, this technique can be used for analysing the timing of other events. Survival analysis was used here to evaluate the effect of diets on age at first calving, calving intervals and productive life. Survival analysis or time-to-event analysis was performed with R 2.6.0 (The R Foundation for Statistical Computing). Observations were censored when cows did not experience the event during the simulation. Kaplan–Meier (KM) survival functions were used for estimating time to the occurrence of the event (Kleinbaum and Klein, Reference Kleinbaum and Klein2005). From the survival curves, expressing the probability (at the y-axis) that the event of interest happens after the time (on the x-axis), we estimated the median survival time at the point where the KM-curve equals 0.5. Log-rank tests were used to assess whether different treatments (diets) show a significant effect on the age at first calving and the length of the productive life. Cox regression models were used for estimating the effects of covariates on the calving rate and therewith on the calving intervals. The Wald statistic (z) was used to test significance. The extended Cox model incorporates time-independent and time-dependent explanatory variables (Haccou and Hemerik, Reference Haccou and Hemerik1985). The hazard function is expressed as a function of time (equation
(1)):
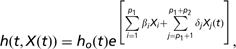
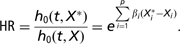
where X(t) = X 1,…, Xp 1, Xp 1 + 1 (t),…, Xp 1 +p 2(t)) is a vector of explanatory variables, βi (i = 1,…, p 1) is the regression coefficient for the time-independent explanatory variable Xi, δj (j = p 1 + 1,…, p 1 +p 2) is the regression coefficient for the time-dependent explanatory variable Xj. The explanatory variables were the diets (fixed factors), and the different components of the diet that were time-dependent. Bodyweight was considered as confounder of the effect of the explanatory variable. When diets were considered as factors, the reference diet caused the longest calving interval. MS and concentrates were coded as factor variables and bodyweight as a continuous variable. The effect of the different diets was measured with the hazard ratio (HR) that describes how a baseline event rate is changed due to a change in the covariates Xi (equation
(2)). The vector of covariates X* usually represents the group with the largest hazard (i.e., shortest calving interval) in order to facilitate the interpretation of the HR. A HR of 1 means no effect, a value of 10 means that one treatment has 10 times the hazard of the other treatment, and in this case an increased ‘risk’ of shortening calving intervals.
Results
Supplementing diets and indicators of lifetime productivity (Scenario 1)
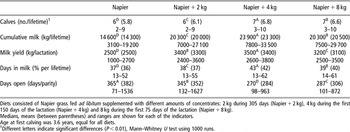
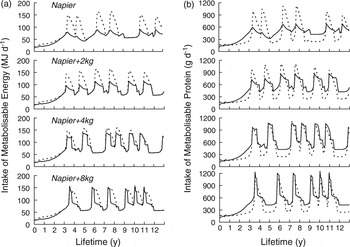
Supplementing the Napier grass diet with different amounts of concentrates throughout the lactation resulted in significant changes in all indicators of lifetime productivity (Table 3). The ‘Napier + 4 kg’ diet resulted in the largest number of calvings (m = 7) and milk production (m = 23 900 kg/lifetime), the most days in milk (m = 43% per lifetime), and the shortest average days open (m = 270 days/parity). Simulations showed that both intake of ME and CP were not matching the requirement for potential production during the entire lifetime (Figure 2). For all treatments, CP was in surplus during the dry periods. The ‘Napier + 4 kg’ diet resulted in higher production of milk because it met the nutritional requirements over time more closely than the other three diets. Although the diet supplemented with 8 kg of concentrates (Napier + 8 kg) allowed the nutritional requirement at peak lactation to be met, it resulted in energy and protein deficiency during the rest of the lactation, and in a protein surplus when the cow was not lactating.
Effect of different diets on indicators of lifetime productivity

Diets consisted of Napier grass fed ad libitum supplemented with different amounts of concentrates: 2 kg during 305 days (Napier + 2 kg), 4 kg during the first 150 days of the lactation (Napier + 4 kg) and 8 kg during the first 75 days of the lactation (Napier + 8 kg).
Medians, means (between parentheses) and ranges are shown for each of the indicators.
Age at first calving was 3.6 years, equal for all diets.
1Different letters indicate significant differences (P < 0.01), Mann–Whitney U test using 1000 runs.
(a) Metabolisable energy (ME) requirements for potential production (dashed lines) and intake of ME (solid lines), (b) Metabolisable protein (MP) requirements for potential production (dashed lines) and intake of MP (solid lines). Diets consisted of Napier grass fed ad libitum without supplements (Napier) or supplemented with different amounts of concentrates: 2 kg per day during 305 days of lactation (Napier + 2 kg), 4 kg during the first 150 days of lactation (Napier + 4 kg) and 8 kg per day during the first 75 days of lactation (Napier + 8 kg).

The ‘Napier’ and the ‘Napier + 2 kg’ diets resulted in large losses in bodyweight after calving because of the high energy requirement for milk production. These losses were smaller for the ‘Napier + 4 kg’ and ‘Napier + 8 kg’ diets. Cows could potentially consume a maximum of about 12 kg dry matter (DM)/day of Napier of the quality used in the simulations. Total DM intake was increased as the supplements of better quality were all consumed, which resulted in significant differences in forage consumption between diets. Cows fed the ‘Napier + 4 kg’ diet consumed the largest amount of forage and concentrate (40.6 and 4.7 t/lifetime of forage and concentrates, respectively) and cows fed the ‘Napier’ diet consumed the least (38.5 and <0.1 t/lifetime of forage and concentrates, respectively).
Reproductive performance and lifetime productivity (Scenario 2)
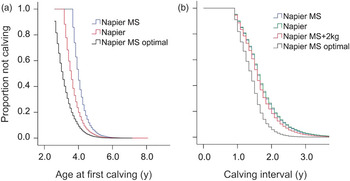
We designed an ‘optimal’ diet that followed the cows’ energy requirement more closely. The KM-curves and lon-rank tests showed that the diets had a significant effect on age at first calving (Figure 3a). Median age at first calving was 3.08 ± 0.01 years for the ‘Napier + MS optimal’ diet, 3.58 ± 0.01 years for the ‘Napier’ diet, and 4.00 ± 0.01 years for the ‘Napier + MS’ diet. The ‘Napier + MS + 2 kg’ diet was not included in Figure 3a, because the effect on age at first calving was the same as that for the ‘Napier + MS’ diet since supplementation started only after the first calving. The supplemented diets (Napier + MS + 2 kg and Napier + MS optimal) had a significant effect on reducing the calving intervals compared with the ‘Napier + MS’ and ‘Napier’ diets. Median calving intervals (which excluded age at first calving) were 1.17 ± 0.01 and 1.58 ± 0.01 years for the ‘Napier + MS optimal’ and the ‘Napier + MS + 2 kg’ diets, respectively, and 1.67 ± 0.01 years for the ‘Napier’ and ‘Napier + MS’ diets (Figure 3b).
Kaplan–Meier survival curves for: (a) Age at first calving of cows fed three different diets: sole Napier grass, Napier grass supplemented with maize stover (Napier + MS) and Napier grass supplemented with 0.5 kg concentrates per day except during early lactation (5 kg) and late lactation (1 kg) (Napier + MS optimal), and (b) Calving intervals for cows fed four diets: three diets the same as in (a), plus Napier grass supplemented with maize stover and 2 kg of concentrates per day during the whole lactation (Napier + MS + 2 kg).

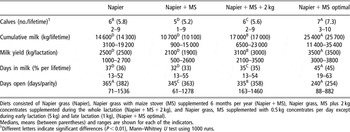
Diet had a significant effect on the median productive life span, with 9.92 ± 0.01, 9.42 ± 0.01 and 8.92 ± 0.01 years for ‘Napier + MS optimal’, ‘Napier’ and ‘Napier + MS’ diets, respectively. The seasonal addition of MS to the Napier grass diet reduced productive life of the cows and had a negative effect on all indicators of lifetime productivity (Table 4). This effect was more pronounced for the ‘Napier + MS’ diet due to the energy deficit during the lactation periods. Supplementing the ‘Napier + MS’ diet with concentrates increased milk production by 1000 to 1400 kg of milk per lactation. Days open were smallest for the ‘Napier + MS optimal’ diet (m = 240 days/parity), followed by the ‘Napier + MS + 2 kg’ (m = 335 days/parity), ‘Napier + MS’ (m = 345 days/parity), and finally by the ‘Napier’ (m = 365 days/parity) diets. Adding concentrates to the ‘Napier + MS’ diet improved cumulative milk yield considerably, by about 60%, by feeding the ‘Napier + MS + 2 kg’ diet and more than 100% by feeding the ‘Napier + MS optimal’ diet.
Effect of diet on indicators of lifetime productivity

Diets consisted of Napier grass (Napier), Napier grass with maize stover (MS) supplemented 6 months per year (Napier + MS), Napier grass, MS plus 2 kg concentrates supplemented during the whole lactation (Napier + MS + 2 kg), and Napier grass, MS supplemented with 0.5 kg concentrates per day except during early lactation (5 kg) and late lactation (1 kg), (Napier + MS optimal).
Medians, means (between parentheses) and ranges are shown for each of the indicators.
1Different letters indicate significant differences (P < 0.01), Mann–Whitney U test using 1000 runs.
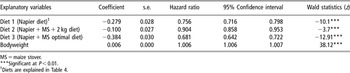
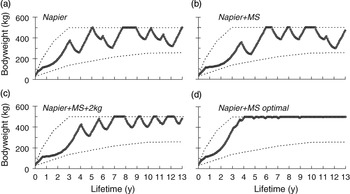
The ‘Napier + MS’ diet was used as reference for a Cox regression analysis because it resulted in the oldest age at first calving (Figure 3a), and the smallest number of calves per lifetime (Table 4). In the first Cox model, diets were considered fixed factors, i.e. the other three diets were compared with the reference diet. The results of the regression analysis showed that all the diets had a significant effect on reducing calving intervals, using bodyweight as a covariate (Table 5). The HRs indicated that the diets shortened calving intervals with respect to the ‘Napier + MS’ diet when there was at least an average difference in bodyweight of 46 kg between cows fed the ‘Napier’ diet or the ‘Napier + MS’ diet, or an average difference in bodyweight of 17 and 64 kg for the ‘Napier + MS + 2 kg’ diet and for the ‘Napier + MS optimal’ diet, respectively, in comparison to the ‘Napier + MS’ diet. These differences in bodyweight were observed for all treatments as shown in Figure 4.
Effects of the diets as fixed factors on calving intervals estimated with an extended Cox model using 1000 runs

Development of the cow’s bodyweight when fed: (a) Sole Napier grass (Napier), (b) Napier grass supplemented seasonally with maize stover (Napier + MS), (c) Napier grass supplemented with maize stover and 2 kg concentrate per day during the whole lactation (Napier + MS + 2 kg) and (d) Napier grass supplemented with 5 kg concentrate during the first 150 days of the lactation and 1 kg per day the remaining of the lactation. The upper dashed line shows the potential growth curve and the lower dashed line the minimum bodyweight.

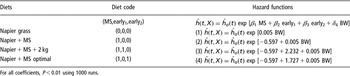
Because the effect of the diets is time dependent, we examined separately the effect of seasonal supplementation with MS and the effect of supplementation with different amounts of concentrate during early lactation, when the largest bodyweight losses occur. The hazard functions for each of the diets are shown in Table 6. All coefficients shown were significant (P < 0.01). The addition of MS to the diets increased calving intervals by halving the hazard rate. This effect was outweighed by supplementing concentrates as shown by the coefficients β 2 and β 3 in Table 6, which differed between the ‘Napier + MS + 2 kg’ and ‘Napier + MS optimal’ diets. At the same bodyweight difference caused by the diets, the ‘Napier + MS + 2 kg’ diet would result in the shortest calving interval. The difference between the ‘Napier + MS optimal’ diet and the ‘Napier + MS + 2 kg’ diet is highlighted in Figure 3, where the optimal diet shortened the calving interval. A difference in bodyweight of approximately 100 kg (=(2.232 − 1.727)/0.005, see hazard rates (3) and (4) in Table 6) during the calving interval results in approximately the same hazard rate (probability of conception per time interval) for ‘Napier + MS optimal’ diet and the ‘Napier + MS + 2 kg’ diet.
Estimated coefficients (β and δ) and hazard functions for the effect of the covariates maize stover (MS), concentrates offered at 2 kg per day during early lactation (early1) for the ‘Napier + MS + 2 kg’ diet, and 5 kg (early2) for the ‘Napier + MS optimal’ diet

For all coefficients, P < 0.01 using 1000 runs.
Lifetime productivity and mortality (Scenario 3)
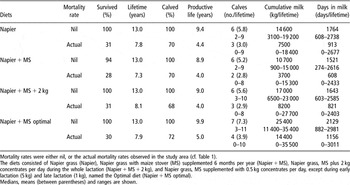
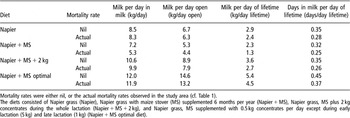
With the random mortality rates used in the simulations (Table 1), only 28% to 31% of the cows survived 13 years. Average lifetime ranged between 7.3 and 8.1 years for different diets, and between 68% and 72% of the cows that survived calved at least once (Table 7). Productivity indicators for the cows that calved were reduced by 43% to 65% depending on the diet. Milk production could be increased on average by 1400 kg per lactation by supplementing the diet with 5 kg of concentrates (of the quality indicated in Table 2) during early lactation and 1 kg during late lactation. However, for smallholders who do not have a large investment capacity, reducing mortality helps to secure the asset and increase productivity. When productive life is significantly shortened compared with the theoretical productive life of an average dairy cow, the positive effects of the diets on early growth and reproduction disappear. The ‘Napier + MS’ diet with the baseline mortality resulted in 3700 v. 10 700 kg of milk per lifetime that may be obtained if there was no involuntary culling (Table 7). Supplementing the cows with 2 kg of concentrate (including random mortality) increased the lifetime productivity to 8200 kg of milk. This is half of what could be achieved (17 000 kg of milk) if cows were able to reach the maximum lifetime. Involuntary culling reduced the productive life, amount of milk produced per day of lifetime, and the days in milk per day of lifetime (Table 8).
Effect of diet and random mortality on indicators of lifetime productivity

Mortality rates were either nil, or the actual mortality rates observed in the study area (cf. Table 1).
The diets consisted of Napier grass (Napier), Napier grass with maize stover (MS) supplemented 6 months per year (Napier + MS), Napier grass, MS plus 2 kg concentrates per day during the whole lactation (Napier + MS + 2 kg), and Napier grass, MS supplemented with 0.5 kg concentrates per day, except during early lactation (5 kg) and late lactation (1 kg), named the Optimal diet (Napier+MS optimal).
Medians, means (between parentheses) and ranges are shown.
Effect of diet and mortality on lifetime efficiency ratios

Mortality rates were either nil, or the actual mortality rates observed in the study area (cf. Table 1).
The diets consisted of Napier grass (Napier), Napier grass with maize stover (MS) supplemented 6 months per year (Napier + MS), Napier grass, MS plus 2 kg concentrates during the whole lactation (Napier + MS + 2 kg), and Napier grass, MS supplemented with 0.5 kg concentrates per day except during early lactation (5 kg) and late lactation (1 kg) (Napier + MS optimal diet).
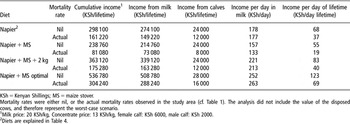
We calculated that milk represented about 90% of the total revenue from an average cow. In the simulations, diet had a larger effect on economic indicators than random mortality. The cost of a day open increased as the quality of the diet improved. Income per day in production was also greatly affected by the diet, and decreased when mortality increased because of its effects on reducing number of lactations. Income per day of lifetime was both affected by diet and mortality due to the effect of diet on milk production and the effect of mortality on shortening productive life. The baseline mortality of 15% for young calves, of 7% for cows in production (2 to 6 years) and 12% for older cows, accounted for about 40% to 65% of income reduction (Table 9).
Effect of factors affecting indicators of lifetime productivity and economic indicators

KSh = Kenyan Shillings; MS = maize stover.
Mortality rates were either nil, or the actual mortality rates observed in the study area (cf. Table 1). The analysis did not include the value of the disposed cows, and therefore represent the worst-case scenario.
1Milk price: 20 KSh/kg, Concentrate price: 13 KSh/kg, female calf: KSh 6000, male calf: KSh 2000.
2Diets are explained in Table 4.
Discussion
Designing diets to maximise lifetime productivity
The allocation of different amounts of concentrates throughout the lactation showed the advantages in terms of lifetime productivity of the diet that more closely followed the peak energy requirements of the cows. Supplementing grass hay with 8 kg of concentrates per day during the first 75 days of lactation produced significantly more milk than supplementing with 4 kg during 150 days or 2 kg during the whole lactation in the experimental work of Kaitho et al. (Reference Kaitho, Biwott, Tanner, Gachuiri and Wahome2001). This supplementation could be withdrawn after early lactation without decreasing milk production. Our simulations identified a best fit strategy that differs from that of Kaitho et al. (Reference Kaitho, Biwott, Tanner, Gachuiri and Wahome2001), which is due to the different temporal scales used for the analysis (individual lactations v. lifetime), and probably also due to the large inherent variability between cows in feeding experiments and the quality of the supplements. In our study, the diet of Napier grass supplemented with 8 kg of concentrates met the nutritional requirements at peak milk production. However, the energy deficit during the rest of the lactation resulted in less cumulative milk production, in more bodyweight loss and poor body condition, which had a negative impact on the calving rates. Targeting supplementation to early lactation has a major effect on the performance of the whole lactation. Our study shows that supplementing 8 kg of concentrates only during early lactation may improve the milk yield of the first two lactations but, in the longer term, the body condition of the cows fed the ‘Napier + 4 kg’ was better, resulting in better reproductive performance. Small amounts of concentrates supplemented during early stages of the animal development followed by 5 kg during early lactation allowed a three-fold increase in milk during the lifetime of the cow, due to the stabilising effect on bodyweight. Our results confirm empirical studies indicating that improving feed quality results in higher milk yield, increases productive life by reducing age at first calving and days open of crossbred cows fed tropical forages (Vargas et al., Reference Vargas, Herrero and Van Arendonk2001).
Farmers’ keep cattle in the Central highlands of Kenya to produce milk for the market – a regular source of cash – and for family consumption, with minimal risk associated to the investments in inputs for cattle (Bebe et al., Reference Bebe, Udo, Rowlands and Thorpe2003a). Disposal decisions are rarely based on productive reasons and farmers keep cattle as long as they provide cash income, play insurance and finance roles, or provide manure for enhancing productivity of crops. This emphasises the need to look for opportunities for improvements in lifetime productivity as opposed to short-term productive increments per lactation period. The diet that would allow potential milk yield to be achieved has to be balanced to avoid protein surpluses during the dry periods. The blanket recommendation of supplementing dairy cows with 2 kg of concentrates per day during lactation (Staal et al., Reference Staal, Owango, Muriuki, Kenyanjui, Lukuyu, Njoroge, Njubi, Baltenweck, Musembi, Bwana, Muriuki, Gichungu, Omore and Thorpe2001) needs to be replaced to provide farmers with more knowledge on how to feed their animals according to the price of milk and of feedstuffs, and to maximise lifetime productivity by maintaining body condition.
Smallholders usually purchase less fodder when crop residues are available (Romney et al., Reference Romney, Utiger, Kaitho, Thorne, Wokabi, Njoroge, Chege, Kirui, Kamotho and Staal2004). Adding MS to the Napier grass diet delayed age at first calving and prolonged calving intervals as shown by the survival analyses, with relatively strong economic consequences. The diet that appears to be a ‘risk minimising feeding strategy’ from an economic perspective, actually increased calving intervals, and therefore reduced income from milk. Keeping animals in good body condition is needed to ensure reproduction and increase productive life. Supplementation with concentrates partly helped to compensate for the negative effect of adding MS. The degree of compensation clearly depended on the magnitude of the bodyweight increase during the calving interval. A major challenge for research is to design realistic management strategies to match the production potential of the cows with the available resources. The costs of feeding forages were slightly higher for the supplemented diets, but the income derived from feeding sole Napier grass diets was reduced because of the longer non-productive periods when cows consume only Napier grass. The cost of concentrates accounts for about 15% to 20% of the gross income, while supplementing Napier grass with concentrates results in a two-fold increase in gross income. Most dairy farmers in Central Kenya allocate around 9% to 22% of their land to grow Napier grass, amounting to about 0.13 ha per TLU (tropical livestock unit) on average (Bebe, Reference Bebe2008). With an average yield of 16 t DM/ha per year, with six cuttings per year and little or no fertiliser (Muia, Reference Muia2000), only between 12% to 18% of the Napier consumption requirements per year for one cow may be covered. The feed deficit has to be filled with feed purchased from the market. Because milk accounts for about 90% of the total gross income from dairy, selling calves to purchase feedstuffs appears to be sensible to increase lifetime productivity.
Lifetime productivity and involuntary culling
The adoption of improved technologies requires market stability so that the associated risks are reduced (Romney et al., Reference Romney, Thorne, Lukuyu and Thornton2003). Supplementing Napier grass with high-quality feeds to match nutrient requirements helps to reduce risk in cattle production and to secure daily cash flows. Our results suggest that it is feasible to increase lifetime productivity of dairy cows in smallholder systems of Central Kenya, by reducing the involuntary culling rates in conjunction with improved diets, which requires institutional support. We estimated the production gap of an average cow due to involuntary culling, and what could be gained through improving feeding strategies. This showed that the effect of improving the diet is relatively smaller than increasing lifetime (cf. Tables 7 and 8), assuming that cows reach the same average maximum lifetime independently of the feeding management. For example, supplementing cows fed with Napier grass and MS with concentrates has a smaller effect in lifetime milk production than increasing lifetime, even though milk yields of the individual lactations are smaller without supplementation. High income was associated with both feeding concentrates and small investments in health services in a study by Van Schaik et al. (Reference Van Schaik, Perry, Mukhebi, Gitau and Dijkhuizen1996), where milk production and calving intervals were the main indicators describing the performance of dairy farms. Similarly, Ngategize (Reference Ngategize1989) found that the benefits (higher milk production, higher offtake and higher capital value) of increasing animal survival by 5% in Northern Tanzania exceeded the costs of implementing a disease control programme. In our study, we used the average mortality rates reported for Central Kenya, where diseases and cash needs were the main reasons why animals were removed from the herd whereas poor performance explained only 5% to 10% of disposal. Diarrhoea, followed by pneumonia were the most common causes of sickness and mortality in an extensive on-farm study carried out in Central Kenya (Gitau et al., Reference Gitau, McDermott, Waltnertoews, Lissemore, Osumo and Muriuki1994), where mortality of calves was as high as 22%. The use of bedding and infrequent cleaning of cattle sheds were related to higher mortality (Gitau et al., Reference Gitau, McDermott, Waltnertoews, Lissemore, Osumo and Muriuki1994). Focusing on improving diets may have an impact on lifetime productivity and cash flows if productive life is not reduced excessively by involuntary disposal. Poor farmers, feeding poor diets, have more to gain in terms of a higher and more secure income from reducing involuntary culling than from investing only in feeds.
The model used for this study needs to include in the future the effect of various stresses on cattle production such as chronic diseases and heat stress. A simple approach for including the effect of heat stress is that used by King et al. (Reference King, Parsons, Turnpenny, Nyangaga, Bakari and Wathes2006). We did not include adaptive management in our modelling approach, which is very important in resource-limited systems. For example, the feeding strategies were simplified to capture large differences over the long-term, but farmers would adjust feeding of animals in an opportunistic fashion, depending on cash availability and labour constraints and therefore the overall quality of the diet changes in time. The quality of the diet also varies between seasons and between years, which of course impacts on animal production. However, the approach we followed was useful to explore the magnitude of the effect of changes in feeding management that may result in benefits at farm scale. Adding stochasticity to the milk and forage production, to the supply and demand for inputs (concentrates), factors (labour, cows) and products (milk, forage) would allow risk to be analysed at farm scale in the dairy systems of the highlands of Kenya.
Conclusions
Lifetime productivity of dairy systems can be improved by increasing feed intake through targeting productive animals and adding good quality supplements to the poor basal diets. Calving at an early age and short calving intervals should also be goals in smallholder dairy farming, otherwise farmers do not perceive the return to the large investments in animal capital. Supplementing diets with concentrates, which target physiological stages of high nutrient requirements, allows large increments in lifetime productivity. The feeding strategies need to fit the broader livelihood objectives of smallholder farmers. Blanket recommendations for feeding dairy cattle need to be replaced to provide farmers with the knowledge needed to target feeding to meet the nutritive requirement of the animals and match their investment capacity. If optimised diets are used without aiming at reducing current mortality rates, farmers are prevented from earning higher and more stable incomes. Improving lifetime productivity requires investments both in diet quality and to reduce disease-related mortality rates.
Acknowledgements
We thank the European Union for the partial funding of this research through the AfricaNUANCES Project (Contract no INCO-CT-2004-003729). We are grateful to Panos Konandreas for clarifying concepts from the model used as the basis for LIVSIM, to Andreas Jenet, Rob Delve and Agustin Ayantunde for providing data used to test the model, and to Henk Udo, Simon Oosting and Bill Thorpe for useful exchange of ideas during model development and testing. Any error or omission in this article is the full responsibility of the authors.