




No CrossRef data available.
Evaluating the Trial-Heat and Economy Forecast of the 2004 Presidential Vote:All's Well that Ends Well
Published online by Cambridge University Press: 06 April 2005
Extract
On Labor Day, 57 days before the election, using the Gallup poll's division of likelyvoters and GDP growth during the second quarter of the year, the trial-heat and economyforecasting model predicted that George W. Bush would receive 53.8% of the two-party popularvote (Campbell 2004a). Out of concerns about relying too heavily on a single poll and thepossible complications associated with the Republican Convention running right up to theLabor Day weekend, a companion model based on the pre-convention Gallup poll, the netconvention poll bump, and the economy was constructed. It forecast a slightly closerelection, with a Bush vote of 52.8%.
Information
- Type
- Symposium
- Information
- Copyright
- © 2005 by the American Political Science Association
On Labor Day, 57 days before the election, using the Gallup poll's division of likely voters and GDP growth during the second quarter of the year, the trial-heat and economy forecasting model predicted that George W. Bush would receive 53.8% of the two-party popular vote (Campbell 2004a). Out of concerns about relying too heavily on a single poll and the possible complications associated with the Republican Convention running right up to the Labor Day weekend, a companion model based on the pre-convention Gallup poll, the net convention poll bump, and the economy was constructed. It forecast a slightly closer election, with a Bush vote of 52.8%.
Forecast Accuracy
By the metrics of accuracy I offered in the October symposium (Campbell 2004b), both the Labor Day trial-heat and economy and the convention bump forecasts measured up well this year. Of the more than 121 million Americans who voted for a major party presidential candidate, 51.2% voted for President Bush.1
At this writing, the unofficial vote totals indicate that Bush received 51.2% of the two-party vote. Percentages of the vote and errors have been rounded to tenths of a percentage point.
Both forecast models also measured up to their performances in previous elections, either actual forecasts or those simulated through out-of-sample testing. Although the Labor Day error this year was larger than the model's mean out-of-sample error (1.6%), the forecast was about as accurate as it was in 2000 and more accurate than four of the 14 out-of-sample tests. The convention bump forecast was more accurate than its mean out-of-sample error (2.1%) and half of its out-of-sample tests. While the forecasts were reasonably accurate this year, there remains error to explain. How much of the error was a consequence of model weakness and how much might be attributed to unanticipated effects of the campaign?
The Model and the Data
Although there are no readily apparent model weaknesses exposed by the 2004 election, this year's tests of the models strongly indicate that these forecasts should reconsider use of the likely voter division of the Gallup poll rather than the registered voter division. The likely voter division was used because Gallup put this forward as the best measure of preferences among voters and, in light of increasingly easier voter registration, a substantial difference between the preferences of the registered and those who actually turned out to vote seemed increasingly likely. In hind-sight, as laudable as the effort is to identify those who are likely to vote, the current method of identifying likely voters appears flawed. The likely voter screen, as currently applied by Gallup, not only increases volatility in the preference distribution (Erikson, Panagopoulos, and Wlezien 2004) but diminishes accuracy.
Table 1 compares the use of the likely voter and the registered voter poll divisions in the convention bump and the trial-heat and economy forecasts from Labor Day through to five days prior to the election. In four of the five forecast timings, the use of registered voters produced a more accurate forecast. If I had used registered voters in the two models, both forecasts would have been within 1.1 points of the actual vote.2
The accuracy of both models would also have been improved by using Jim Stimson's pooled poll data (Stimson 2004). The convention bump forecast would have been about 52.0% Bush and the Labor Day forecast would have been 52.6%, reducing the errors to .7 and 1.3% respectively.

The Unanticipated in the Campaign
In addition to the poll problem, a portion of the difference between the forecast and the vote may have been caused by unanticipated aspects of the campaign. Two factors in particular may have worked to Kerry's advantage: a strong performance in the presidential debates (particularly the first) and the economic issue. Between the first and third debates in early October, Bush's poll lead over Kerry dropped between 2 and 4.5 points in most polls. Some of this loss was regained quickly, some was not. On the economy, while economic growth overall was about average for an election year and this is generally good enough to help the in-party, polls consistently indicated that voters favored Kerry to Bush on the issue. The Gallup polls in the last month of the campaign had Kerry with a 7-point lead over Bush in handling the economy. The focus on the war on terror issue by the Bush campaign may have allowed Kerry to frame the economy to his advantage. Bush countered much of this advantage, however, by an extraordinary get-out-the-vote effort: the RNC's 72-hour plan. This, combined with referenda in 11 states banning same-sex marriage, mobilized those who found Senator Kerry to be too liberal (about half the nation according to Gallup, compared to 40% who found Bush too conservative) and erased most of the gains that Kerry had made through the fall campaign (Campbell 2004c; 2005).
References
Campbell James E.
2004a “Forecasting the Presidential Vote in
2004: Placing Preference Polls in Context.” PS: Political Science and
Politics
37
(October): 763– 7.Google Scholar
Campbell James E.
2004b. “Introduction—The 2004 Presidential
Election Forecasts.” PS: Political Science and Politics
37
(October): 733– 5.Google Scholar
Campbell James E.
2004c. “The Presidential Election of 2004:
The Fundamentals and the Campaign.” The Forum
2
(4): Article 1.
www.bepress.com/forum/vol2/iss4/art1.Google Scholar
Campbell James E.
2005. “The Fundamentals in U.S.
Presidential Elections: Public Opinion, the Economy, and Incumbency in the 2004
Presidential Election.” Journal of Elections Public Opinion and Parties
1
(1).Google Scholar
Erikson Robert,
Costas Panagopoulos, and
Christopher Wlezien. 2004.
“Likely (and Unlikely) Voters and the Assessment of Campaign
Dynamics.” Public Opinion Quarterly
63: 163– 177.Google Scholar
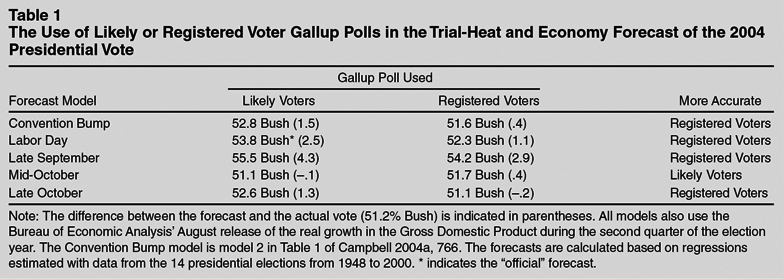
The Use of Likely or Registered Voter Gallup Polls in the Trial-Heat and Economy Forecast of the 2004 Presidential Vote
 You have Access