


INTRODUCTION
Temperatures within ice sheets and ice shelves are not only important intrinsic parameters but also of considerable importance for a number of temperature dependent ice properties. Of primary importance are the relationships between temperature and Theological properties of the ice, which govern the flow of ice sheets and their lateral extent (cf Paterson 1981).
The temperature distribution throughout an ice sheet mainly depends on conduction of heat within the solid ice for which boundary conditions are well known. Complications arise in the upper layers, ie in the zones where the transition from snow to firn and then to ice takes place. Here, heat transport is governed by conduction through the interconnected ice grains, convection and radiation across the air space of pores between the ice particles, and heat transport via vapor diffusion (cf Yen 1981). Hence, while temperature rpofiles can be computed with some confidence for the ice below the firn-ice transition (usually at depths between -70 to 100 m), estimates of temperature distributions in the firn layer require knowledge of the effective thermal conductivity of snow and firn.
Attempts to determine the effective thermal conductivity of snow have been reported by Schwerdtfeger (1963) and Yen (1962, 1963, 1965). In addition, field investigations, involving temperature measurements in the upper snow and firn layers over long periods (one to several years) allow estimates of effective thermal conductivities of these layers (Ables 1894; Jansson 1901; Devaux 1933; Kondrateva 1945; Bracht 1949). Ewing and others (1982) tried to obtain thermal conductivities of individual snow layers in the field by employing a relatively complicated apparatus and sophisticated mathematical methods.
We attempt to determine effective in-situ thermal conductivities of snow and firn by use of the conventional needle probe method (cf Von Herzen and Maxwell 1959). The major advantage of a needle probe lies in the fact that due to short measuring times and small probe dimensions, disturbance of the medium to be probed is kept to a minimum, a high spatial resolution is obtained, and near in-situ conditions are realized.
TECHNICAL AND OBSERVATIONAL DETAILS
The thermal conductivity measurements in the present study are based on the “transient line heat source method”. We employ a needle probe as our basic instrument which has long been used in geothermal work (eg Von Herzen and Maxwell 1959). The basic elements of the needle probe are a heating wire to which a constant current I of 200 m A is supplied and a thermistor (we used type Fenwall K. 4826A) to measure the temperature change of the needle. Both components are enclosed in a hypodermic needle with an outer diameter of 1.6 mm and 60 mm length. The thermistor is placed at 30 mm from one end of the needle. The needle is inserted into the material to be probed and after thermal equilibrium has been reached, constant power is supplied to the heating wire. The temperature rise of the needle is recorded at constant time intervals. The rate of temperature increase of the needle is determined by the ability of the surrounding medium (the test sample) to conduct the heat generated away from the line source. The thermal conductivity of the medium can then be calculated from the temperature-time record and the power input.
The theory of the transient line heat source is given by Carslaw and Jaeger (1959) from which follows (Kristiansen 1982) that the temperature rise at a distance, r, from the source can be obtained from;

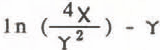
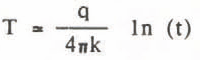
Between times tj and t2 , the temperature rise Δ? is therefore given by:

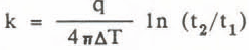
In equations (1) to (4), T is temperature, q is the heat input per unit time and unit length of the source, t is time, x is the diffusivity of the medium, k its thermal conductivity and Y is Euler’s constant ( = 0.5772). After thermal equilibrium has been reached, the curve of temperature against time approaches a straight line in a semi-logarithmic plot and the slope of this line yields the value of the thermal conductivity (cf Kristiansen 1982, Equation 4).
A number of limitations inherent to the transient line heat source method have to be taken into consideration (Kristiansen 1982), mainly regarding the dimensions of the needle probe and the minimum and maximum heating times. We used a needle with a length-to-diameter ratio of 33 and heating times of ~200 seconds, which both satisfy the respective requirements and warrant use of the needle probe in glaciological investigations.
Figure 1 shows the major elements of our apparatus. The entire measurement is controlled by a HP 41 CV mini-computer. Thermistor resistivites are measured by a HP 3421A multi-meter at constant time intervals (At = 1.6 s for the first 30 measurements and At = 10 s for the next 15 measurements), transferred to the HP 41 CV and then stored on a HP 82161A magnetic tape unit. The power supply of the needle is provided by a 12 v battery and a temperature compensated, stabilized current supply (200 mA). All components are placed in an insulated metal box and do not require an external power supply.
The needle probe was used for the first time during this year’s (1983/84) German-Antarctic expedition to the Filchner-Ronne Ice shelf (in the following referred to as Filchner Ice Shelf). Part of the expedition was a glaciological traverse between the German summer station (Filchner Station) and a point some 250 km south of it (Figure 2). As can be seen, thermal conductivities are measured at stations T140, T240, and T340. The measurements were taken to a depth of -2.5 m on snow pit walls.


In employing the needle probe, we carefully selected contact zones between summer and winter layers as well as homogeneous zones as measuring points. The small dimension of the needle allows a high spatial resolution of thermal conductivity measurements. Based on a formulation given by Kristiansen (1982), we estimate that a cylindrical region of 2-4 cm around the needle diameter is responsible for the measured temperatures.
We also measured temperature and density distributions on the snow pit walls and took samples for stable isotope analysis (Reinwarth and others 1984). These data, together with a visual stratigraphy, allow characterization of major structural parameters of the upper snow and firn layers on the Filchner Ice Shelf and can be used in comparisons with the thermal conductivity measurements
RESULTS
Table 1 to 3 give results of the field measurements at stations T140, T240, and T340 (for further details, see Reinwarth and others 1984). Whenever ambiguities in the analysis of T versus In t data arose (eg no clearly defined linear region in the T versus In t-plot), the resulting value of the effective thermal conductivity was disregarded. As can be seen, effective thermal conductivities of snow and firn vary by almost two orders of magnitude and are considerably smaller than the accepted value for ice (= 22 W/m K; Yen 1981).


Figure 3 gives as a representative example a graphic representation of field results at station T340. Also shown is the structure of the upper 2.5 m as determined by visual stratigraphy. For comparison with the field data, first results of δ18O-analyses on returned samples are shown (Reinwarth and others 1984). As can be seen, the δ18O profile clearly defines seasonal changes and allows determination of a mean accumulation rate of 15g/cm]2 water equivalent at station T340. The change between summer and winter layers is reflected in the density distribution and in the stratigraphy. A number of summer layers are clearly marked by depth hoar.
As can be seen in Figure 3, the variation in effective thermal conductivities follows a systematic trend which can be related to density, seasonally and structure as reflected in the stratigraphy. It appears that dense, small grain size winter layers are characterized by relatively high conductivities (>/- 0.3 W/m K), while coarse grained summer layers have effective thermal conductivities considerably smaller than 0.3 W/m (note eg the variation in conductivities at -1.5 m depth at a small spatial scale).
The temperature distribution in the upper snow and firn layers is dominated by surface temperature variations, ie by upward or downward heat transfer, depending on the near surface temperature gradient. Also shown in Figure 3 are temperatures and temperature gradients as a function of depth. The gradients are computed by dividing the difference between two adjacent temperature values, by the respective distance between the measuring points. Comparing the values of the temperature gradients for a specific layer with corresponding thermal conductivities of this (or an adjacent) layer, reveals a systematic correlation between these two quantities. Small temperature gradients are found in or close to layers with relatively high effective thermal conductivities, while small thermal conductivities results in large temperature gradients. This relation is independent of the direction of the heat transport. Again, conductivities and temperature gradients at -1.5 m depth provide a good example for this correlation.
The observed relation between temperature gradient and effective thermal conductivity is in agreement with basic thermodynamic models which predict large adjacent to low conductivity act as thermal “barriers” to the result in the observed steep The consistency of our results with this basic thermodynamic principle lends strong support to the accuracy and validity of our thermal conductivity measurements.

DISCUSSION AND CONCLUSIONS
Figure 4 gives effective thermal conductivities (k eff as function of density (p) of our field measurements and a least square fit of these data:

correlation coefficient = 0.83.
It is obvious that this relation is valid only for densities between 0.24 to 0.42 Mg/m3 and leads to thermal conductivities for densities >0.42 Mg/m3 far in excess of acceptable estimates. Comparisons with other empirical and theoretical relations between density and thermal conductivity (e.g. Schwerdtfeger 1963; Yen 1981) demonstrate that our results imply a much stronger dependence of conductivities on density than previously obtained. Efforts to include the effect of temperature on thermal conductivity (Yen 1981) for our data did not succeed, mainly because of insufficient data coverage.

Despite these differences, we note a fairly good agreement between our results and previous field observations for p between 0.3 and 0.42 Mg/m3 (Abels 1894; Jansson 1901; Devaux 1933; Kondrateva 1945; Bracht J949).
However, as can be seen (Figure 4), the scatter in measured effective thermal conductivities for a given density amounts to up to one order of magnitude. This fact, together with the above noted discrepancy in the empirical relations between conductivity and density suggest that density (and temperature) alone is a poor measure of effective thermal conductivity of snow and firn.
Mellor (1964) hypothesized that thermal conductivities of snow may be expected to depend on grain structure and should increase as intergranular bond growth increases the concentration of continuous ice paths. He suggested that measurements on snow of a given density at different stages in the “age hardening” process would more clearly reveal his contention. Izumi and Huzioka (1975) have shown that the thermal conductivity of snow varies considerably depending on texture and the mode and degree of metamorphism the samples have been subjected to.
Our technique, which employs a probe of principle dimension (diameter) of the same magnitude as the grain and pore sizes of the porous medium to be measured also allows a test of this hypothesis. We conclude that our results strongly support Mellor’s (1964) idea and predict that grain structure plays a major role in determining the effective thermal conductivity of snow and firn. As can be seen in Table 3 and Figure 3, the conductivity of the depth hoar layer at e.g. 1.52 m (= 0.05 W/m K) lies significantly below values of 0 16 W/m K (at 0.48 m) and 0.24 W/m K (at 0.72 m) even though, the densities of these layers are almost the same’. Conductivities of 0.37 and 0.08 W/m K of layers at 1.12 and 2.1 m respectively, both determined at densities of 0.35 Mg/m3 but with significantly different grain structures (Figure 3) support the above conclusion. The major reason for these widely differing effective thermal conductivities lies in the fact that heat transport within the coarse grained layers is dominated by conduction through the air within the pores (other processes are neglected here).
Such a transport is much less effective than heat conduction between neighbouring ice grains in layers of the same density.
Thus, we conclude that in assessing the heat transport in snow and firn, grain structure is probably the governing parameter which determines the effective thermal conductivities. We also conclude that the present technique of needle probe measurements allows a more exact estimate on the thermal conductivity structure within the upper few meters of snow and firn than previous investigations. A more quantitative relation between structural parameters and effective thermal conductivities of snow and firn can at present not be given but will be the subject of further studies.
ACKNOWLEDGEMENTS
I thank G Zoth at the Niedersächsisches Landesamt für Bodenforschung for providing valuable help and for building the needle probe. Thanks are due to O. Reinwarth for suggestions and support with the field work and to an anonymous reviewer for helpful comments. I thank Dr Graf from the GSF-Institut fur Radiohydrometrie for providing the δ18O data.



