I. INTRODUCTION
Hydrogenation associated with palladium (Pd)-based catalysts has shown promise as a fast, efficient, and reliable technique for sustainable groundwater treatment, especially against volatile organic compounds (VOCs). Pd is more catalytically active, chemically stable, and reaction-selective in comparison to other metals, such as iridium, rhodium, zinc, etc.Reference Chaplin, Reinhard, Schneider, Schüth, Shapley, Strathmann and Werth1 It is especially potent for the decomposition of VOCs. However, Pd by itself is susceptible to some operational and environmental conditions that cause the catalyst to deactivate rapidly, especially in the presence of sulfide and chloride.Reference Heck, Nutt, Alvarez and Wong2,Reference Munakata and Reinhard3
Particulate forms of Pd-based catalysts have been fabricated both individually and on a variety of supports, including alumina,Reference Park, Bhargava, Bender, Chase and Ramsier4 silica, activated carbon, zeolites,Reference Chaplin, Reinhard, Schneider, Schüth, Shapley, Strathmann and Werth1 titania,Reference Li, Lu, Zhou, Ye, Xiong, Yang, Pan, Chen, Wu, Li, Chen, Wang and Xia5,Reference Lyu, Liu, Wang and Tian6 etc., as well as with various metal promoters for the catalyst. These metals include copper (Cu),Reference Salomé, Soares, Órfão and Pereira7–Reference Pintar, Batista and Muševič9 tin (Sn),Reference Pintar, Batista and Muševič9 iron (Fe),Reference Engelmann, Hutcheson, Henschied, Neal and Cheng10 magnesium (Mg),Reference Engelmann, Hutcheson, Henschied, Neal and Cheng10 and gold (Au).Reference Nutt, Hughes and Wong11 Among these, Au is specifically known to boost the catalytic activity of Pd by increasing the adsorption of hydrogen to Pd, thereby accelerating hydrogenation.Reference Chaplin, Reinhard, Schneider, Schüth, Shapley, Strathmann and Werth1 Synthesized Pd/Au nanoparticles (NPs) have been reported to resist sulfide fouling.Reference Heck, Nutt, Alvarez and Wong2 Additionally, particles with supports offer several advantages over individual or bimetallic particles because supports enable even particle distribution, prevent particle aggregation,Reference Calvino-Casilda, López-Peinado, Durán-Valle and Martín-Aranda12 and increase the ease of handling the product for practical use.
Typically, the synthesis of commercial granular activated carbon (GAC)-supported Pd catalysts and similar materials requires the use of complex, multistep processesReference Qiu, Xu, Zhu, Zhu, Xu and Chen13; high temperatures; high pressuresReference Gertrude14; vacuum requirementsReference Díaz, Ordóñez, Bueres, Asedegbega-Nieto and Sastre15,Reference Ordóñez, Díaz, Bueres, Asedegbega-Nieto and Sastre16 ; toxic chemicals such as sodium borohydride,Reference Zhang, Bacik, Roberts and Zhao17 hydrazine,Reference Schrage18 hydrogen peroxideReference Keith and Bair19; and pH control with alkaline or acidic components.Reference Keith and Bair19,Reference Mozingo20 Some even require the use of surfactants and stabilizers.Reference Cookson21 This report demonstrates an environmentally friendly synthesis technique that enables the catalysts to have high catalytic activity, long-lasting catalytic effects, and lower production costs. This opens up the opportunity to achieve practical applications of Pd- and Au-based catalysts for wastewater and groundwater treatment.
In this study, the experimental investigation is focused on a simple green-chemistry approach to produce catalysts made of Pd and Au NPs on carbon supports. Two different types of carbon supports were used (few-layer graphene and GAC) for the efficient removal of VOCs often found in groundwater. The synthesis occurs at room temperature and does not need any harsh chemicals or stabilizers. Several green-chemistry principles were achieved with this synthesis process, such as choosing environmentally benign chemical precursors, using safer solvents, applying energy-saving reaction conditions, and avoiding chemical derivatives. This process shows potential for synthesizing scalable catalysts suitable for large-scale treatment of VOCs in groundwater because of the ease in production of the catalyst as well as its potency. The catalysts synthesized by this technique have demonstrated the capability of very rapid and effective removal of trichloroethylene (TCE), a model contaminant chosen for this investigation.
Industries commonly use GAC for treatment of VOCs such as TCE and other contaminants. In this treatment process, TCE is removed by GAC through adsorption, during which the TCE molecules are trapped in the pores of GAC without breaking its molecular composition. The saturated or spent GAC is then reprocessed to remove these contaminants. For example, the high-temperature air-stripping process is often used to remove the TCE molecules from the GAC. The spent GAC often requires further treatment or proper disposal in landfills, making this an expensive water treatment technique. Nevertheless, GAC is still the most desirable adsorber for the removal of contaminant molecules due to its inertness, sturdiness, low toxicity, and availability.22,23
To take advantage of GAC’s unique properties, Pd and Au NPs were hybridized with GAC. The synergetic relationship of the physical adsorbance of GAC and the chemical decomposition capability of Pd/Au NPs makes a powerful catalyst. This type of catalyst has a strong capability to adsorb and anchor the VOCs on the GAC, enabling a high concentration of the contaminants on the surface of GAC in close vicinity to the potent Pd and Au NPs. This hybridized catalyst was synthesized using the aforementioned process and tested against TCE. During the degradation experiments, the GAC-supported Pd/Au NPs catalysts degraded TCE more efficiently than a commercial catalyst of GAC-supported Pd NPs. For a better understanding of the catalytic mechanism of these nanomaterials, monolayer and multilayer graphene were also used as the support for the Pd/Au particles. The graphene-supported catalysts were found to be highly effective at removing TCE.
Several other types of carbon supports were tested as well, including carbon black and nanoscale graphite, which showed slower degradation rates than catalysts with graphene and GAC as supports. These results are not included in this paper. Graphene and GAC offer advantages over other supports because of their unique surface morphologies and large surface areas. Graphene has superior properties, offering uniform large surface area,Reference Mcallister, Li, Adamson, Schniepp, Abdala, Liu, Herrera-Alonso, Milius, Car, Prud’homme and Aksay24 unique electronic properties,Reference Zhang, Tan, Stormer and Kim25 and excellent tensile strength,Reference Scarpa, Adhikari and Srikantha Phani26 which enable a widespread distribution of Pd/Au NPs on both sides. Previous work has shown that pristine few-layer graphene sheets have very low defects and high-quality lattice structure.Reference Qian, Hao, Zhou, Eastman, Manhat, Sun, Goforth and Jiao27,Reference Qian, Cottingham and Jiao28 This allows them to not only act as favorable substrates for uniform dispersion of Pd/Au NPs but also offer direct conductive paths for rapid electron transport.Reference Qian, Cottingham and Jiao28 Graphene sheets can also be characterized with less ambiguity than other carbon samples using electron microscopy and spectroscopy techniques because they are electron transparent and have well-defined crystalline structures. In this study, a graphene support was used initially as a simplified carbon-surface aimed at understanding the catalytic mechanism of carbon-based Pd/Au catalysts.
II. METHODS
A. Materials
Palladium(II) acetate (reagent grade, 98%, Sigma-Aldrich, St. Louis, Missouri) and tetrachloroauric(III) acid trihydrate (Acros Organics, Pittsburgh, Pennsylvania) precursors were used to produce Pd/Au NPs. To make graphene, expandable graphite (ACS Material, Pasadena, California) was heated to 1000 °C and held for 60 s in an atmosphere of 5% hydrogen and 95% argon to form expanded graphite (EG). The EG was sonicated with a probe sonicator (Sonics Vibra-cell VCX 130, Newtown, Connecticut) for 60 min, forming a sustainable gray suspension. The solid, exfoliated, pristine graphene sheets were collected by centrifugation at 15,000 rpm for 3 min. Graphene was made without any heat treatment, surface modification, or oxidation processes. This freshly made graphene was immediately used for making catalysts, as described below.
The GAC used was activated charcoal (DARCO®, 20–40 mesh, Sigma-Aldrich, St. Louis, Missouri), roughly 800–400 μm. The GAC particle size was further reduced to less than 70 μm (200 mesh) to be comparable with the results of previous studies.Reference Edwards, Thomas, Carley, Herzing, Kiely and Hutchings29 For this, 20–40 mesh GAC was crushed in a mortar and pestle and sieved through a 70 μm nylon mesh.
A 1:1 (molar ratio) of Pd and Au was made by first sonicating 9 mg of Au precursor in acetone for 15 min before adding it to a solution of 3 mg of Pd (5 wt% loading) precursor. This solution was sonicated for 60 min. Then 27 mg of carbon substrate (graphene or GAC) was added, and this solution was transferred to a Teflon liner in a stainless-steel autoclave. The autoclave was allowed to react at room temperature (22–25 °C) for 24 h, similar in procedure to previous work.Reference Qian, Cottingham and Jiao28,Reference Qian, Chen, Cottingham, Merrill, Swartz, Goforth, Clare and Jiao30 No agitation, stirring, or mixing was introduced to preserve the structural integrity of graphene and GAC. After 24 h, the catalyst samples were filtered, washed, and air dried.
B. Material characterization
An FEI Tecnai F20 (FEI, Hillsboro, Oregon) high resolution transmission electron microscope (HRTEM) equipped with scanning transmission electron microscopy (STEM) and energy dispersive X-ray spectroscopy (EDS) capabilities that operates at an accelerating voltage of 200 kV and an FEI Sirion XL30 (FEI, Hillsboro, Oregon) scanning electron microscope with EDS was used for the analysis of the catalyst.
C. Catalytic reactivity characterization
For each run, 20 mg of the catalyst was tested against 50 mg/L or 50 ppm of TCE in deionized (DI) water in a batch reactor with crimp-sealed rubber septum stoppers. This concentration of TCE was used so that the results could be compared to those previously published.Reference Nutt, Hughes and Wong11,Reference Nutt, Heck, Alvarez and Wong31 The catalyst was added to a 150 mL glass vial followed by 120 mL of DI water. The vial was spiked for 20 min with 99.9% hydrogen gas and then crimp sealed. Finally, 4.7 mL of a saturated TCE solution (1.28 mg/L) was injected at room temperature, and the vials were rotated at 50 rpm. The experiment ran for 60 min or until the TCE was undetectable.
The reaction was monitored through headspace gas chromatography (GC) using an HP 5890 Series II GC (Hewlett Packard, Palo Alto, California) equipped with a flame ionization detector and a DB-624 Agilent J&W (Aligent, Santa Clara, California) Scientific column (30 m long with 0.53 mm ID). Headspace TCE composition was converted back to the liquid-phase composition using standard calibration curves, assuming that TCE partition concentration obeys Henry’s law. Standards of known concentration TCE solutions were used to calibrate the peak area during individual GC runs. A sample with a molar ratio (Pd:Au) of 2:1 supported by <70 µm GAC was tested at both 2 and 20 min for identification of products using a GC equipped with a mass spectrometer (GC-MS) (Agilent 5975C MSD with a 7890A GC, Agilent, Santa Clara, California).
D. Modeling and simulations
Spin-unrestricted density functional theory (DFT) simulations were carried out for single-layer periodical (4 × 4) graphene consisting of 32 carbon atoms in the X–Y plane, using the optimized C–C bond length of 1.425 Å. A vacuum of 20 Å and dipole corrections along the Z-direction were introduced to eliminate periodic effects between slabs. DFT calculations were carried out using the plane-wave basis set and the projector augmented wave pseudo-potentials, which were implemented in the Vienna ab initio simulation package (VASP) code. The generalized gradient approximation type functional, parameterized by Perdew, Burke, and Ernzerhof, was used to treat the exchange and correlation energy, similar to previous work.Reference Ji, Zhang, Li, Li, Wang, Ren and Yuan32 The self-consistent electronic iteration proceeded until the total energy converged to 10−6 eV with spin-polarized calculation. Optimized structures were obtained after the geometric relaxations, with a maximum force tolerance of 0.01 eV/Å. After systematical tests, a Γ-centered Monkhorst–Pack 5 × 5 × 1 k-point mesh and an energy cut-off of 400 eV were used for the relaxations, which are increased to be 11 × 11 × 1 and 500 eV in the following calculations on electronic properties to make the result more reliable.
III. RESULTS AND DISCUSSION
A. Characterization of graphene and GAC-supported Pd and Au NPs
The synthesis process was designed to allow proper interaction between the metallic precursors with the carbon support. The sequence of steps in which the precursor for the heavier metal, Au, was first individually sonicated and then sonicated together with the Pd precursor was designed to facilitate the interaction between the metals in the solution. NPs were expected to disperse all over the surface of the supporting material. Since the fabrication procedure was not completely optimized, other configurations (such as clusters and individual elemental NPs) were expected to form as well.
In addition, it was speculated that the absence of mixing or stirring of the forming solution during the synthesis process would result in a large range of sizes and types of NP formation. The concern with introducing stirring was that it might cause damage to the structural integrity of graphene and GAC and would affect the proper comparison with other samples’ catalytic activities. Preliminary degradation tests (not shown) indicate that stirring did not have a significant effect on the performance of the catalyst against the contaminants; hence, agitation has not been included in the synthesis process reported here. Regarding the formation of the hybridized Pd/Au on carbon supports, it was hypothesized that the NPs formed during sonication grow and anchor onto the carbon substrate when allowed to react in the autoclave. Various synthesis trails (not included here) suggest that the NPs are strongly attached to the GAC surface. Several synthesis parameters, such as molar Pd:Au ratios, type and size of supports, synthesis temperature, and reaction time, were modified over 150 samples. Of those, the set of data presented here was most optimized.
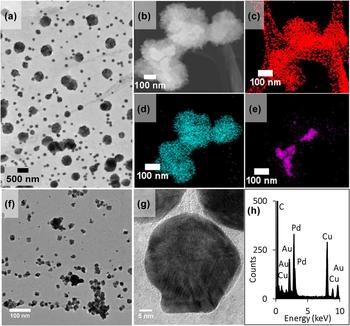
To further characterize the catalyst material and understand the effects of various synthesis parameters, electron microscopy and spectroscopy techniques were used on both the graphene and GAC-supported samples. The Pd/Au NPs hybridized to the graphene were characterized first, as can be seen in Fig. 1(a). As expected, Pd/Au NPs of various sizes were found to be well-dispersed over the graphene surface. Using TEM imaging and EDS qualitative analysis, the larger bimetallic NPs in the range of 100–500 nm were identified as clusters of smaller Pd NPs surrounding larger Au NPs. One such cluster, shown in Fig. 1(b), was further analyzed using EDS mapping. This revealed the structure of much smaller, crystalline Pd NPs surrounding an Au core, as can be seen in maps of Figs. 1(d) and 1(e), over the carbon support, Fig. 1(c). This configuration of the cluster allows for good contact between Pd, Au, and graphene. The absence of stirring during the synthesis may contribute to the formation of this type of structural morphology, where Pd NPs tend to form clusters while Au tends to form larger NPs. At higher magnifications, as can be seen in Fig. 1(f), smaller crystalline NPs in the range of 2–20 nm were observed as dispersed throughout the graphene support. Figure 1(f) was taken in a location where a majority of smaller NPs shown in Fig. 1(a) could be viewed exclusively. Note that some of these small NPs show polyhedral shape. The EDS spectrum in Fig. 1(h) was taken from the NP in Fig. 1(g) suggesting that this NP is bimetallic Pd and Au.
(a) TEM image of NPs dispersed over the graphene. (b) STEM image of a larger particle over the graphene with EDS maps (c), (d), and (e) of carbon, palladium, and gold, respectively. (f) TEM image of the NPs over graphene. (g) HRTEM image of one of those NPs shown in (f). The EDS spectrum of this particle displayed in (h) indicates that it is a bimetallic Pd/Au NP. The C and Cu peaks are from graphene support and TEM copper grid.

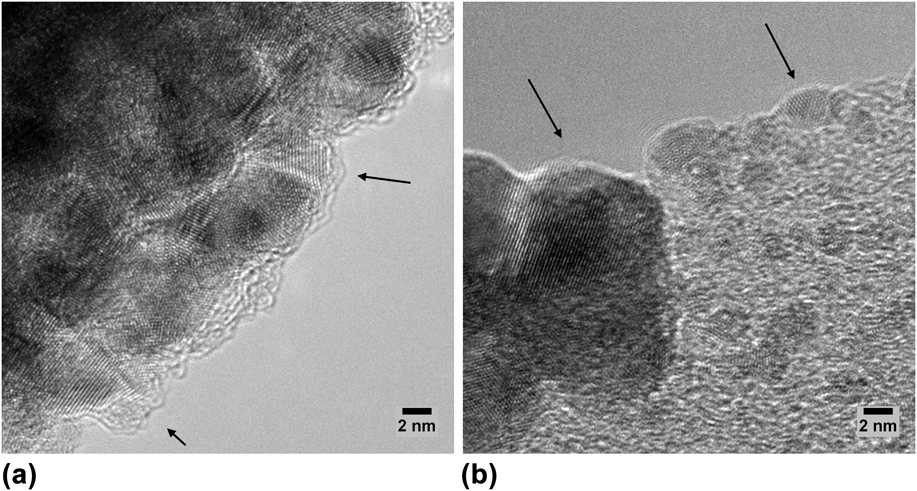
The crystalline structures of these NPs are demonstrated in Fig. 2. These HRTEM images were taken on different locations of the carbon-supported NP sample. As can be seen in Fig. 2(a), the cluster is made of several smaller NPs. The lattice fringes of these NPs indicate clearly that all the NPs are crystalline. The edge of the support was imaged in Fig. 2(b), where smaller NPs were also observed to have lattice fringes, confirming their crystallinity. The arrows in both Figs. 2(a) and 2(b) are pointing toward NPs with lattice fringes that are more evident. It was observed that both structures contribute to the degradation of TCE. The smaller NPs are believed to have a larger effect on the degradation of TCE due to the collectively larger surface area, although at this point, these effects have not been quantified.
HRTEM images of (a) the edge of a NP clustered structure and (b) NPs showing on the edge of the carbon support. The arrows on both images point at the NPs with clear lattice fringes.

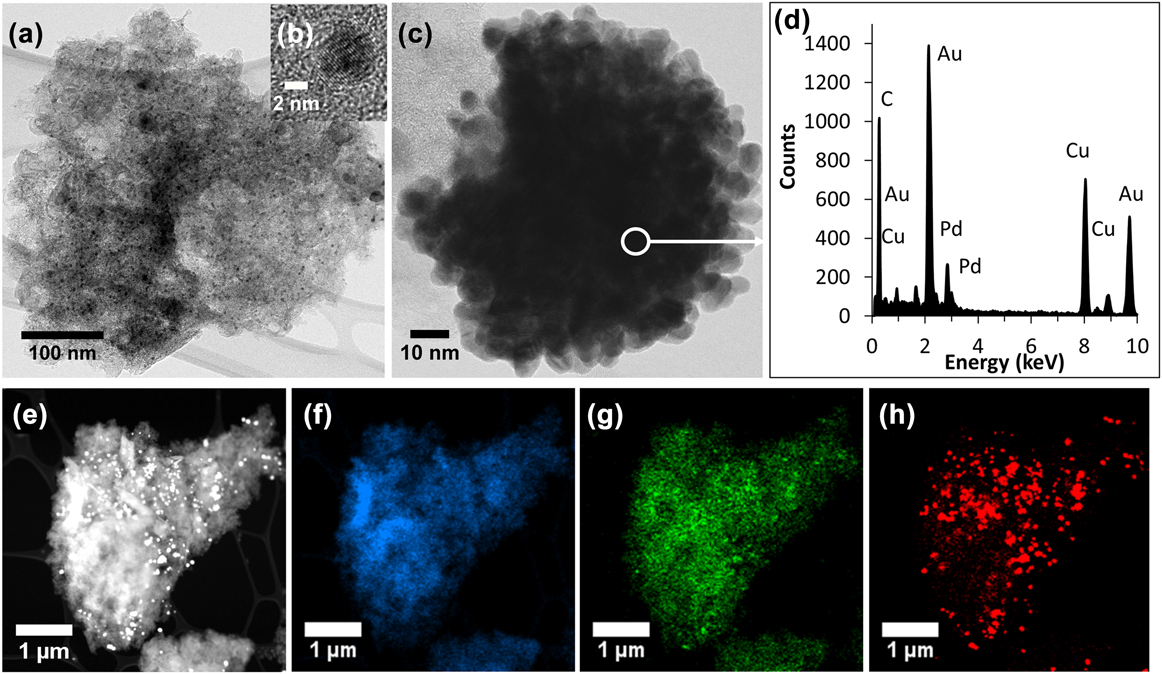
The GAC samples were also characterized using the same techniques. However, due to the high porosity and 3-dimensional structure of GAC, it is difficult to reveal detailed structural properties of the GAC-Pd/Au sample by TEM/EDS. For a more accurate understanding of the top layer of the GAC, the graphene samples were used to mimic the activities of the surface structures of GAC. Also, the 800–400 μm GAC samples were not characterized by TEM due to their large sizes, which prevent electron transmission through the samples. However, GAC particles smaller than 70 μm were imaged by TEM. Some of these results are shown in Fig. 3.
(a) is a TEM bright-filed image of a GAC particle anchored with Pd/Au NPs. Inset (b) is an HRTEM image of a NP embedded in the amorphous GAC, showing the crystalline nature of the NP. The sample was also observed under dark field imaging (results are not included here), which confirmed that most of the NPs are in a crystalline form. (c) is an image of a relatively large cluster of GAC and NPs. An EDS spectrum shown in (d) taken from an area of this cluster reveals the peaks of Pd, Au, C, and Cu. The Cu peak is from the TEM Cu grid. (e) is a STEM dark field image of the GAC and NPs where the bright dots are the metal particles (Pd and Au). The EDS maps of this GAC-Pd/Au particle display the distribution of C, Pd, and Au in (f), (g), and (h), respectively.
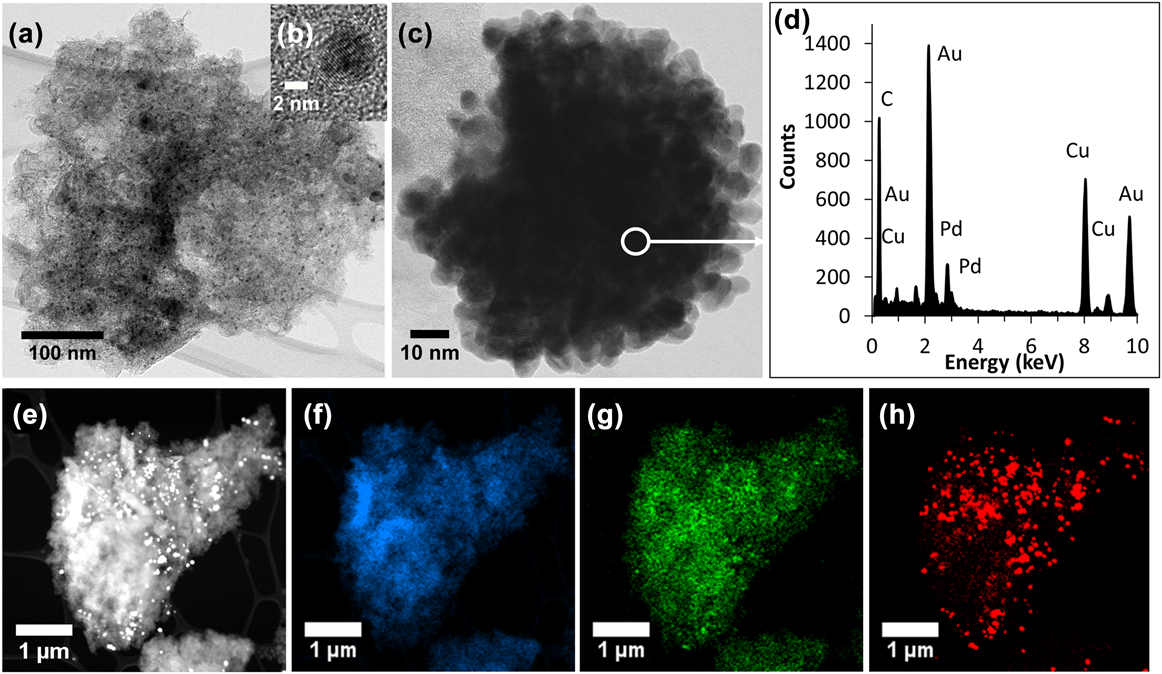
Similar to the graphene-supported sample in Fig. 1, both large and smaller clusters, dispersed particles were observed in GAC-supported samples. Note that Fig. 3(a) is a low magnification TEM image of one such GAC particle, showing dispersed NPs embedded throughout its structure. Inset Fig. 3(b) shows a smaller NP, the lattice structures of which demonstrate the crystalline nature. Numerous NPs like these were spotted throughout the GAC particle. A closer inspection of a clustered NP is shown in Fig. 3(c). The EDS spectrum in Fig. 3(d) revealed this particle to be a bimetallic Pd/Au NP. The GAC particle shown in Fig. 3(e) was investigated under STEM/EDS, revealing the maps of Fig. 3(f) carbon, Fig. 3(g) Pd, and Fig. 3(h) Au. Closer examination of these maps shows smaller Pd NPs were dispersed throughout the GAC particle as can be seen in Fig. 3(g), while the larger, accumulated Au NP formation is demonstrated in Fig. 3(h). There are common areas in both the Pd and Au maps in which the signals are overlapped. This indicates the presence of the larger clusters of Pd and Au. This result is consistent with previous findings.Reference Edwards, Thomas, Carley, Herzing, Kiely and Hutchings29,Reference Meduri, Barnum, Johnson, Tratnyek and Jiao33,Reference Edwards, Landon, Carley, Herzing, Watanabe, Kiely and Hutchings34
A notable feature of the GAC-supported Pd/Au NPs is that the NPs appear to be embedded throughout the GAC particle, not just restricted to the surface. This result suggests that Pd and Au deposit both on the surface and inside the pores of GAC. The formation of Pd/Au NPs deep within the GAC pores is attributed to the porosity of GAC.
B. TCE degradation rate determination
The TCE degradation data were fitted to pseudo first-order kinetics,Reference Nutt, Heck, Alvarez and Wong31
 $${{ - {\rm{d}}{C_{{\rm{TCE}}}}} \over {{\rm{d}}t}} = {k_{{\rm{obs}}}}{C_{{\rm{TCE}}}}\quad ,$$
where C TCE is the TCE mass concentration in the bulk fluid (g TCE L−1) and k obs (min−1) is the measured, observed (pseudo) first-order rate constant.
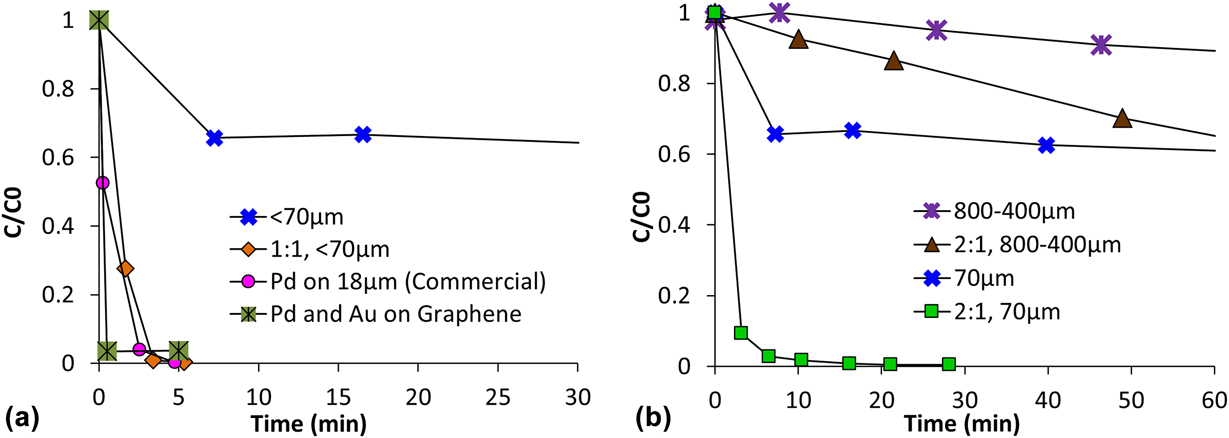
The TCE degradation kinetics of the various catalysts is shown in Fig. 4. At regular time intervals, headspace from the reactor was tested in the GC. The concentration of TCE at various times, C (g TCE L−1), was normalized to initial concentration at t = 0 s, C 0 (g TCE L−1), and plotted on the Y-axis as C/C 0; against time (min) as the X-axis. The rate of the reaction or degradation rate k obs (min−1) was calculated by fitting the data to Eq. (1), following pseudo first-order kinetics. These values have been reported here.
(a) Normalized concentrations (C/C 0) of TCE degradation with respect to the reaction time for the as-made catalysts, commercial Pd on GAC, and plain GAC (as control), where the curves are marked by different symbols and colors. The curves in (b) indicate the effects of the surface areas of GAC-supported catalysts on the TCE degradation rate.

First, the TCE degradation by the as-made catalysts and the commercial Pd-on-GAC catalyst are compared in Fig. 4(a), with plain GAC as control. Here, 1:1 M and 2:1 M of Pd:Au precursor ratios used during the formation of Pd:Au NPs on GAC samples have been tested for their performance against TCE.
The loss in TCE by plain GAC is attributed to adsorption, as no products were detected. The degradation is significantly faster with the Pd/Au NPs on the graphene catalyst due to the uniform distribution of NPs over the vast surface area of the support. In comparison, the commercial Pd-on-GAC catalyst and the Pd/Au NPs on GAC appear to have similar rates of degradation. Product peaks were observed during degradation using the Pd-based catalyst, suggesting the degradation of TCE is via the traditional hydrodehalogenation (HDH) pathway, as reported by others.Reference Lowry and Reinhard35,Reference Li, Fang, Romanczuk, Jin, Li and Wong36
The observed rate of reactions for the Pd/Au NPs on the GAC sample was found to be 1.09 ± 0.09 min−1, and for the commercial Pd-on-GAC, it was found to be 1.16 ± 0.21 min−1. Each sample was tested at least 3 times for statistical significance, and the average rate of the reaction has been reported here. It is important to note that the commercial Pd-on-GAC has a much smaller particle size of 18 μm when compared to the Pd/Au NPs on GAC, which have an average particle size of 70 μm. Therefore, it can be concluded that for a comparison between the reaction rates made on a surface-area basis, the Pd/Au NPs on the GAC catalyst would have a higher degradation rate than their commercial counterparts. Above all, the graphene-supported sample gave a much higher degradation rate, as the NPs are able to interact with the contaminants to a larger degree due to the significantly higher available surface area.
Figure 4(b) compares the degradation of TCE by <70 µm GAC, 800–400 µm sized GAC, and the respective catalysts. It can be seen that by crushing the GAC, the effective surface area was increased, which is reflected in the change of adsorption of plain GACs. More significantly, the Pd/Au NPs have increased contact with the TCE when supported by the <70 µm GAC, which caused a much faster degradation rate.
The results from Fig. 4 confirm that the mechanism of TCE degradation is through a combination of adsorption and catalytic decomposition. As can be seen in Fig. 4(b), GAC by itself removes TCE at a very slow rate by adsorption. With the addition of the Pd/Au NPs, the degradation of TCE is significantly faster. This is due the combined effects; the adsorption of GAC attracts the TCE toward the NP-rich surface, and these NPs catalyze the breakdown of TCE into harmless by-products, following the traditional route of HDH. This discussion is continued in the next section of the paper.
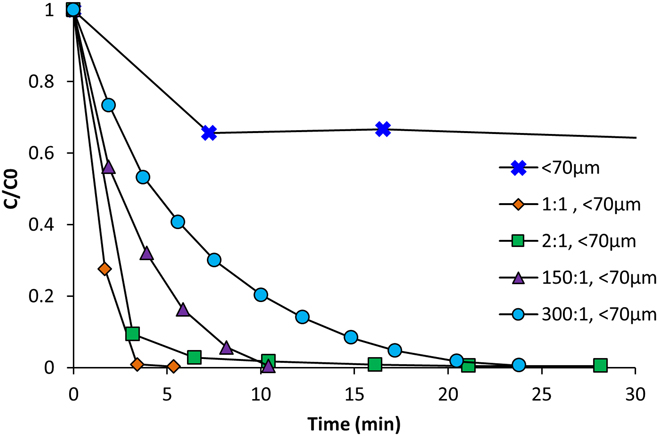
The role of Au is an important one. Au by itself does not degrade TCE, as it is not a catalyst for HDH; however, it acts as an excellent promoter of hydrogen dissociation by Pd.Reference Chaplin, Reinhard, Schneider, Schüth, Shapley, Strathmann and Werth1,Reference Tierney, Baber, Kitchin and Sykes37 It is known that H2 dissociation over Pd is more favorable with Au than with other materials, such as Cu.Reference Tierney, Baber, Kitchin and Sykes37 Au is also considered to have the ability to influence Pd’s catalytic reactivity and selectivity due to its influence over Pd’s electronic structure.Reference Baber, Tierney and Sykes38 To test the interaction between the NPs on GAC, the molar ratio of Pd:Au precursors was varied between 1:1, 2:1, 150:1, and 300:1, with TCE degradation rates, as can be seen in Fig. 5. As expected, the more the Au that was used, the faster the degradation rate. This means that the catalyst can be optimized for specific applications where a compromise must be reached between catalyst performance and cost.
Reaction curves demonstrate the TCE degradation rates of the catalyst affected by varying the Pd:Au molar ratios during the synthesis, where the concentration of Pd was kept constant while the concentration of Au was varied.

C. TCE degradation mechanism
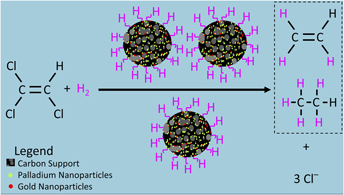
As shown in the TCE degradation results above, the catalysts remove contaminants using a combination of two mechanisms: adsorption and chemical decomposition. As mentioned in Sec. III.B, the mechanism of adsorption is when the GAC attracts the TCE to trap it in the pores via physical adsorption; the chemical decomposition is when the Pd, promoted by the Au, breaks the TCE down into smaller molecules. Preliminary modeling was carried out to confirm that the degradation of TCE in the presence of the catalysts was via a known pathway. Although detailed examination of products and reaction pathways are outside the scope of this paper, a preliminary testing of the TCE degradation products was carried out using a GC-MS. At 2 min, intermediate products like 1,1-dichloroethene (1,1-DCE), cis- and trans-1,2-dichloroethene (cis-DCE and trans-DCE), and vinyl chloride were found in the reaction mixture. These were no longer detected at 20 min, affirming the formation of benign products like ethene and ethane. This is consistent with the degradation of TCE via the traditional HDH pathway, as reported previously.Reference Lowry and Reinhard35,Reference Li, Fang, Romanczuk, Jin, Li and Wong36
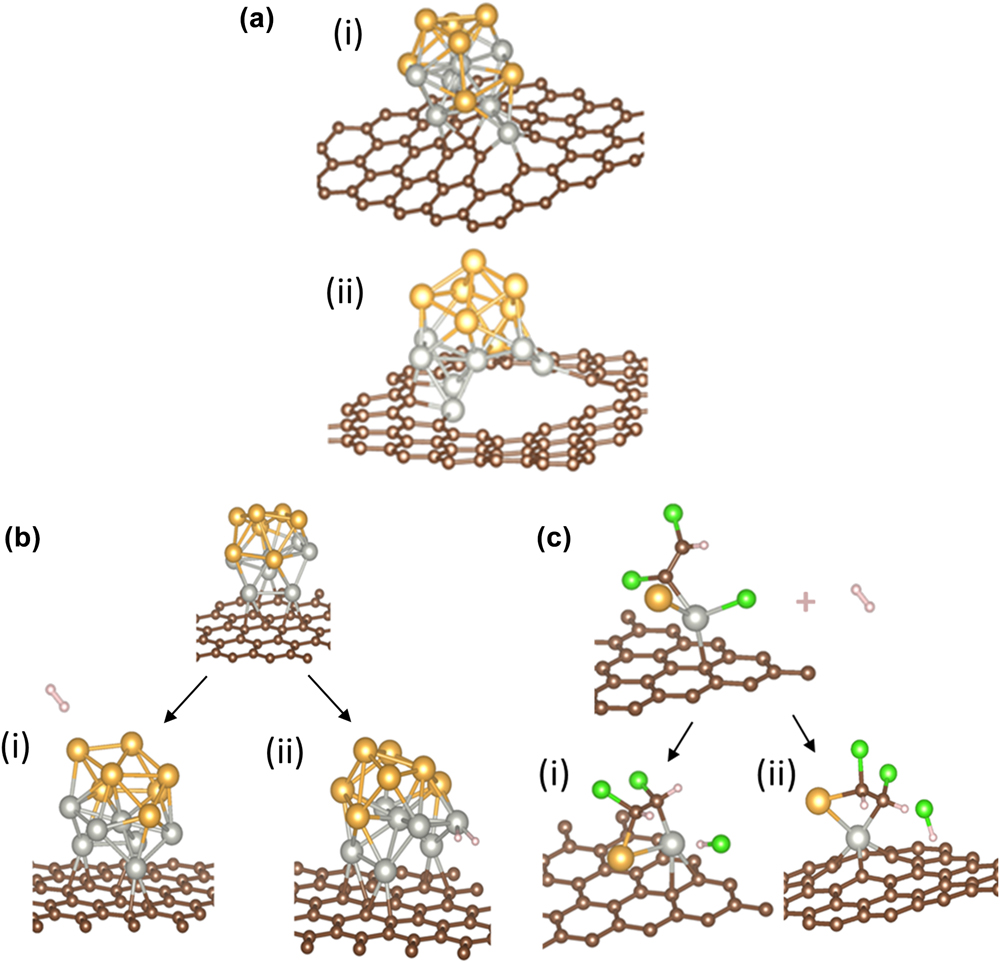
The TCE degradation results also suggest that the high surface to volume ratios of the NPs made the catalysts more efficient at TCE removal when compared to commercial catalysts normalized to surface area concentration. Furthermore, using the carbon supports like graphene and GAC enhances the catalyst’s performance. To understand the synergistic effects of these carbon-supported NP configurations are responsible for a faster TCE degradation, efforts were made to simulate the samples on both graphene and GAC supports. The results from the spin-unrestricted DFT simulations are shown in Fig. 6.
Simulations of a (Pd–Au)7 cluster supported by graphene, with atoms of Pd (gray), Au (gold), C (brown), H (pink), and Cl (green). (a) Clusters of (Pd–Au)7 on defective graphene with (i) low vacancy density and (ii) high vacancy density. (b) H2 does not dissociate with Au linked to Pd, as can be seen in (i), but does with Pd linked to Au, as can be seen in (ii). (c) Pd–Au on graphene interacting with TCE in the presence of H2 over (i) pristine graphene and (ii) defective graphene.

A sample model of a single layer periodic (7 × 7) graphene consisting of 32 carbon atoms was built in the X–Y plane, using the optimized C–C bond length of 1.425 Å. A cluster of 7 Pd and 7 Au atoms was created, limited by computational capacity and practical cost of metal for production. The (Pd–Au)7 cluster was adsorbed onto a single layer of graphene, taking into account the ground state energy of isolated Pd–Au metal clusters. One Pd atom, located in the center, was seen to act as a core, supporting the shape of the Pd–Au cluster. In this model, it was observed that Au atoms prefer standing atop surrounding Pd atoms to form a cap-like structure over the Pd atoms, which is consistent with the results of our previous research.Reference Ji, Zhang, Li, Li, Wang, Ren and Yuan32 It is believed that the smaller bimetallic NPs, as can be seen in Fig. 1(g) emulate this shape. In the presence of excess Pd and Au, large-clustered NPs are formed. These substantially larger Pd/Au clusters were not included in the simulations due to practical and computational limitations.
To mimic the highly defective and irregular topography of the GAC, the surface of the GAC was approximated to be a mixture of graphene and highly defective graphene. This minimized the complexity for simulating GAC. Although this assumption is not perfect, it is an adequate basis to predict the interaction between the defective carbon surface and the catalytic reactions.
During analysis of the GAC support in the simulation, the effect of vacancy defects in graphene was evaluated on the formation of the (Pd–Au)7 cluster and their effect on the cluster’s structural stability. Figure 6(a)(i) shows that the (Pd–Au)7 cluster retained its shape and bonds when anchored on a slightly defective graphene surface. When the vacancy density of the defects is high, such as in Fig. 6(a)(ii), the (Pd–Au)7 cluster was deformed in order for more Pd atoms to bond to the C atoms. This is in good agreement with previous simulations that describe Pd to have a strong affinity to carbon.Reference Ji, Zhang, Li, Li, Wang, Ren and Yuan32 The results show that both graphene and GAC serve as a good support for the Pd/Au NPs, as the clusters readily adsorb onto the carbon surface despite the defects.
It is known that the dissociation of hydrogen determines the rate of TCE degradation.Reference Chaplin, Reinhard, Schneider, Schüth, Shapley, Strathmann and Werth1 Therefore, the interaction of the cluster with graphene and hydrogen was explored. As can be seen in Fig. 6(b), an H2 molecule was placed near the cluster. When the H2 molecule was located close to Au atoms, the binding energy between H2 and the graphene-supported (Pd–Au)7 cluster was fairly low, indicating a physisorption, as can be seen in Fig. 6(b)(i). When the H2 molecule was placed closer to Pd than to Au atoms, the H–H bond was broken, and chemisorption occurred, as shown in Fig. 6(b)(ii). Here, the H2 molecule broke into two H atoms and attached to the Pd atoms, consistent with the previously reported H2 activation mechanism.Reference Li, Pu, Ma, Tian, He and Evans39 When the H2 molecule is placed near Pd, an adsorption energy of −0.630 eV was observed, and when the H2 is placed near Au, an adsorption energy of −0.079 eV was recorded. This indicates that in the presence of a graphene-supported Pd–Au cluster, hydrogen dissociation via chemisorption is favored. When two hydrogen atoms split, their bond with Pd has an adsorption energy of −1.077 eV. That is, hydrogen dissociation occurs rapidly in the presence of Pd/Au NPs on carbon supports, which is extremely advantageous for HDH catalysts.
Finally, the behavior of the catalyst when interacting with TCE was explored, as can be seen in Fig. 6(c), where Fig. 6(c)(i) depicts the interaction of the cluster over perfect graphene while Fig. 6(c)(ii) shows the interaction between the cluster and TCE over defective graphene. For both Figs. 6(c)(i) and 6(c)(ii), when the TCE molecule is in the vicinity of the cluster, one carbon and one Cl atom bind with another Pd atom. Both the carbon and the Cl gain electrons from Pd, creating negative charges for the Cl atom and for the rest of the TCE molecule. The electrostatic repulsion within the TCE causes the C–Cl bond to break. The presence of nearby adsorbed hydrogen molecules completes the reaction, converting the TCE to DCE and detaching the Cl as one soluble HCl molecule, which then moves away from TCE. That is, in the presence of Pd, the TCE dissociates to produce a Cl ion. Following hydrogen dissociation, which was discussed in the previous paragraph, one of the dissociated H ions takes the place of this displaced Cl ion. This step continues until all Cl ions have been replaced by hydrogens, forming a harmless hydrocarbon product.
These simulations are in agreement with the experimental results, and they confirm that when using a combination of adsorption and chemical decay, the Pd/Au NPs on carbon supports form powerful catalysts for the removal of TCE and other VOCs.
IV. CONCLUSIONS
Traditionally, the use of GAC is seen as a cheap removal technique for VOCs in groundwater. However, the constant regeneration, replacements, spills while handling, or disposals in landfills can have negative impacts on resources as well as the environment, including the recontamination of water sources in extreme cases when not properly contained. This paper has demonstrated a technique that takes advantage of GAC’s adsorption capability and Pd/Au’s catalytic properties to form a type of catalyst that is suitable for VOC degradation. The environmentally friendly synthesis process for the catalyst formation occurs at room temperature without the use of any harsh chemicals. The as-made catalysts show higher rates of degradation than commercial catalysts when normalized for mass and surface area. These catalysts are not only highly active but also robust, with a longer lifetime. This study also provides a fundamental understanding of the catalytic mechanism of this novel form of the catalyst. The DFT simulations showed that the Pd and Au NP clusters form favorably over both graphene and GAC, the hydrogen molecule dissociated in the presence of Pd, and the TCE was degraded in the presence of this cluster. The unique combinations of GAC with small amounts of Pd–Au NPs allow this type of catalyst to have great potential for real-life application, as they can be easily mass-produced through cost-effective and benign processes.
ACKNOWLEDGMENTS
This research is funded by the National Science Foundation (NSF) under Award Nos. 1507707 and 1508115 as well as by Oregon Nanoscience and Microtechnologies Institute (ONAMI). The participation of undergraduate students in this research is supported by NSF REU-Site Award No. 1560383 and the NIH BUILD EXITO program. All electron microscopy and spectroscopy characterizations were completed at the Center for Electron Microscopy and Nanofabrication (CEMN), located at Portland State University.