





1. Introduction
Future projections of glacier mass balance require accurate predictions of how climate and its changes affect ice ablation. This in turn affects the future trajectory of glaciers, which play critical roles in freshwater supply (e.g. Meier, Reference Meier1969; Andermann and others, Reference Andermann2012; Somers and others, Reference Somers2019; Saberi and others, Reference Saberi2019), sea-level change (e.g. Meier and others, Reference Meier2007; Jacob and others, Reference Jacob, Wahr, Pfeffer and Swenson2012; Hay and others, Reference Hay, Morrow, Kopp and Mitrovica2012; Larour and others, Reference Larour, Ivins and Adhikari2017) and landscape stability and associated natural hazards (e.g. Temme, Reference Temme2015; Deline and others, Reference Deline2021; Veh and others, Reference Veh2022; Van Wyk de Vries and others, Reference Van Wyk de Vries, Wickert, Macgregor, Rada and Willis2022; Wetterauer and others, Reference Wetterauer, Scherler, Anderson and Wittmann2022). Substantial efforts have been undertaken to both model (e.g. Hock, Reference Hock2003; Hock and Holmgren, Reference Hock and Holmgren2005) and measure (e.g. Popovnin and others, Reference Popovnin, Danilova and Petrakov1999; Karpilo Jr, Reference Karpilo2009; Zemp and others, Reference Zemp, Hoelzle and Haeberli2009; Immerzeel and others, Reference Immerzeel2014; La Frenierre and Mark, Reference La Frenierre and Mark2014) glacial ice ablation. Combinations of models and measurements are required to advance our capacity to extrapolate current glacier mass balance and predict future ice loss (Machguth and others, Reference Machguth, Paul, Hoelzle and Haeberli2006).
Approaches to modeling ablation range from temperature-index methods (Ohmura, Reference Ohmura2001; Hock, Reference Hock2003), in which air-temperature and ablation-rate data (typically from field-monitoring campaigns) are compared via a linear regression, to full energy-balance calculations (Hock and Holmgren, Reference Hock and Holmgren2005). So-called ‘enhanced temperature-index’ approaches fall between these two end-members, and typically incorporate solar radiation alongside temperature (Hock, Reference Hock1999; Pellicciotti and others, Reference Pellicciotti2005; Carenzo and others, Reference Carenzo, Pellicciotti, Rimkus and Burlando2009) into a multi-parameter empirical approach. Critically, all three of these methods require field data on climatic drivers as well as on ice-surface lowering, with the latter for calibration and/or validation (e.g. Walter and others, Reference Walter2005).
Ablation measurements have long been made using traditional ablation stakes, rods placed into holes drilled in the ice and re-surveyed by hand (e.g. Stuefer and others, Reference Stuefer, Rott and Skvarca2007; Braithwaite, Reference Braithwaite2008; Brook and Paine, Reference Brook and Paine2012; Minowa and others, Reference Minowa, Skvarca and Fujita2023). While these measurements provide critical in situ data, they are limited in temporal resolution, which may in turn limit both their utility and spatial extent. Manually measured ablation stakes provide data at single points that must be revisited every time a measurement is to be made, with typical repeat times of days to months. Additionally, local climatic drivers of ablation between these measurements are not recorded, thereby requiring extrapolation to weather stations. Such extrapolations require assumed lapse rates (Wheler and others, Reference Wheler2014), which can differ substantially between on-ice and terrestrially grounded temperature-measurement stations (Anderson and others, Reference Anderson, Roe and Anderson2014, DR.1). Furthermore, the labor required to repeatedly measure these non-automated stakes places logistical limits both on the number of ablation stakes that may be installed and on the extent of the ablation-stake network. This is compounded by weather-dependent safety concerns regarding glacier travel, which may in turn systematically bias when and under which conditions repeat measurements are made. Additionally, local temperature is sensitive to surface composition, be it ice, snow or debris (e.g. Hagg and others, Reference Hagg, Mayer, Lambrecht and Helm2008), and the associated surface albedo. Paired, automated measurements of temperature (and other climatic drivers) may improve ablation-model predictions.
To date, scientists have explored a number of approaches toward measuring ablation at high temporal resolution. Hulth (Reference Hulth2010) used a tensioned draw wire to measure net ice-surface ablation while mechanically avoiding the impacts of fresh snowfall. Gabbud and others (Reference Gabbud, Micheletti and Lane2015) performed repeat glacier surveys using a terrestrial laser scanner (TLS) over hourly time scales, and Voordendag and others (Reference Voordendag2021) characterized and tested a permanent TLS installation on the Hintereisferner Gletscher (Austria). Netto and Arigony-Neto (Reference Netto and Arigony-Neto2019) designed a data-logging station to slide down a 12 m self-collapsing ablation stake, using radio-frequency identification (RFID) tags to detect each 15 cm of melt. Landmann and others (Reference Landmann2021) measured ablation via automated repeat photos of ablation stakes.
Our work here follows a long history of development and deployment of ultrasonic rangefinders to measure glacier ablation (or accumulation). Labine and Koerner (Reference Labine and Koerner2004) developed a network of ultrasonic rangefinders and temperature sensors across the Canadian arctic in the late 1980s. Oerlemans (Reference Oerlemans2000) deployed a Campbell Scientific ultrasonic rangefinder on a fixed post atop the Morteratschgletscher in Switzerland – alongside a weather station that slid downwards as the ice surface ablated – to monitor accumulation and ablation at a site. Oerlemans and others (Reference Oerlemans, Boot, van den Broeke, Reijmer and van de Wal2004) and Munro and others (Reference Munro, Demuth and Moore2004) deployed networks of on-glacier automated weather stations. Braun and others (Reference Braun, Escher-Vetter, Heucke, Siebers and Weber2004) deployed an on-glacier temperature and ultrasonic-ranging station at the Vernagtferner ice mass. The Icelandic Glacier Automatic Weather Stations (ICE-GAWS) network (cf. Gunnarsson and others, Reference Gunnarsson, Gardarsson, Pálsson, Jóhannesson and Sveinsson2021) includes ultrasonic rangefinders for snow depth and ice-surface ablation. Gusain and others (Reference Gusain, Singh, Mishra, Srivastava and Ganju2009) likewise used an ultrasonic sensor in their study combining energy and mass balance in East Antarctica. Keeler and Brugger (Reference Keeler and Brugger2012) later tested a pair of inexpensive ultrasonic rangefinders on Storglaciären in Sweden, again to measure the distance to the snow and/or ice surface. They demonstrated that even consumer- or hobbyist-grade instruments could be useful for glaciological research. Wickert (Reference Wickert2014) and Wickert and others (Reference Wickert, Sandell, Schulz and Ng2019) provided data from ultrasonic rangefinders (of a different model than those used by Keeler and Brugger, Reference Keeler and Brugger2012), thermistors, and (Wickert and others, Reference Wickert, Sandell, Schulz and Ng2019, only) inclinometers that measure glacier-surface-elevation change and air temperature. Sold and others (Reference Sold2021) applied computer-vision techniques to track melt around traditional ablation stakes. Fausto and others (Reference Fausto2021) present the PROMICE network of weather stations, including ablation stakes, with coverage across Greenland. These stations include ultrasonic rangefinder readings alongside station-tilt measurements and pressure-transducer readings of ablation.
Here we move from the prototype stage demonstrated in our earlier work toward a reproducible automated ablation stake to capture high temporal resolution data on both the amount of ablation and its drivers. The instrumentation to automate these ablation stakes adds little weight (~1.5 kg), costs ~US$700 (in year 2022) and can be assembled in the field within 15–30 min. Having co-located and high-resolution climatic driver data alongside equally high-resolution information on ice-surface elevation should improve melt-factor calculation (cf. Hock, Reference Hock2003) and enable observations of changing melt factors over time. Furthermore, their assistance in generating measurements that are dense in space (rapid deployment; reduced need to visit sites) can help to characterize differing melt rates as a function, for example, of ice properties, debris, elevation and temperature.
Our automated ablation stake design is open source, as is its firmware stack (Schulz and Wickert, Reference Schulz and Wickert2020, Reference Schulz and Wickert2022a, Reference Schulz and Wickert2021a; Schulz, Reference Schulz2021; Schulz and Wickert, Reference Schulz and Wickert2022c) and much of its electronic hardware (Wickert, Reference Wickert2019; Schulz, Reference Schulz2021; Schulz and Wickert, Reference Schulz and Wickert2022b). Furthermore, Wickert (Reference Wickert2023) provides a guide toward assembling and deploying an automated ablation stake. This combination of freely available resources is critical to reducing the cost and improving the reproducibility of the automated ablation stake and its data, especially through studies led by and run through academic and/or non-profit institutions. As such, its open-source and limited-cost design contributes directly to meeting scientific objectives.
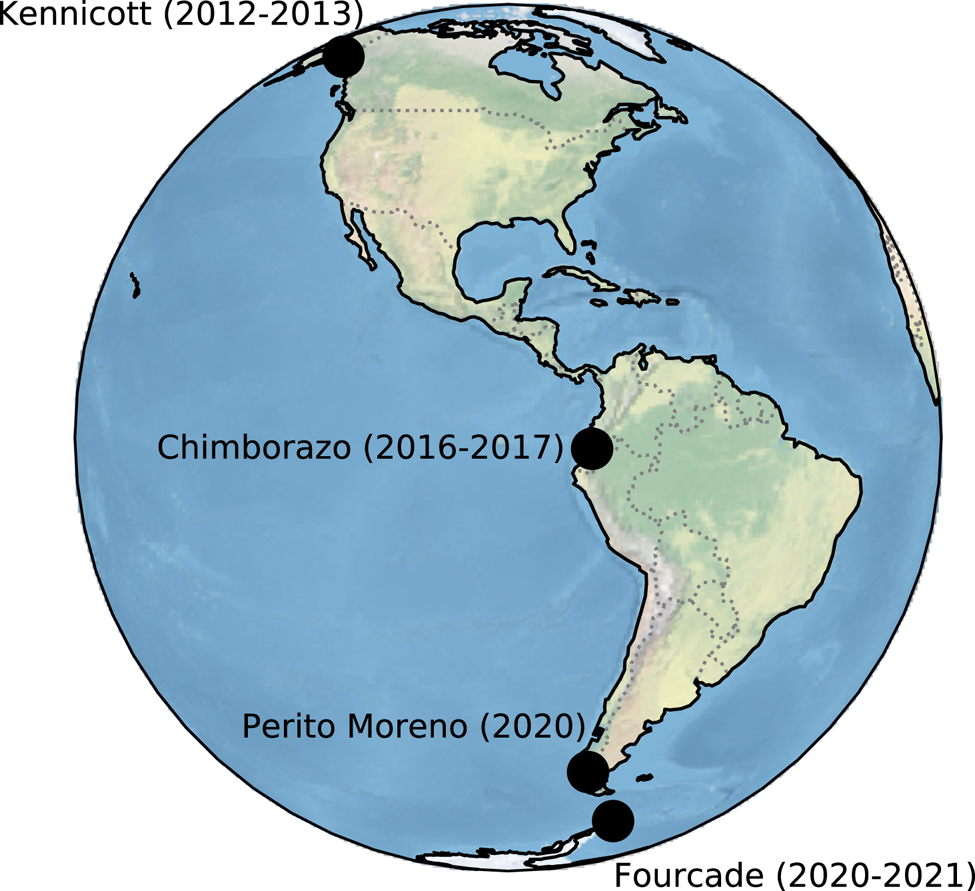
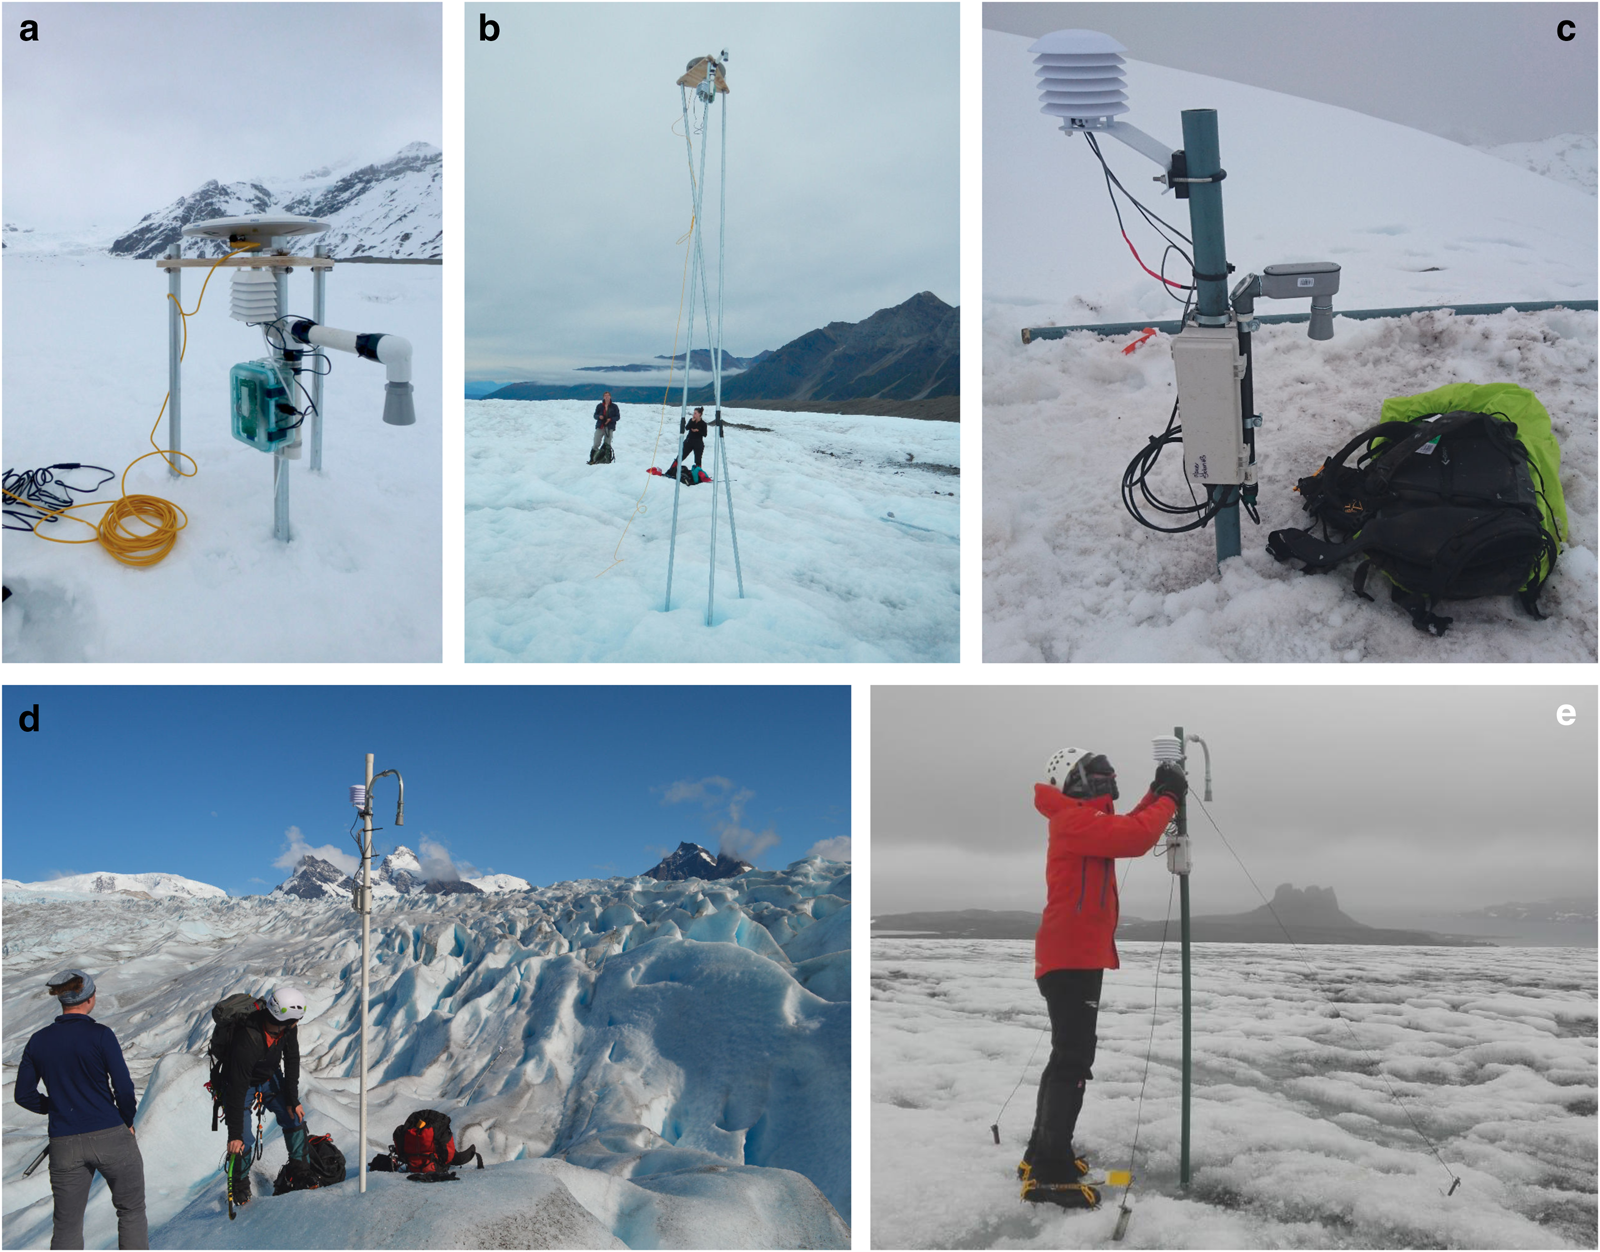
We illustrate automated ablation-stake deployments and development efforts from 2012 to 2021 (data: Wickert and others, Reference Wickert2023). These include field research on Kennicott Glacier (Alaska, USA: Wickert, Reference Wickert2014; Armstrong and Anderson, Reference Armstrong and Anderson2020), Glaciares Reschreiter and Hans Meyer (Chimborazo, Ecuador: Tauro and others, Reference Tauro2018; Saberi and others, Reference Saberi2019; Wickert and others, Reference Wickert, Sandell, Schulz and Ng2019), Glaciar Hermoso (Cayambe, Ecuador), Glaciar Perito Moreno (Santa Cruz, Argentina) and Glaciar Fourcade (Kopuła Warszawy, King George Island, Antarctica), as well as on seasonal snowpack (Saint Paul, Minnesota, USA) (Wickert, Reference Wickert2014; Tauro and others, Reference Tauro2018; Saberi and others, Reference Saberi2019; Wickert and others, Reference Wickert, Sandell, Schulz and Ng2019; Armstrong and Anderson, Reference Armstrong and Anderson2020; Wickert and others, Reference Wickert2023). Here we highlight four of these glacier deployments (Figs 1, 2) and describe the design behind the ablation stakes that enabled these measurements. Our goal is for these stakes to expand the reach of monitoring networks and improve databases for ablation modeling.
Field-deployment sites and their associated years of active data collection. Data for these deployments as well as those in Minnesota, USA (seasonal snowpack) and Glaciar Hermoso, Cayambe, Ecuador are available via GitHub and archived through Zenodo (Wickert and others, Reference Wickert2023).
Automated ablation-stake deployments. (a, b) Kennicott Glacier, Alaska, USA: (a) Installation, 17 May 2012; (b) after melt season, 16 September 2013 (possibly a different station). Pictured: (left) Billy Armstrong and (right) Katy Barnhart. (c) Glaciar Hans Meyer, Chimborazo, Ecuador: 29 June 2016. (d) Glaciar Perito Moreno, Argentina: 13 March 2020. Pictured: (left) Max Van Wyk de Vries and (right) Andy Wickert. (e) Glaciar Fourcade, King George Island, Antarctica: 25 January, 2021. Pictured: Matias Romero.
2. Design
The automated ablation-stake design consists of four elements: (1) a device to measure ablation as a function of time, (2) one or more sensors to measure ambient weather conditions that may drive ice-melt rates, (3) a data logger to operate these sensors and record the information that is returned, and (4) a physical structure to hold the sensors and data logger and serve as a stable mounting point for distance measurements. Based on four separate deployments (Fig. 2), we developed a set of recommendations for designing and constructing automated ablation stakes (Table 1). Here we describe our decisions and rationale toward each of the four required elements.
Recommended design elements for future automated-ablation-stake designs and installations alongside those used for our four deployments

T, temperature; RH, humidity.
a Schulz and Wickert (Reference Schulz and Wickert2022b).
b Wickert (Reference Wickert2014); Wickert and others (Reference Wickert, Sandell, Schulz and Ng2019).
c 1 mm resolution; 500–9999 mm range.
d 1 cm resolution; 20–765 cm range.
e 1 mm resolution; 300–5000 mm range.
f Wickert (Reference Wickert2019).
2.1 Measuring ablation: ultrasonic rangefinder
We recommend measuring ablation by determining the distance from a fixed point above the ground to the snow and/or ice surface using a MaxBotix brand ultrasonic rangefinder (cf. Evans, Reference Evans2016; Tauro and others, Reference Tauro2018; Wickert and others, Reference Wickert, Sandell, Schulz and Ng2019), model MB7388 (500–9999 mm range), which is IP67-rated for waterproofness. These rangefinders measure the two-way travel time of an emitted ‘ping’ of sound and report the distance to the surface creating the largest acoustic return. They are sensitive to targets spanning a ~0.3 m radius centered on the rangefinder. Although the MB7388 is not a model that we used in any of our past deployments (Table 1), it combines two features we found most helpful from sensors that we did use, namely the longer range of the MB7386 with the strongest-target filtering of the MB7389. The MB7388 returns data via a TTL serial protocol: Data are sent as a series of bits, in which a high voltage is interpreted as ‘1’ and a low voltage is interpreted as ‘0’, at a baud rate of 9600 bps. This data rate is slow enough that its outputs can be reliably interpreted by software emulations of a serial port as well as by true hardware serial receivers, thereby permitting it to be connected to a wider range of data-logging microcontrollers. The MB7388 is precise to 1 mm and accurate to $< 1\%$ ; if desired, multiple range measurements may be made to obtain more complete distance statistics.
We chose these ultrasonic rangefinders instead of laser rangefinders (e.g. LiDAR Lite v3 HP) for two reasons. First, the 6-order-of-magnitude slower speed of sound than light in air permits higher precision distance measurements even with substantially less precise timekeeping. In this case, the LiDAR Lite is precise to 10 mm and accurate to ±25 mm (targets ≥2 m distant) or ±50 mm (targets <2 m distant) based on tests with water surfaces (Paul and others, Reference Paul, Buytaert and Sah2020). Second, the ultrasonic rangefinder returns the distance to the largest acoustic reflector within the path of its ~30 cm-radius beam. Therefore, it can filter out local-scale roughness – for example, snow bedforms (Kochanski and others, Reference Kochanski, Anderson and Tucker2019) and variability in ice melt – better than the mm-scale point measurements from a laser rangefinder or manual measurements to the base of an ablation stake.
We connect a temperature-correction unit (‘HR-MaxTemp’) to the ultrasonic rangefinder to correct for the temperature-dependent speed of sound in air. We house this inside a Dwyer Series RHRS 6-plate solar radiation shield. This corrects for an approximately 0.19% $^\circ$ C−1 error in the distance measurement, which corresponds (for example) to ±4 mm $^\circ$
 C−1 when the rangefinder is ~2.1 m from the ice surface.
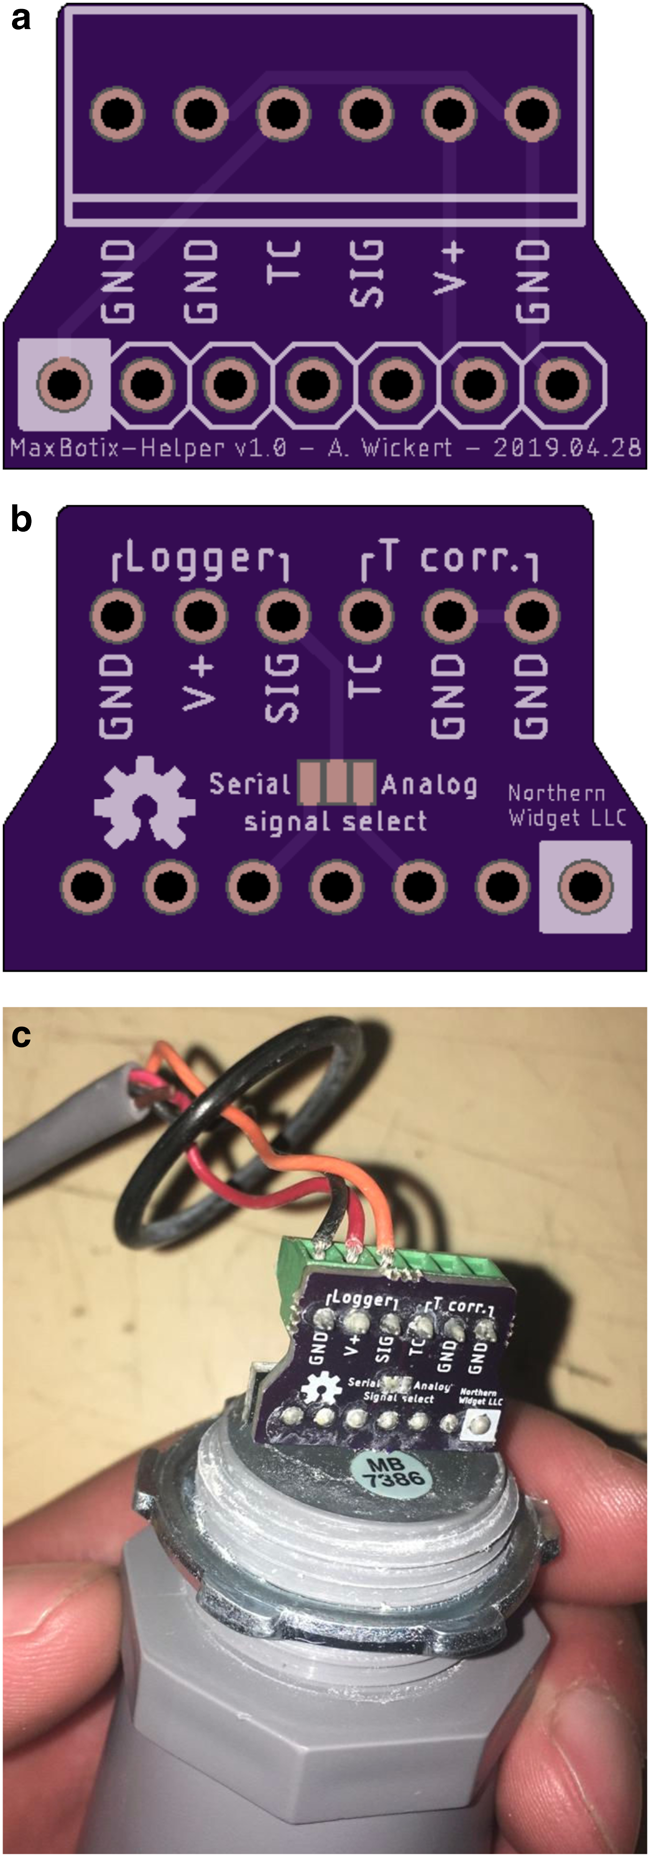
We wire the MaxBotix ultrasonic rangefinder to both the data logger and its MaxTemp temperature-correction circuit through the open-source MaxBotix-Helper circuit board (Fig. 3; design and assembly information available from Wickert, Reference Wickert2019), which provides screw-terminal connections to MaxBotix ultrasonic rangefinders. It addresses three issues that we experienced during development, assembly and installation. First, the MaxBotix-Helper attaches to the ultrasonic rangefinder with a stiff seven-pin header (Fig. 3c) that spans all of its solder rings, providing a stable connection platform despite the small amount of metal around each ring on the rangefinder for soldering. Second, connecting the cable to a screw terminal allows the cable to be replaced if it breaks, and therefore, for functional sensors to be reused following cable failure. Finally, multiple connections need to be made to the ground (GND) solder ring on the rangefinder; such connections are more difficult to make and may be more easily broken. Therefore, the MaxBotix-Helper provides three screw-terminal connections to individual ground pins to ensure that one is available per required connection (Fig. 3b). In addition to solving these three issues, the solder jumper on the MaxBotix-Helper permits the user to select an analog voltage or serial output to appear on the SIG pin. The analog voltage derives from the the serial output, and is provided in case a data logger has no available serial-receive pin.
MaxBotix-Helper. (a) Circuit-board front. Platform for soldering the 0.1-inch (2.54 mm) pitch screw-terminal header block denoted. Screw-terminal pins labeled as follows: GND: ground; TC: temperature compensation; SIG: signal, which could be either an analog voltage or a digital serial signal; V+: positive voltage (2.7–5.5 V). White square corresponds to the square on the MaxBotix silkscreen, which denotes pin 1. Image generated by OSH Park. (b) Circuit-board back. Screw-terminal pins are grouped into those intended for the logger and those intended for the MaxTemp temperature correction. The solder jumper is used to select whether the SIG pin outputs a serial signal or an analog voltage. Image: OSH Park. (c) MaxBotix-Helper installed and connected to a Margay data logger (Schulz and Wickert, Reference Schulz and Wickert2022b). Photo: Matias Romero, Base Carlini, King George Island, Antarctica.
An optional but helpful part of any ablation-measurement system is an inclinometer to measure the angle between the distance-measurement device (e.g. ultrasonic rangefinder) and the vertical. This can show if the automated ablation stake has been disturbed, correct inclined measurements to vertical distance, and indicate when to no longer trust the vertical distance data (Wickert and others, Reference Wickert, Sandell, Schulz and Ng2019, Fig. 5; data from Chimborazo, Ecuador). We used a Murata SCA100T-D02-1 (Table 1), which is no longer in production. Based on our use of the STMicroelectronics LIS3DHTR MEMS accelerometer as an inclinometer in a separate design (Schulz, Reference Schulz2019), we recommend incorporating it in future designs (Table 1).
In order to record the distance to the ice surface over time, the ultrasonic rangefinder must be connected to a data logger. Open-source (e.g. Arduino-compatible) data loggers provide an effective and low-cost option (e.g. Wickert, Reference Wickert2014; Beddows and Mallon, Reference Beddows and Mallon2018). We initially wrote custom code for each data-logger deployment (cf. Wickert and others, Reference Wickert, Sandell, Schulz and Ng2019), and have now produced an open-source library that provides a standardized API and pre-built functions to communicate with the MaxBotix ultrasonic rangefinder via software-serial methods (‘MaxBotix_Library’: Schulz and Wickert, Reference Schulz and Wickert2020).
Our primary goal in measuring distance is to calculate ablation rate. However, the ultrasonic rangefinders will also measure accumulation. In the example below, no accumulation occurs, thereby simplifying data processing.
2.2 Climatic drivers: temperature and relative humidity
Major drivers of glacier energy balance include incoming shortwave radiation, outgoing longwave radiation, and air temperature (e.g. Litt and others, Reference Litt2019). Wind speed and humidity measurements can also be made to help constrain sublimation (e.g. MacDonell and others, Reference MacDonell, Kinnard, Mölg, Nicholson and Abermann2013). At lower elevations and higher atmospheric pressures, temperature alone can serve as a suitable proxy for energy balance (Litt and others, Reference Litt2019).
We measure climatic drivers of ablation on the same stakes used to record ice-surface lowering. This avoids problems of interpolation or extrapolation of climatic data to the ablation-stake sites. Three considerations with this approach are that: (1) the measurements occur over an ice surface, (2) the measurement elevation above the ice surface may change with time, and (3) the stakes will eventually melt out and fall over. We consider these below.
Our earliest ablation stakes measured temperature alone using a thermistor and reference resistor (Table 1, Kennicott and Chimborazo). We connected these via a voltage divider to the 10-bit analog–digital converter (1024 total measurement increments) on the ALog data logger (Wickert, Reference Wickert2014; Wickert and others, Reference Wickert, Sandell, Schulz and Ng2019; Armstrong and Anderson, Reference Armstrong and Anderson2020). This provided ~0.1$^\circ$ C resolution temperature data (Table 1; Figs 2a,b).
Our more recent designs incorporate the IP67-rated Amphenol Telaire T9602 relative-humidity and temperature sensor, for which Schulz and Wickert (Reference Schulz and Wickert2022c) wrote an open-source Arduino-compatible library that implements a standardized API. The T9602 returns data at 14-bit precision (16 384 total measurement increments) with accuracies of ±2% relative humidity and ±0.5$^\circ$ C. Its IP-rated waterproof status is important: the potential for rapid melt atop a glacier can create a cold and humid environment that promotes condensation and could ruin unprotected sensors. The T9602 is our preferred sensor because it has proven robust in multiple field deployments, adds only modest additional cost and no additional design complexity (cf. Schulz, Reference Schulz2021) over a more basic temperature sensor, adds an additional measurement usable for an energy balance, and includes a round cable that enables a tight seal via the cable-gland gasket to keep moisture out of the data-logger box.
2.3 Data logger: Margay
Our designs implement the open-source and Arduino-compatible data loggers that we have developed since 2011 (Wickert, Reference Wickert2014; Wickert and others, Reference Wickert, Sandell, Schulz and Ng2019; Schulz, Reference Schulz2021; Schulz and Wickert, Reference Schulz and Wickert2022b). We suggest such a data logger for the following three reasons: (1) Open-source systems are commonly inexpensive (Beddows and Mallon, Reference Beddows and Mallon2018; Ensign and others, Reference Ensign2019; Wickert and others, Reference Wickert, Sandell, Schulz and Ng2019), and instruments mounted on ablation stakes atop glaciers may be lost. (2) Arduino-compatible designs can take advantage of the sensor libraries that we have developed (Schulz and Wickert, Reference Schulz and Wickert2020, Reference Schulz and Wickert2022c). (3) Arduino-compatible open-source devices have built-in interfaces to communicate with the MaxBotix ultrasonic rangefinder (hardware or software serial), the T9602 temperature and relative-humidity sensor (I2C bus) and thermistors on voltage dividers (analog–digital converter).
Our preferred data logger is the Margay, developed since late 2017 by Schulz and Wickert (Reference Schulz and Wickert2021b, Reference Schulz and Wickert2022b). It is small (42.3 × 50.5 mm – half the size of a credit card) and lightweight (15.7 g). It can run for 2–4 years on 3×AA primary alkaline cells at 5 min logging intervals, and its hardware is rated to run from −40 to +85$^\circ$ C. Its firmware libraries (Schulz and Wickert, Reference Schulz and Wickert2021a) mesh smoothly with the sensor APIs (Schulz and Wickert, Reference Schulz and Wickert2020, Reference Schulz and Wickert2022c). Its 18-bit ΣΔ analog–digital converter can read thermistors at 256× the resolution of the earlier ALog (Wickert, Reference Wickert2014; Wickert and others, Reference Wickert, Sandell, Schulz and Ng2019; Schulz, Reference Schulz2022) Data are stored in human-readable CSV files onto a swappable SD card.
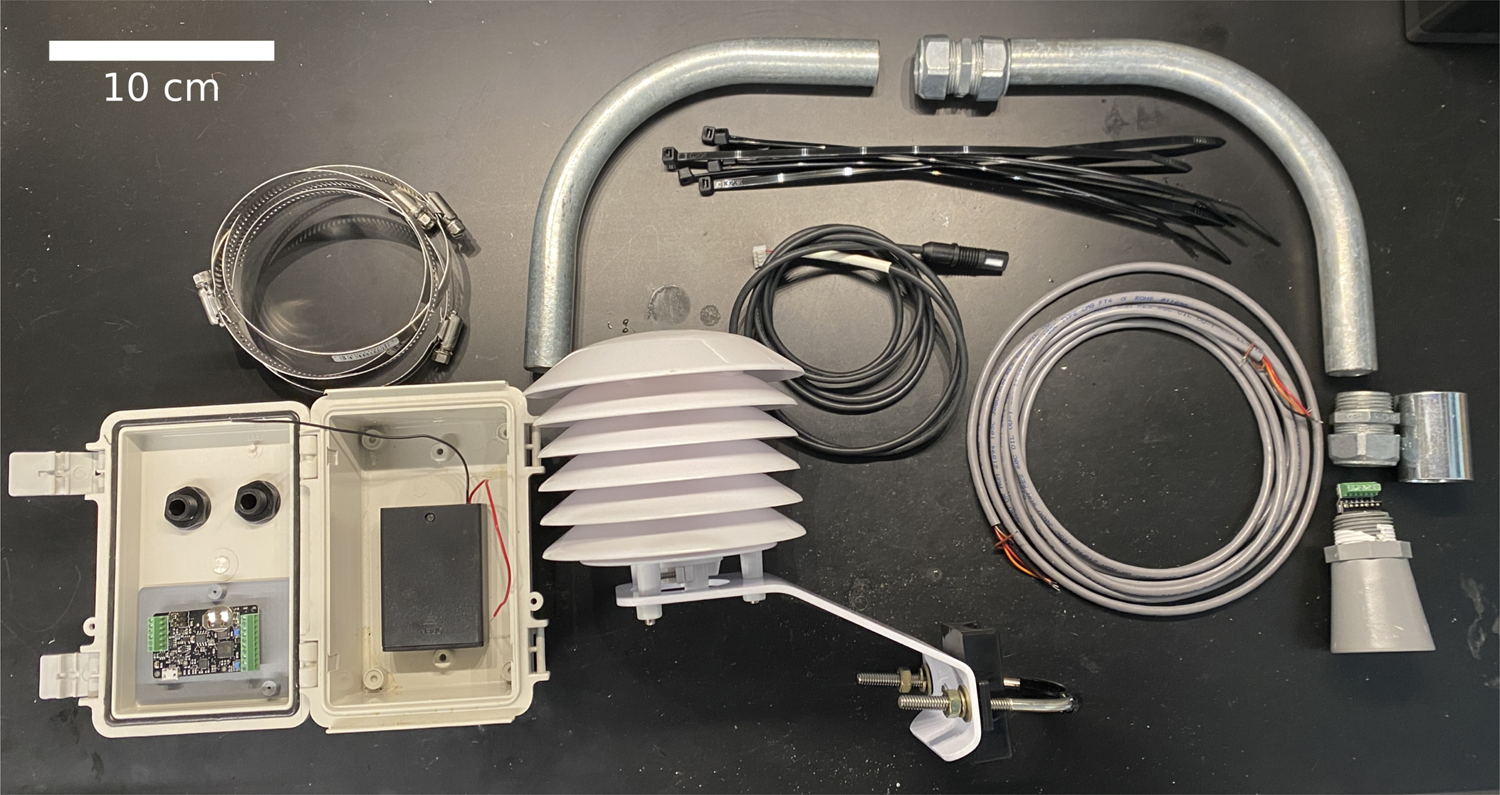
Due to harsh polar and alpine weather conditions – including rime ice, snow, rain and condensing humidity – all electronics must be appropriately weatherproofed. Whereas the sensors are IP-67 rated, the data logger is not and so should be protected. We recommend a Polycase WH-04 enclosure, which is small (150 × 100 × 70 mm) but sufficient to hold the data logger and its batteries, as well as tightly sealing cable glands to link the data logger to the sensors (Fig. 4; Table 2) and desiccant packs.
Materials to assemble the sensing component of the automated ablation stake. Lower left: Box with cable glands, Margay data logger and 3 ×AA battery pack. Upper left: 4× hose clamps. Upper right: Conduit inverted U with compression connector (top) and compression adapter (right); compression adapter threads onto the straight connector (far right) to attach to the MaxBotix ultrasonic rangefinder (lower right). Above middle: cable ties. Center (black cable): Temperature and relative-humidity sensor. Center right (gray cable): Cable to attach the MaxBotix ultrasonic rangefinder to the data logger. Lower middle: Solar radiation shield. Not pictured: MaxTemp temperature correction for the ultrasonic rangefinder; mounting hardware for the ultrasonic rangefinder.
Component list
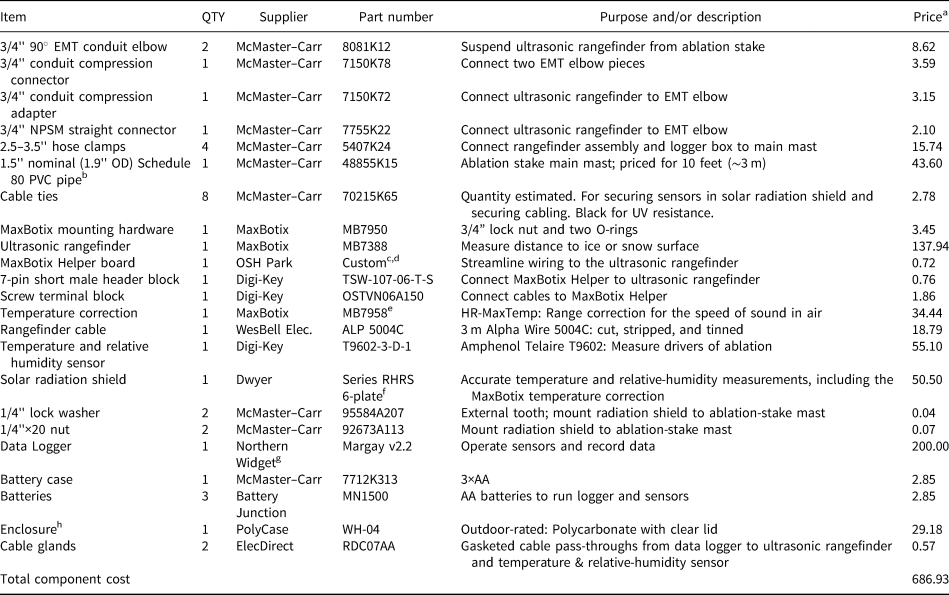
a US$ in year 2022 and given at the quantity required to build one system or the minimum order quantity, whichever is smaller.
b 48–50 mm OD PVC also works; the target outer diameter is 2”. Items to stabilize the main mast are not included because we have not fully researched what the best option may be.
c Use CAD files from Wickert (Reference Wickert2019).
d Although an inclinometer can be helpful, incorporating one would require including and/or designing a new circuit board, which is not part of the present design. We would recommend modifying the MaxBotix-Helper (Wickert, Reference Wickert2019) to include the integrated ATTiny microcontroller, STM and STMicroelectronics LIS3DHTR, with a firmware-enabled I2C interface (following Schulz, Reference Schulz2019).
e Other HR-MaxTemp options are available that are less expensive and not fully assembled.
f Yellows and becomes brittle with UV exposure.
g Design is also available open source (Schulz and Wickert, Reference Schulz and Wickert2021b).
h Not listed here are optional and/or custom items used with the enclosure, including adhesives and/or fasteners to secure the logger and batteries and desiccant packs.
2.4 Physical hardware
We recommend mounting the ultrasonic rangefinder at one end of an inverted U made of two 3/4” EMS conduit elbows held together with a compression coupling (Figs 2d,e; parts required in Table 2). This provides an easy way to securely hold this unit together in the field, while also permitting it to be broken down if needed for travel. To affix the ultrasonic rangefinder, we use a compression adapter that connects to a straight NPSM (National Pipe Straight Mechanical) connector. This can tighten down around the rangefinder with the aid of a lock nut and O ring. Wires pass down and out of the end of the U opposite the ultrasonic rangefinder, ensuring that water will not run down them and into the remainder of the apparatus (Fig. 4). If desired, this end may be sealed, either using cable glands and an appropriate compression adapter or a silicone sealant. We did not seal this end of the conduit U and encountered no problems. Using a pair of hose clamps (2.5–3.5-inch diameter: ~6.3–8.9 cm), we then affix this to the ablation stake.
Our ablation stake is a 2-inch (≈5 cm) outer diameter (OD) polyvinyl chloride (PVC) or high-density polyethylene (HDPE) pipe. This provides a smooth but snug fit into a hole bored vertically into the ice using Kovacs augers. Furthermore, PVC pipe is lightweight and thermally insulating relative to metal options, and this helps the field team bring it onto the glacier and prevents the stake from preferentially melting out of the ice. We recommend Schedule 80 pipe, as more rigid pipe helps to minimize sensor wobble as the ablation stake melts out. We are nonetheless concerned about the impact of these plastic ablation stakes on an otherwise pristine environment if they cannot be successfully recovered and have considered – though not yet implemented – environmentally degradable materials.
We install both the ‘MaxTemp’ temperature-compensation device for the ultrasonic rangefinder and the T9602 temperature and relative-humidity sensor into the solar radiation shield. This shield contains an inner screw-adjusted clamp that may be useful for at least one of these, but for reasons of speed and fit, we typically secure one or both into the housing using cable ties. Proper ventilation of such a shield is important, especially under windless and clear-sky conditions. Passively ventilated shields such as the one that we use experienced excess heating of 0.3–1.3$^\circ$ C (Cordillera Blanca, Peru: Georges and Kaser, Reference Georges and Kaser2002) and up to 8$^\circ$
 C (East Antarctic Plateau Morino and others, Reference Morino2021) when compared to mechanically ventilated shields. While these passive shields have advantages in simplicity and power requirements, care must be taken to ensure that effective passive ventilation can take place.
Following this, we attach both the solar radiation shield and the data-logger box to the 2-inch PVC pipe in a location that is out of the path of the ultrasonic rangefinder. For the data-logger box, we employ these same 2.5–3.5 inch hose clamps; smaller hose clamps could be used, but we find it best to limit the number of unique parts required when managing field-deployment logistics, especially when two can look similar and may be confused during field preparations. These are run through slots in the metal ‘feet’ of the data-logger box and cinched down around the PVC ablation-stake mast. The recommended solar radiation shield comes with its own 2-inch U bolt, which includes a rubberized component that adds friction and is ideal for the 2-inch PVC pipe ablation-stake mast. Its lock nuts are slow and difficult to use in the field, so we recommend that users bring separate 1/4”–20 nuts and lock washers as indicated in Table 2.
We secure any slack from cables to the data-logger main mast, out of the way of the ~0.3 m sensing radius of the ultrasonic rangefinder. Electrical cables can easily blow in the strong winds common on glaciers while simultaneously becoming more brittle due to UV damage. This combination can cause them to break, making it imperative to properly secure them.
2.5 Installation and maintenance
We install the automated ablation stake by drilling a hole using Kovacs ice augers, ensuring both that it is vertical and that its depth will keep the rangefinder beyond its minimum range (0.5 m for the MB7388) from the ice surface. We then insert the PVC pipe into this hole while packing excess ice shavings around it; adding these and water helps to freeze the ablation stake in place.
A design using just a single pole is relatively lightweight, but is more likely to bend as melting exposes a taller mast and can be prone to rotation in the wind. To avoid problems related to bending, we used thicker and more rigid plastic pipe and – in some of our designs – included an inclinometer to detect and correct for a non-vertical sensor. To address both of these problems, we suggest that installations when possible be made in flat areas of the ice surface. Furthermore, we secured the ablation stakes on Glaciar Fourcade (Fig. 2e) with three staked guy wires, which we adjusted and re-staked during data-download visits (2–3 times per week). An alternative option is to build a more stable platform with multiple masts extending into the glacier surface, as we had on Kennicott Glacier (Armstrong and Anderson, Reference Armstrong and Anderson2020) (Figs 2a,b), though a more stable set-up could include farther-spaced masts (e.g. Oerlemans, Reference Oerlemans2000; Munro and others, Reference Munro, Demuth and Moore2004) to prevent the net twisting noticeable between Figures 2a and b.
Maintaining battery life requires knowledge of power consumption and equipment used. The most recent deployments employ Margay data loggers (Schulz and Wickert, Reference Schulz and Wickert2021b), which draw 1.3 μA (quiescent) and 8.6 mA (active). When active, the sensors require 2.9 mA (MaxBotix rangefinder) and 0.750 mA (T9602 temperature and relative-humidity sensor); considering the usage of the additional temperature sensor (MaxTemp) and rounding up for safety, the active current draw is ≤13 mA. Considering a conservative AA battery capacity of 2000 milliamp-hours, one reading per 5 min, and a sampling time of 2 s, the device should last for approximately 2.5 years.
Upon each installation and site visit, one should take local measurements as ground truth and perform maintenance: (1) Measure and record the distance from a marked point on the ablation stake – either the rangefinder sensing element or something that is offset a known distance from this – to the snow/ice surface. (2) Note and photograph the state of the stake and ground surface, including information on snow vs ice cover, any damage to the stake, and tilt or excessive melt or wind scour (or shielding from melt) around the mast. (3) Record the coordinates of the stake; this can be useful additional information for ice velocity and for finding the stake again on a moving glacier; such positioning information comes alongside a timestamp, as should photos, and this can help to filter bad data, including rangefinder returns off of humans standing on the ice. (4) If the data logger can be reached, download and/or swap its data-storage device. Sometimes ablation stakes disappear. (5) Replace the batteries if needed. (6) Move and reinstall the ablation stake if it seems unstable; record if and when this has been done.
3. Temperature-index melt modeling
The critical advantage of having co-located and high-resolution temperature and ablation data lies in the opportunity to calibrate, probe and expand well-established temperature-index modeling approaches (e.g. Braithwaite and Olesen, Reference Braithwaite and Olesen1989; Hock, Reference Hock2003). Each automated ablation stake provides its own self-contained calibration site for a temperature–ablation relationship. The frequent data allow us to investigate different methods and time windows over which to estimate the ‘melt factor’, which relates temperature to ablation rate, and to explore systematic variations in its value. Indeed, Hock (Reference Hock2003) notes the importance of such highly time-resolved data to avoid averaging across temperatures above and below T 0.
Although each ablation stake is self-sufficient, every deployment pictured in Figure 2 employed ~3 ablation stakes per glacier (Wickert and others, Reference Wickert2023) to account for potential local variability in melt rate (Braithwaite, Reference Braithwaite2008) and to ensure redundancy in the case of equipment failure. When deployed along an elevation transect, these multiple ablation stakes can also record the on-ice temperature lapse rate (Romero and others, Reference Romero2022), which can aid mass-balance modeling (cf. Anderson and others, Reference Anderson, Roe and Anderson2014).
3.1 Temperature-index models and melt factors
A typical temperature-index ablation model has the form (partially following variable nomenclature from Hock, Reference Hock2003):

Here, $\,\,\, \dot {\!\!\!{\cal A}}$ is ablation rate [mm w.e. d−1]; f m is a ‘melt factor’ [mm w.e. $^\circ$
 C−1 d−1], which linearly scales temperature to ablation rate (and is a slight misnomer because ablation may include sublimation in addition to melt); T is the air temperature; and T 0 is the air temperature at which ablation begins. When T 0 is zero, f m may also be called the degree-day factor (DDF), and this equation may be called a ‘positive-degree-day’ (PDD) ablation model. To create a variable representing the temperature used in such a PDD model, we define T +, the ‘positive temperature’ to be equal to the temperature when above the freezing point and 0 when at or below the freezing point,

Despite the common use of temperature-index melt models, a range of both averaging times (typically one day, though this may be hourly to monthly) and measurement periods (a few days to several years) have been used to obtain f m, thereby making intercomparison among studies difficult (Hock, Reference Hock2003). Here we demonstrate the utility of the automated ablation stakes by applying data from one installation – on Glaciar Perito Moreno, Argentina – to address and develop methods to approach melt-factor calculation and temperature-index model generation.
3.2 Data: Perito Moreno
As an example implementation of these automated ablation stakes, we present data from a February–March 2020 ablation-stake installation near the southern margin of Glaciar Perito Moreno, Patagonia, Argentina (Stake AS-1 out of three stakes total; Figs 2d, 6). We installed this ablation stake on a prominent and locally flat surface within this heavily crevassed region of ice. Distance to the ice surface, atmospheric temperature and atmospheric relative humidity were measured and recorded every 5 min, and raw data are available from Wickert and others (Reference Wickert2023). Additionally, we established a weather station immediately off-ice from these ablation stakes (Van Wyk de Vries and others, Reference Van Wyk de Vries, Wickert, Macgregor, Rada and Willis2022; Wickert and others, Reference Wickert2022), whose measurements of temperature and relative humidity are consistent those measured at the automated ablation stakes (Fig. 5). Importantly, these measurements include wind speeds, which average to 0.6 m s−1 and therefore indicate sufficient ventilation of the temperature and relative humidity sensors. For contextual information on Glaciar Perito Moreno and its mass balance, see Stuefer and others (Reference Stuefer, Rott and Skvarca2007) and Minowa and others (Reference Minowa, Skvarca and Fujita2023).
(a) Relative-humidity and (b) temperature records from the ablation stake demonstrated here (AS-1; 50.5162$^\circ$ S, 73.1280$^\circ$
 W) and the nearby weather station that we installed (WS-2: Buscaini; 50.51844$^\circ$
 S, 73.12766$^\circ$
 W). (c) Off-ice temperatures are generally higher and more variable (see panel b) than those in the supraglacial boundary layer. The gray line denotes unity. Data are from the year 2020.

The Perito Moreno AS-1 dataset exhibits approximately monotonically increasing distance to the ice surface, indicating persistent ablation without accumulation, alongside temperatures that are always $> 0^\circ$ C (Fig. 6). Both factors streamline data interpretation. To convert ablation distances into water-equivalent loss, we follow Stuefer and others (Reference Stuefer, Rott and Skvarca2007) in assuming an ice density of 900 kg m−3.
Measured ice-surface elevation, atmospheric temperature and relative humidity on Glaciar Perito Moreno, Argentina, from late February to mid March, 2020. The ablation stake was installed near the southern margin of the glacier. (a) Distance to the ice surface nearly monotonically increases, indicating persistent and near-continuous ablation without the complication of snow cover. (b) Temperatures are nearly entirely above the freezing point during the measurement period. (c) Relative humidity increases during times of cooling due to the decreased saturation vapor pressure of air.

3.3 Estimating the melt factor, f m
We estimate f m using three methods. First, we compute total melt and PDDs (following Braithwaite and Olesen, Reference Braithwaite and Olesen1989; Braithwaite, Reference Braithwaite2008) to calculate a melt factor representative of the full observed period. In the second, we compute a linear regression between daily melt rate and daily temperature (cf. Howat and others, Reference Howat, Tulaczyk, Rhodes, Israel and Snyder2007). Our third method is a discrete integration to compare net ablation to total PDDs, taking advantage of the high temporal resolution of the data supplied by the automated ablation stake.
3.3.1 Total ablation
We divide the total amount of ablation – calculated as the difference in mean ice-surface elevation between the initial and final hours of the deployment – by the total positive degree days during the deployment. From this, we obtain $f_{\rm m} = 1256\, {\rm mm}\ {\rm w.e. } / {\rm }( 9.8 {\rm }^\circ {\rm C} \cdot 18.7 {\rm d}) = 6.8$ mm w.e. $^\circ$
 C−1 d−1. This value is lower than the 7.4 mm w.e. $^\circ$
 C−1 d−1 mean rate found for Austral summer ablation in similarly crevassed, ice-marginal areas of Glaciar Perito Moreno, though there was significant scatter among the individual stake measurements (Stuefer and others, Reference Stuefer, Rott and Skvarca2007). It lies well within the 7.3 ± 2.7 mm w.e. $^\circ$
 C−1 d−1 mean and standard deviation of DDF values compiled from 92 individual measurement sites worldwide (Brugger and others, Reference Brugger, Leonard, Refsnider and Dolan2021).
3.3.2 Ablation rate vs temperature
We follow Eqn (1) to compute f m and T 0. Within a given time window, we compute average melt rate through a linear regression of distance from the ultrasonic rangefinder to the ice surface with time. Over this same time window, we compute the mean temperature. We then perform a second linear regression, this time of melt rate vs temperature, to compute f m and T 0 (following Eqn (1)).
Using the 5 min data from Glaciar Perito Moreno, we repeated this calculation over time windows ranging from 30 min to 4 d (Fig. 7). We performed no filtering or outlier removal prior to these fits, and their quality represents the combined effects of (a) instrumental accuracy and precision and (b) physical grounds for the correlation. Both f m and T 0 converged to consistent values for averaging times $\gtrsim 12$ h (Fig. 8), in agreement with the diurnal cycle in melt factor, forced by solar radiation, noted by Singh and Kumar (Reference Singh and Kumar1996). R 2 increased throughout because of both this convergence and data averaging across longer windows. For time windows ≥12 h, f m ≈ 12.5 mm w.e. $^\circ$
 C−1 d−1 and $4.5 \lesssim T_0 \lesssim 5.2\; ^\circ {\rm C}$
 . The unusually high values for both T 0 and f m are artifacts of our data series, in which time-resolved f m decreases (Fig. 9) as temperature also drops. In contrast, the degree-day factor (DDF) – that is, the melt factor when T 0 is set to 0$^\circ$
 C – for the commonly used 1 d averaging window (Hock, Reference Hock2003) is 7.6 mm w.e. $^\circ$
 C−1 d−1; here, R 2 = 0.53 (Fig. 9a).
Melt-factor (f m) and melt-threshold-temperature (T 0) calculations using a linear regression between temperature and ablation rate. Within each averaging window, we compute the mean temperature and an ablation rate calculated via a linear regression between distance to the ice surface, obtained from the ultrasonic rangefinder, and time.

Temperature-index fit parameters as a function of time-window length. Each point corresponds to a subpanel plot of Figure 7. (a) Melt factor, f m. (b) Temperature at which ablation begins, T 0. (c) Coefficient of determination, R 2. The parameters converge when measurements are averaged over $\gtrapprox$ 12 h.

Melt-factor calculations. (a) Computation of melt factors using a regression between temperatures and daily melt rates. DDF: positive-degree-day melt factor. Intercept at T = 0 (i.e. T 0 = 0 $^\circ$ C; DDF calculated): R 2 = 0.52. Intercept allowed to vary (i.e. f m calculated): R 2 = 0.69. (b) Melt-factor calculation via an integral approach (Eqn 3). R 2 = 0.96 for the linear regression on the full dataset, which includes a systematic bias in the residuals. Data-subset fits beginning (arbitrarily) every 50 positive degree days produce degree-day factors that decrease systematically from 10.3 to 3.9 mm w.e. $^\circ$
 C−1 d−1.

3.3.3 Integral approach
We take advantage of our 5 min data to build a discrete integral of total positive-degree days to compare against the total amount of ice-surface lowering:

Here, ${\cal A}_n$ is the cumulative ablation from the start of the measurement time series until time t n. Based on the mean ice-surface-lowering rate (3.15 mm h−1) and the sensor precision (±1 mm), these 5 min data should fully resolve ablation within instrumental precision.
Using Eqn (3), we compute a linear fit (Fig. 9b), which results in a DDF of 7.5 mm w.e. $^\circ$ C−1 d−1, with a coefficient of determination of R 2 = 0.96; this melt factor value is identical to that from the regression over daily data for which the temperature intercept is 0 (Fig. 9a). The closer fit between model and data is unsurprising because integral approaches sum and smooth random error. Furthermore, it is close to the DDF of 7.4 mm w.e. $^\circ$
 C−1 d−1 obtained by Stuefer and others (Reference Stuefer, Rott and Skvarca2007) on Glaciar Perito Moreno using a similar integral approach with frequently measured total ablation (their Fig. 6b). Although we do not perform such a calculation here, it is possible to apply this integral approach to find a nonzero T 0 alongside an associated f m.
4. Discussion
4.1 Temperature-measurement height
The fixed position of the atmospheric sensors on the stake – inside the solar radiation shield – results in their elevations above the ice surface increasing as the glacier ablates. This contrasts with standard atmospheric monitoring deployments that are 2 m above the surface (e.g. Greuell and Böhm, Reference Greuell and Böhm1998). Marshall and others (Reference Marshall, Sharp, Burgess and Anslow2007, pp. 388–389) systematically measured temperatures from 0.1 to 2.0 m above the surface at 0.1 m intervals, and found that sensors deployed above 0.5 m reported temperatures within 0.1 $^\circ$ C of one another, though this may be vary with surface roughness and wind shear. Atmospheric sensors for the automated ablation stake are always installed $\gtrapprox 0.5$
 m above the ice surface because the solar radiation shield should be above the ultrasonic rangefinder, whose minimum ranging distance is 0.3–0.5 m. To maintain a constant temperature-sensor height above the ice surface in future designs, the temperature sensor could be mounted to maintain a constant height above the glacier surface – for example, on a PVC tube that slides freely down a thinner pole that is fixed into the ice (following Oerlemans, Reference Oerlemans2000), a platform that moves down with the melting glacier surface, or a pendulum-stabilized tripod that likewise lowers with the ice surface (Kaser and others, Reference Kaser, Irmgard and Giegele2004).
4.2 On-ice measurements and the glacial boundary layer
Because the ablation-stake temperature sensor samples the air in the boundary layer above the ice surface, its readings may be affected by ice melt, sublimation, reflected radiation, and/or other mechanisms of ice–atmosphere energy exchange. This is a concern because Guðmundsson and others (Reference Guðmundsson, Björnsson, Pálsson and Haraldsson2009) found that off-ice temperature data better represent the incoming solar radiation flux than do on-ice data, indicating that off-ice data could be more appropriate to drive temperature-index ablation models. Furthermore, such boundary-layer energy transfer may make the ablation-stake record distinct from those measured by off-ice stations or produced as outputs from downscaled atmospheric models. Both of the latter are used to drive temperature-index melt models.
To investigate this question in our test case, we compared the ablation-stake data against data recorded at the nearby off-ice weather station (WS-2: Buscaini) that we also installed (Wickert and others, Reference Wickert2022). We note strong similarity in both temperature and relative humidity between these on-ice and off-ice data (Fig. 5). For the period over which both on- and off-ice data exist, f m = 7.3 mm w.e. $^\circ$ C−1 d−1 using the on-ice data and f m = 6.5 mm w.e. $^\circ$
 C−1 d−1 using the off-ice data, both using the integral approach. The higher f m for the ablation-stake temperature record reflects the lower average air temperature above the glacier than at the off-ice weather station. The curved systematic departure from a linear ablation–PDD fit (Fig. 9) persisted regardless of whether on-ice or off-ice temperature data were used.
4.3 Deviation from a constant DDF
Despite the high R 2 value shown using the integral approach (Fig. 9b), the data systematically trend off of the linear fit. By splitting the time series into four bins, starting each 50 degree days, we demonstrate a monotonic decrease in DDF from 10.3 mm w.e. $^\circ$ C−1 d−1 at the beginning of the time series to 3.9 mm w.e. $^\circ$
 C−1 d−1 at its end. These fall within the range of ice DDF estimates compiled by Brugger and others (Reference Brugger, Leonard, Refsnider and Dolan2021), though the 3.9 mm w.e. $^\circ$
 C−1 d−1 would be the second-lowest value of those that they found in the literature. In contrast to our findings, Stuefer and others (Reference Stuefer, Rott and Skvarca2007, Fig. 6b) found a very strong linear fit for their degree-day factor (DDF = 8.8 mm w.e. $^\circ$
 C−1 d−1; R 2 = 0.997; T 0 fixed at 0 $^\circ$
 C) without any noticeable residual; this ablation stake was installed in the same region of Glaciar Perito Moreno, and Stuefer and others (Reference Stuefer, Rott and Skvarca2007) used a similar integral approach to compute the melt factor.
A few possibilities emerge for the reason behind this decrease in DDF. First, the temperature and humidity records (Fig. 5) suggest a shift to stormier conditions in March. This could indicate a shift from radiation-dominated to sensible-heat-dominated ablation. Sensible-heat effects produce a smaller melt factor and have been previously noted at Glaciar Perito Moreno (Takeuchi and others, Reference Takeuchi, Naruse and Satow1995; Minowa and others, Reference Minowa, Skvarca and Fujita2023). Second, field photos of our deployment indicate that the measured ice surface sloped toward the equator at first but, as it melted, later sloped toward the pole (Supplementary Fig. 1). This would reduce received solar radiation over time. Third, this change in ice-surface slope might have affected the ultrasonic rangefinder measurements. Finally, we note that our data extend over <200 PDDs whereas the much more linear Stuefer and others (Reference Stuefer, Rott and Skvarca2007) dataset extends across 1400 PDDs. A longer measurement time series could average over the shorter-term variability in whether solar radiation or sensible heat fluxes more strongly drive temperature and ablation (cf. Ohmura, Reference Ohmura2001; Minowa and others, Reference Minowa, Skvarca and Fujita2023).
5. Conclusion
We developed, tested and improved automated ablation stakes over a decade. These automated ablation stakes enable us to generate calibrated ablation models based on frequent and co-located data on relative ice-surface-elevation change and atmospheric drivers of ablation, with the present design suited for temperature-index approaches. Their autonomous data recording and low power requirements enable high temporal resolution, and their low cost and portability facilitate large-scale deployments. Aside from the sensors themselves, the ablation-stake design, hardware and firmware are open source. Table 2 contains our recommended parts list alongside suggestions for future installations.
Through analysis of a test deployment in Patagonia, we evaluate methods for computing temperature-index melt factors. When fitting a linear regression to temperature and ablation rate, parameters f m and T 0 converge as averaging windows exceed ~12 h. The integral approach, made possible by the frequent data, improves goodness of fit while exposing a systematic residual. Future deployments using this automated ablation-stake technology should aid efforts to link ablation to drivers of glacier-surface mass loss.
Supplementary material
The supplementary material for this article can be found at https://doi.org/10.1017/aog.2024.21.
Acknowledgements
Casey Decker, Rachel McLaughlin, Leonardo Punina, Gioachino Roberti, Guillermo Tamburini Beliveau and Daniel Stanton provided major support as participants in deployments. Leif Anderson, Bob Anderson, Robert Chen, Sara Rathburn and Dylan Ward provided advice and/or support. Additional assistance with sensor-system preparation and/or deployment in Ecuador was provided by Hannah Albers, Jabari Jones, Chloe Shaw and Libby Witte. Peter and Sue Wickert hosted a sensor package to measure seasonal snowpack in their backyard. Lida Pimper, Silvina Sturzenbaum and Rocío Blanco of the Administración de Parques Nacionales (APN), Argentina, assisted with permitting and access to Glaciar Perito Moreno. Pedro Skvarca offered counsel on the locations of the ablation stakes. José Pera and the staff of Hielo y Aventura transported us at no cost to the entry to the field area, and Gustavo Hsieh assisted us with housing and logistics through Buenos Aires. Argetnine medical and aviation personnel enabled our exit from Patagonia at the start of the COVID-19 pandemic. The Dirección Nacional del Antártico (DNA), Instituto Antártico Argentino (IAA) and Comando Cojunto Antártico (COCOANTAR) provided deployment logistics at Glaciar Fourcade. The 2020/2021 overwintering team at Base Carlini – particularly Emmanuel Chang, Ignacio Carnevale, Jazmin Fogel and Guido Martinez – helped with installation there. During the first years of this decade-long project, Andrew Wickert received support from the Department of Defense under a National Defense Science and Engineering Graduate Fellowship and the National Science Foundation Graduate Research Fellowship Program under grant No. 1144083. Later, this work was financially supported by start-up funds from the University of Minnesota awarded to Andrew Wickert and Gene-Hua Crystal Ng, through a Postgraduate Research Grant from the British Society for Geomorphology, by Northern Widget LLC, and by the World Meteorological Organization (WMO) HydroHub. Additionally, this material is based upon work supported by the National Science Foundation under grants No. EAR-1123855, EAR-1714614, EAR-1759071 and OPP-1821002. Constructive reviews from Keith Brugger and three anonymous reviewers guided us to improve the manuscript. Associate Chief Editor Tómas Jóhannesson provided context, caught a mistake in a prior draft, inspired us to develop our Discussion section and further reviewed our manuscript.


 Open access

