Introduction
Prior to the discovery of a wide variety of new Na uranyl sulfate minerals at the Blue Lizard mine in Red Canyon, Utah, USA, only one Na uranyl sulfate, natrozippeite, was known to occur in Nature. Since 2013 a further 11 new Na uranyl sulfates have been described from the Blue Lizard mine (Kampf et al., Reference Kampf, Plášil, Kasatkin, Marty and Čejka2017b). To these, we now add the Na uranyl sulfate, feynmanite, which has also been found at the nearby Markey mine.
These minerals crystallise as uranium- and sulfate-containing groundwater evaporates on the mine walls, often in close proximity to uranium ore replacements of organic material (wood and other plant remains), the source of the uranium. The Na uranyl sulfates of Red Canyon are notable for their range in U–S–Na contents and for their topological variety, displaying topologies based on isolated clusters (e.g. klaprothite; Kampf et al., Reference Kampf, Plášil, Kasatkin, Marty and Čejka2017b), chains (e.g. fermiite; Kampf et al., Reference Kampf, Plášil, Kasatkin, Marty and Čejka2015a) and sheets (e.g. plášilite; Kampf et al., Reference Kampf, Kasatkin, Čejka and Marty2015b). Their formation is interesting and complex, and distinct arrangements are observed, even for minerals with nominally identical U–S–Na contents (although generally different amounts of OH and/or H2O). Our studies of the unique topological arrangements of Na uranyl sulfates continues, as numerous additional new minerals from Red Canyon await final characterization.
Feynmanite (/'fain mən ait/) is named for American physicist Richard Feynman (1918–1988), one of the most important physicists of the 20th Century. Although well-known for his contributions to the Manhattan Project (hence the connection to uranium), it was his work on quantum electrodynamics that earned him the Nobel Prize in Physics in 1965.
The new mineral and name were approved by the International Mineralogical Association Commission on New Minerals, Nomenclature and Classification (IMA2017-035, Kampf, Reference Kampf, Olds, Plášil, Marty and Perry2017a). The description is based on four cotype specimens deposited in the collections of the Natural History Museum of Los Angeles County, 900 Exposition Boulevard, Los Angeles, CA 90007, USA, catalogue numbers 66590 and 66591 (Blue Lizard mine) and 66592 and 66593 (Markey mine).
Occurrence
Feynmanite was found underground in both the Blue Lizard mine (37°33′26″N, 110°17′44″W) and the Markey mine (37°32′57″N, 110°18′08″W), Red Canyon, White Canyon District, San Juan County, Utah, USA. The Markey mine is located ~1 km southwest of the Blue Lizard mine. The Blue Lizard mine is on the west-facing side of Red Canyon and the Markey mine is on the east-facing side. Both are ~72 km west of the town of Blanding, Utah, and ~22 km southeast of Good Hope Bay on Lake Powell. The geology of the Blue Lizard and Markey mines is quite similar (Chenoweth, Reference Chenoweth1993; Kampf, et al., Reference Kampf, Plášil, Kasatkin, Marty and Čejka2015a), although the mineralogy of the Markey mine is notably richer in carbonate phases. The following information on the mines and their geology is taken largely from Chenoweth (Reference Chenoweth1993).
The deposit exploited by the Blue Lizard mine was first recognised in the summer of 1898 by John Wetherill while leading an archaeological expedition into Red Canyon. He noted yellow stains around a petrified tree. At that spot, he built a rock monument, in which he placed a piece of paper to claim the minerals. Although he never officially recorded his claim, 45 years later, in 1943, he described the spot to Preston V. Redd of Blanding, Utah, who went to the site, found Wetherill's monument and claimed the area as the Blue Lizzard claim (note alternate spelling). Underground workings to mine uranium were not developed until 1951, the highest production occurred in the late 1950s and the mine last produced ore in 1970.
The Markey group of claims, was staked in 1949 by Jim Rigg of Grand Junction, Colorado, and was purchased from Rigg and others by the Anaconda Copper Mining Company on June 1, 1951. After limited exploration and production, the mine closed in 1955. The mine was subsequently acquired from Anaconda by Calvin Black of Blanding, Utah, under whose ownership the mine operated from 1960 to 1982 and was a leading producer in the district for nearly that entire period.
The uranium deposits in Red Canyon occur within the Shinarump member of the Upper Triassic Chinle Formation, in channels incised into the reddish-brown siltstones of the underlying Lower Triassic Moenkopi Formation. The Shinarump member consists of medium- to coarse-grained sandstone, conglomeratic sandstone beds and thick siltstone lenses. Accumulations of wood and other plant material in the channels provided reducing environments that caused the deposition of the ore minerals, which are found as replacements of the organic material (typically manifesting as asphaltum) and as disseminations in the enclosing sandstone. Since the mines closed, oxidation of primary ores in the humid underground environment has produced a variety of secondary minerals as efflorescent crusts on the surfaces of mine walls.
Feynmanite is a rare mineral in the secondary mineral assemblages at both mines, where it occurs on pyrite-rich asphaltum matrix. At the Blue Lizard mine, it occurs with chinleite-(Y), gypsum, goethite, natrojarosite, natrozippeite, plášilite and shumwayite. At the Markey mine, it occurs with chinleite-(Y), gypsum, natrojarosite, natrozippeite, plášilite and wetherillite. Feynmanite crystals are very prone to dehydration, generally yielding fine-grained plášilite; well-formed plášilite crystals are not found in association with feynmanite. Numerous other secondary minerals have been found at both mines (cf. Kampf et al., Reference Kampf, Plášil, Kasatkin, Marty and Čejka2017b and Kampf et al., Reference Kampf, Plášil, Kasatkin, Marty and Čejka2018).
Considering that feynmanite has thus far been found only on asphaltum at both the Blue Lizard and Markey mines, the possible role of the asphaltum in the formation/stability of feynmanite is worth commenting on. The asphaltum certainly provides a reducing environment; however, this does not seem to be a factor. Similarly, high U content, often present in the asphaltum, does not in itself explain why feynmanite is found on asphaltum rather than quartz-rich matrix because phases with similar Na:U:S ratios (e.g. plášilite) are found on quartz matrix. It seems that the most likely factor is the capacity of the asphaltum to retain moisture and, thereby, provide a more hospitable and stable substrate for the feynmanite crystals.
Physical and optical properties
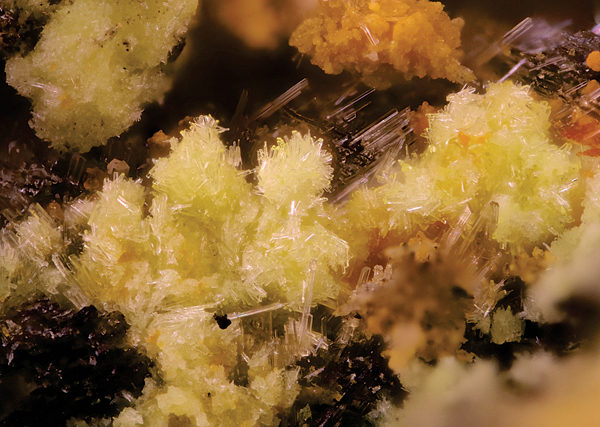
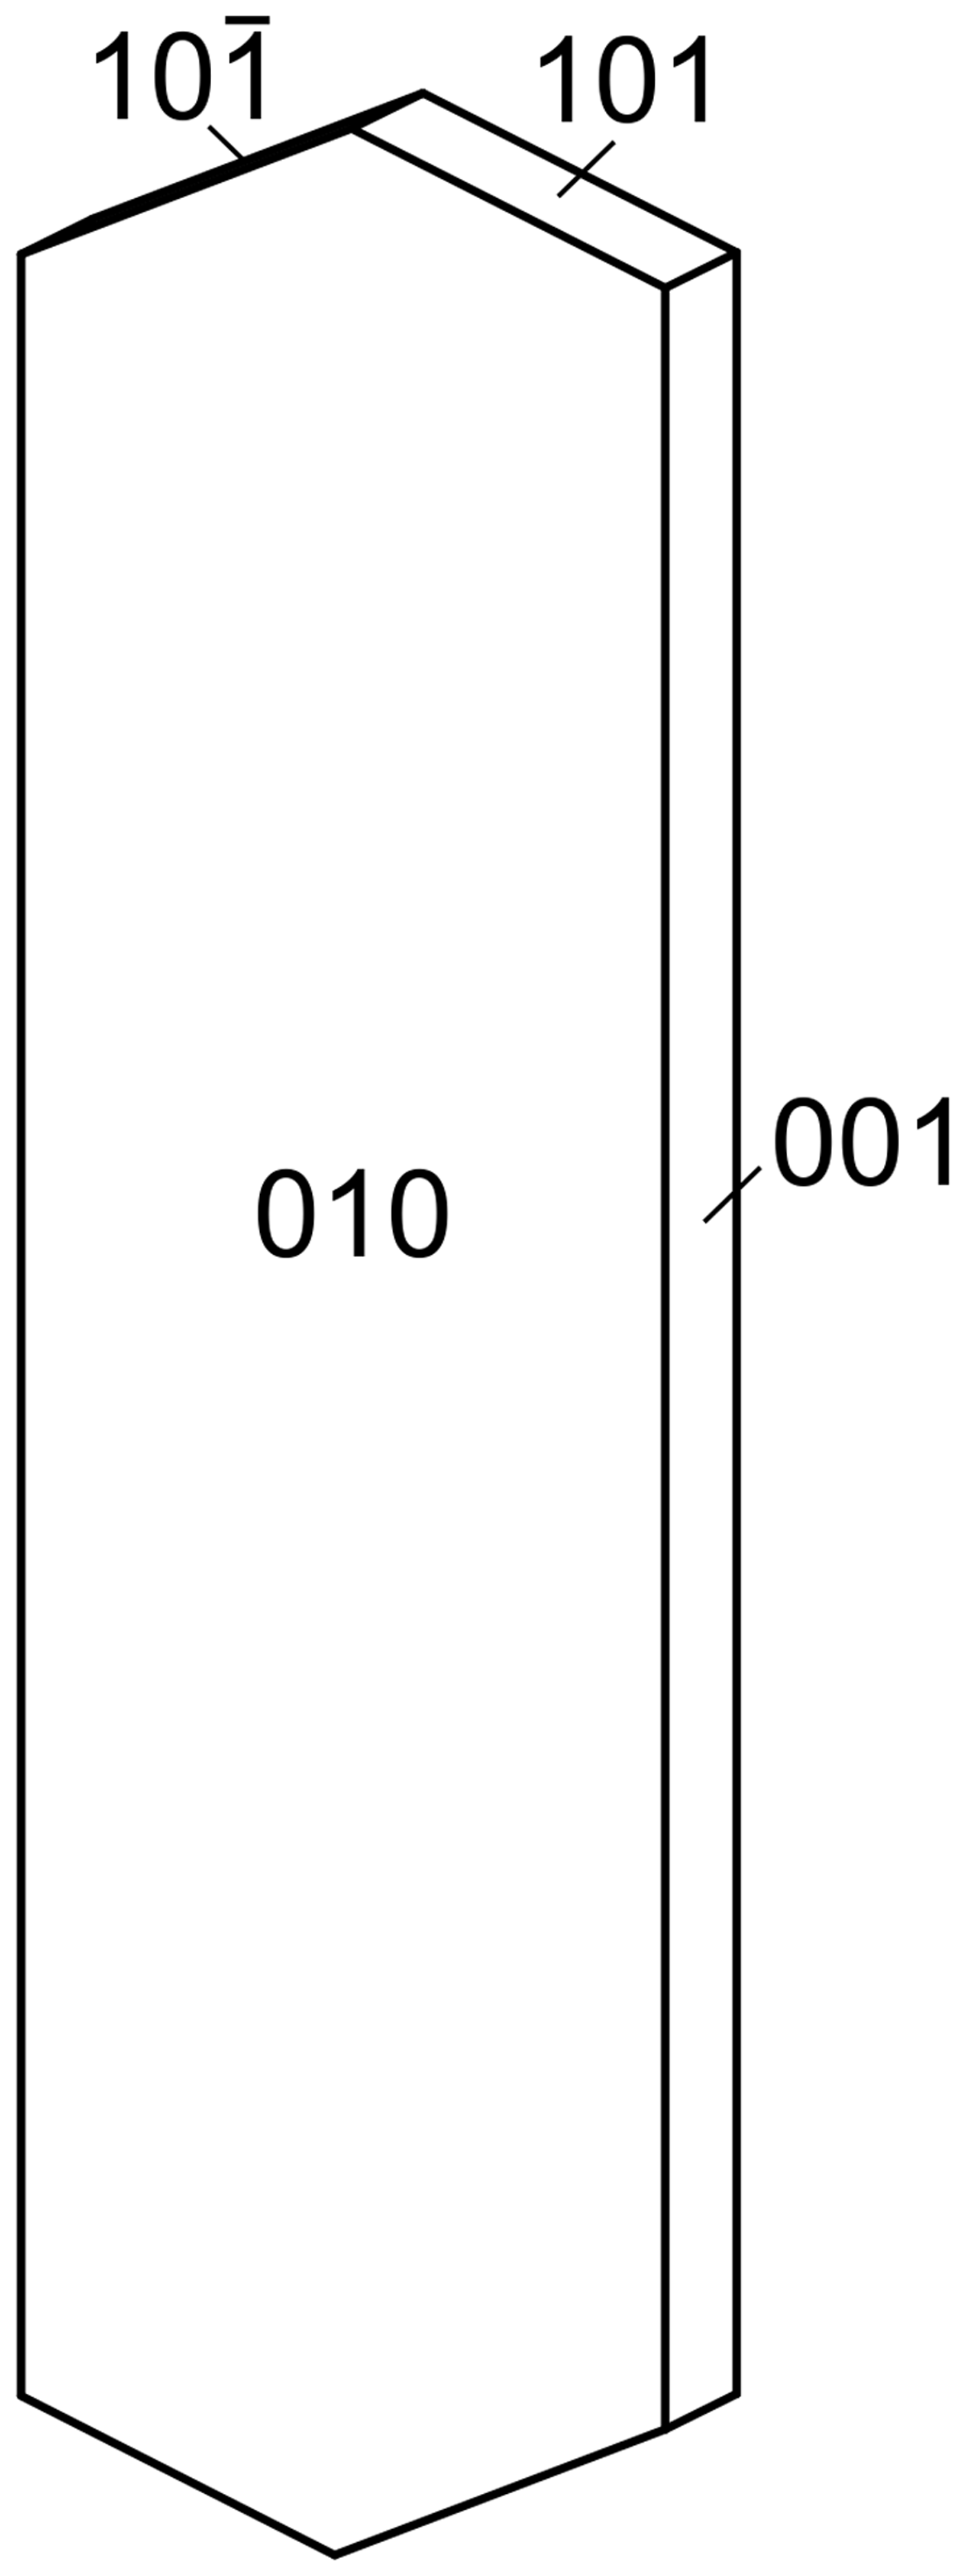
Feynmanite crystals are thin needles or blades, up to ~0.1 mm long, growing in random ‘jackstraw’ aggregates (Fig. 1). Blades are flattened on {010} and elongate on [100]; they exhibit the forms {010}, {001}, {101} and {10 $\bar{1}$} (Fig. 2). No twinning was observed.
Clusters of greenish-yellow feynmanite blades with colourless gypsum and dull orange natrojarosite on asphaltum from the Markey mine; the horizontal field of view is 2 mm; Natural History Museum of Los Angeles County, catalogue number 66593.

Crystal drawing of feynmanite with clinographic projection in nonstandard orientation and [100] vertical.

The mineral is pale greenish yellow with a white streak and fluoresces bright greenish white under a 405 nm laser. Crystals are transparent and have vitreous lustre. The tenacity is brittle, the Mohs hardness is ~2, the fracture is irregular and there is one perfect cleavage parallel to {010}. The density could not be measured because the tiny crystals are too difficult to see in density liquids, such as methylene iodide. The calculated density is 3.324 g cm–3 for the empirical formula and 3.321 g cm–3 for the ideal formula. At room temperature, the mineral dissolves very slowly in H2O (minutes) and dissolves immediately in dilute HCl.
Optically, feynmanite is biaxial (–), with α = 1.534(2), β = 1.561(2) and γ = 1.571(2) (measured in white light). The 2V measured directly on a spindle-stage is 62(2)°; the calculated 2V is 61.7°. Dispersion is imperceptible. The mineral is weakly pleochroic: X = colourless, Y = very pale green yellow, Z = pale green yellow; and X < Y < Z. The optical orientation is X = b, Y ≈ a and Z ≈ c.
Raman spectroscopy
The Raman spectrum of feynmanite from the Markey mine was recorded using a Bruker Instruments Sentinel-785 laser head mounted on a Nikon Optiphot-2 microscope with Peltier-cooled CCD detector and integrated 785 nm diode laser, operated at 200 mW, with a spot size of 100 µm and ~5 cm–1 resolution (Fig. 3). The spectrum was acquired using a 10× objective, from 1500 to 80 cm–1 using five 3 s exposures, with five repeated acquisitions to improve the signal-to-noise ratio. The spectrometer was calibrated with Bruker software-controlled procedures (Opus software) using neon emission lines (wavelength calibration), and Tylenol® bands (frequency calibration). A background correction was applied using the Opus software.
The Raman spectrum of feynmanite recorded with a 785 nm laser.

The split triply degenerate ν3(SO4)2– antisymmetric stretching vibrations occur as weak bands at 1219 and 1189 cm–1, and several medium-strong bands at 1075, 1042 and 1006 cm–1 are assignable to the ν1(SO4)2– symmetric stretching vibrations. The ν1(UO2)2+ symmetric stretching vibration is present as a very strong band at 846 cm–1. A very weak band at 911 cm–1 is assigned to the ν3(UO2)2+ antisymmetric stretch. Bartlett and Cooney (Reference Bartlett and Cooney1989) provide an empirical relationship to derive the approximate U–Oyl bond lengths from the band positions assigned to the (UO2)2+ stretching vibrations, which give 1.76 Å (ν1) and 1.77 Å (ν3), in accordance with U–Oyl bond lengths from the X-ray data (1.75 Å and 1.76 Å).
Weak bands found at 658 and 612 cm–1 are attributed to the split, triply degenerate ν4(δ)(SO4)2– bending vibrations, and those at 484 and 454 cm–1 to the split doubly degenerate ν2(δ)(SO4)2– bending vibrations. A weak band at 358 cm–1 is either due to ν (U–Oequatorial) stretching vibrations or Na–O stretches (e.g. Volkovich et al., Reference Volkovich, Griffiths, Fray and Fields1998; Plášil et al., Reference Plášil, Buixaderas, Čejka, Sejkora, Jehlička and Novák2010; Kampf et al., 2015a,b). Bands at 249, 219, 194 and 176 cm–1 arise from ν2(δ)U–O–U bending modes. Remaining bands <150 cm–1 are assigned to external lattice vibration modes.
Infrared spectroscopy
An attenuated total reflectance (ATR) Fourier transform infrared (FTIR) spectrum of feynmanite from the Markey mine was obtained using a SENSIR Technologies IlluminatIR with a liquid N2 cooled MCT detector mounted to an Olympus BX51 microscope. An ATR objective (ZnSe/diamond) was pressed into crystals of feynmanite and the spectrum was measured from 4000 to 650 cm–1 (Fig. 4).
The infrared spectrum (ATR) of feynmanite.

Stretching vibrations ν(OH) occur between 2800 and 3600 cm–1, with maxima at 3381 and 3517 cm–1, and a shoulder around 3220 cm–1. Approximate O–H···O hydrogen bond-lengths calculated from the observed stretching frequencies lie within the range ~2.9 to 2.6 Å using the correlation function given by Libowitzky (Reference Libowitzky1999). Several broad, low intensity bands between 2345–2070 cm–1 correspond to combination bands (δ H2O and L H2O). Medium-strong bands found at 1639 and 1628 cm–1 are assigned as the ν2-(δ)-bending vibrations of structurally unique H2O groups.
Absorption bands at 1190, 1116 and 1048 cm–1 are assigned to the split triply degenerate ν3(SO4)2– antisymmetric stretching vibration. A shouldering band centred at 1011 cm–1 is probably attributed to the IR-active ν1(SO4)2– symmetric stretch.
The strong antisymmetric stretch ν3(UO2)2+ occurs at 909 cm–1. No evidence is found for the presence of the symmetric ν1(UO2)2+ stretch. The uranyl cation bond length inferred from the IR spectrum of feynmanite using the empirical relation given by Bartlett and Cooney (Reference Bartlett and Cooney1989) is 1.77 Å, and agrees well with the structure.
A strong band at 818 cm–1 is assigned as the δ U–OH (out-of-plane bending) mode. The ν4(SO4)2– mode may coincide with either γ U–OH (out-of-plane bending) or librations of H2O groups for the weak band at 669 cm–1. According to Čejka (Reference Čejka, Burns and Finch1999) the presence of δ U–OH between 800–900 cm–1, γ U–OH from 600–700 cm–1 and fine bands at ~3500 cm–1 are characteristic to OH groups bridging two uranyl cations.
Composition
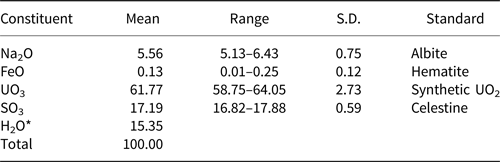
Chemical analyses (3) were performed using a Cameca SX-50 electron microprobe (wavelength dispersive spectroscopy mode) operating at an accelerating voltage of 15 kV, with a beam current of 10 nA and 25 µm spot diameter. Feynmanite from the Markey mine contains appreciable U, S and Na, with minor Fe. No other elements were detected. Matrix effects were accounted for using the PAP correction routine (Pouchou and Pichoir, Reference Pouchou, Pichoir and Armstrong1985). Volatilisation of Na was corrected for by zero-time correction. Due to the limited amount of material available, the H2O content was not measured and is instead calculated by stoichiometry with respect to the structure. The empirical formula is calculated on the basis of 10.5 O atoms per formula unit (apfu). Analytical data are given in Table 1.
Chemical composition for feynmanite.

* based on the structure; S.D. – standard deviation.
The empirical formula (calculated on the basis of 10.5 O apfu) is (Na0.84Fe0.01)(U1.01O2)(S1.01O4)(OH)·3.5H2O. The ideal formula is Na(UO2)(SO4)(OH)·3.5H2O, which requires Na2O 6.61, UO3 60.97, SO3 17.07, H2O 15.36, total 100 wt.%. The Gladstone-Dale compatibility index 1 – (K P/K C) for the empirical formula is –0.003, in the superior range (Mandarino, Reference Mandarino2007), using k(UO3) = 0.118, as provided by Mandarino (Reference Mandarino1976).
X-ray crystallography and structure refinement
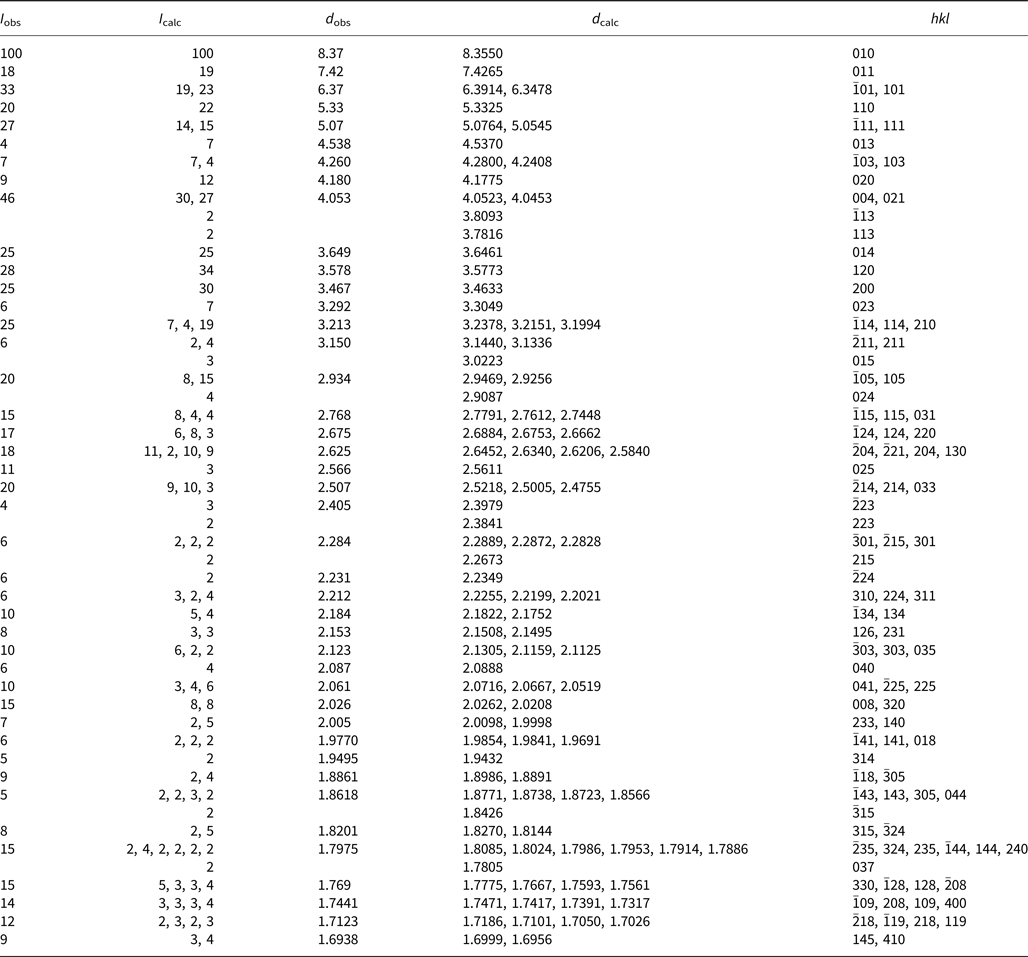
Powder X-ray diffraction studies were conducted on feynmanite from the Blue Lizard mine using a Rigaku R-Axis Rapid II curved imaging plate microdiffractometer, with monochromatised MoKα radiation (λ = 0.71075 Å). A cluster of crystals was used to obtain the powder diffraction pattern, employing a Gandolfi-like motion on the ϕ and ω axes to randomise the sample. Observed d values and intensities were derived by profile fitting using JADE 2010 software (Materials Data, Inc.). The powder data presented in Table 2 show good agreement with the pattern calculated from the structure determination. Unit-cell parameters refined from the powder data using JADE 2010 with whole-pattern fitting are: a = 6.934(3), b = 8.367(3), c = 16.239(3) Å, β = 90.494(12)° and V = 942.1(6) Å3. Note that grinding feynmanite crystals into a powder will promote its dehydration and is likely to yield a pattern more closely matching plášilite.
Powder X-ray data (d in Å) for feynmanite. Only calculated lines with I ≥ 2 are listed.

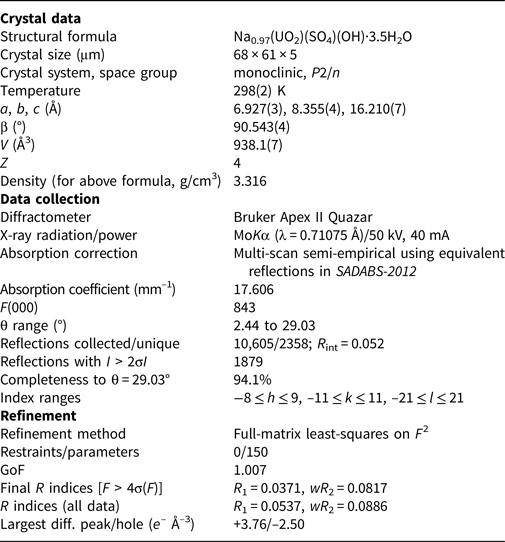
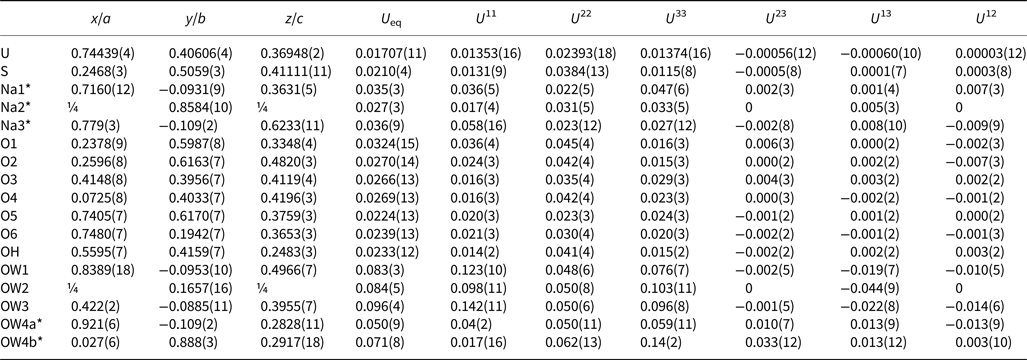
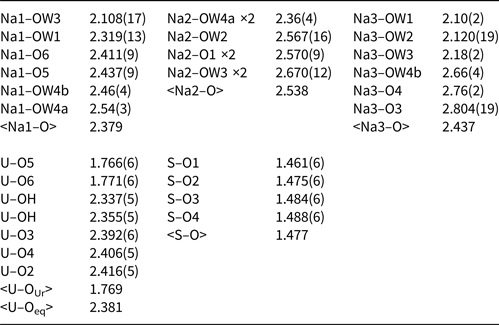
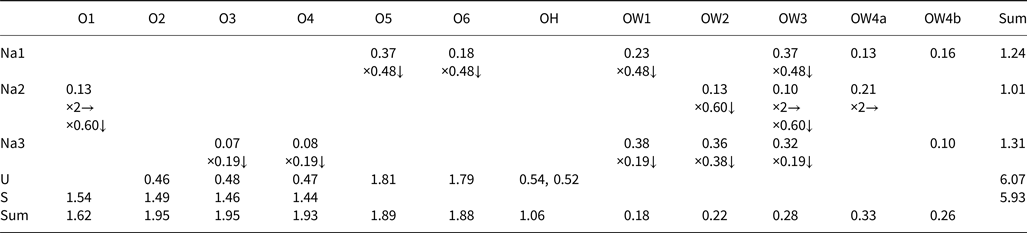
Single-crystal data were collected on a crystal from the Markey mine using MoKα X-rays from a microfocus source and an Apex II CCD-based detector mounted to a Bruker Apex II Quazar three-circle diffractometer. Reflections were integrated and corrected for Lorentz, polarisation and background effects using the Bruker program SAINT. A multi-scan semi-empirical absorption correction was applied using equivalent reflections in SADABS-2012. An initial structure model was obtained by the charge-flipping method using SHELXT (Sheldrick, Reference Sheldrick2015a) in the space group P2/n. Refinement proceeded by full-matrix least-squares on F 2 using SHELXL-2016 (Sheldrick, Reference Sheldrick2015b). The structure solution located the U, S and seven O sites in the uranyl sulfate sheet (see below), as well as five sites between the sheets, initially identified as O sites. Based upon bonding geometry, two of the five interlayer sites were assigned as partially occupied Na atoms. A difference-Fourier synthesis located an additional partially occupied Na site and a split O site. All sites were successfully refined with anisotropic displacement parameters. A subsequent difference-Fourier synthesis failed to locate any likely H atom sites. The two highest electron density residuals, 3.76 and 3.67 e – A–3, were located within 1 Å of the U site. The next highest residual, 2.67 e – A–3, is located in the interlayer region 1.09 Å from Na1 and probably is related to the disorder; however, modelling it as an additional partially occupied site did not seem warranted. No other residuals >1.2 e– A–3 are located in the interlayer region. Data collection and refinement details are given in Table 3, atom coordinates and displacement parameters in Table 4, selected bond distances in Table 5 and a bond-valence analysis in Table 6. The crystallographic information files have been deposited with the Principal Editor of Mineralogical Magazine and are available as Supplementary material (see below).
Data collection and structure refinement details for feynmanite.*

*R int = Σ|F o2–F o2(mean)|/Σ[F o2]. GoF = S = {Σ[w(F o2–F c2)2]/(n–p)}1/2. R 1 = Σ||F o|–|F c||/Σ|F o|. wR 2 = {Σ[w(F o2–F c2)2]/Σ[w(F o2)2]}1/2; w = 1/[σ2(F o2)+(aP)2+bP] where a is 0.0537, b is 0 and P is [2F c2+Max(F o2,0)]/3.
Atom coordinates and displacement parameters (Å2) for feynmanite.

*Occupancies: Na1: 0.48(2); Na2: 0.60(2); Na3: 0.19(2); and OW4a/b: 0.52/0.48(7).
Selected bond distances (Å) for feynmanite.*

* Note that very short distances between Na sites and partially occupied OW4 sites are not included. Also, note the rather short Na1–OW3, Na2–OW1, Na2–OW2 and Na2–OW3 listed; this may be an artefact of the disorder in the interlayer region, considering that the OW1, OW2 and OW3 sites have high displacement parameters.
Bond-valence analysis for feynmanite. Values are expressed in valence units.*

*Multiplicity is indicated by ×↓→. The bond strength contributions from Na atoms to O atoms are factored by the occupancies of the Na sites, except for those to the partially occupied OW4a and OW4b sites. All bond-valence parameters are from Gagné and Hawthorne (Reference Gagné and Hawthorne2015). Hydrogen bonds are not included. Note that the low bond-valence sum for O1 may be compensated by a hydrogen bond from OH (OH···OW1 = 2.89 Å) or O1 may possess some OH character.
Description and discussion of the structure
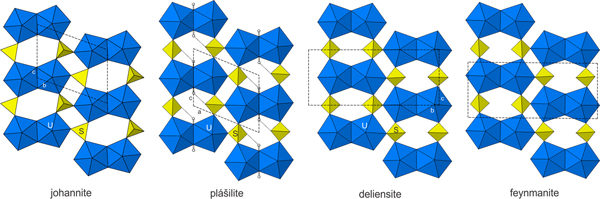
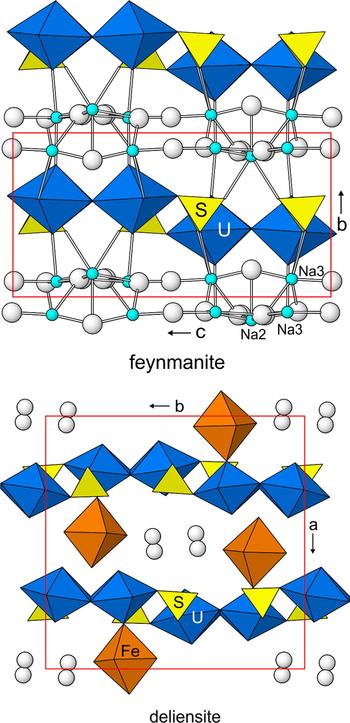
The U site in the structure of feynmanite is surrounded by seven O atom sites forming a squat pentagonal bipyramid, which is a typical coordination for U6+ with the two short apical bonds of the bipyramid constituting the uranyl group. In the structure, pairs of pentagonal bipyramids share a common edge, forming dimers. The dimers are linked by sharing corners with SO4 groups, yielding a [(UO2)2(SO4)2(OH)2]2– sheet parallel to {010} (Fig. 5). Between the sheets are three fully occupied O sites and one split O site, all corresponding to H2O groups. Also in the interlayer region are three partially occupied Na sites with a total occupancy corresponding to 0.97 apfu. Each Na site links to two O sites in the sheets; Na1 links to O sites in different sheets, while the Na2 and Na3 sites link to O sites in the same sheet. The Na1 and Na3 sites also each link to four interlayer O (H2O) sites and the Na2 site also links to five interlayer O (H2O) sites. The bonds between Na and O sites serve to link the sheets in the [010] direction (Fig. 6). Because of the complexity of the bonding in the interlayer region, the hydrogen bonding was not comprehensively analysed. The ideal structural formula is Na(UO2)(SO4)(OH)·3.5H2O.
Sheets in the structures of johannite, plášilite, deliensite and feynmanite. The unit cells are shown by dashed lines. For plášilite, H atoms are shown as white spheres and O–H bonds are shown as sticks. H atom positions were not determined in the other structures.

The [(UO2)2(SO4)2(OH)2]2– sheet is based on the phosphuranylite anion topology (Burns, Reference Burns2005), with a ring symbol 61524232 (Krivovichev and Burns, Reference Krivovichev, Burns, Krivovichev, Burns and Tananaev2007). The sheets in johannite, Cu[(UO2)2(OH)2(SO4)2]·8H2O (Mereiter, Reference Mereiter1982), deliensite, Fe(UO2)2(SO4)2(OH)2·7H2O (Plášil et al., Reference Plášil, Hauser, Petříček, Meisser, Mills, Škoda, Fejfarová, Čejka, Sejkora, Hloušek, Johannet, Machovič and Lapčák2012) and plášilite, Na(UO2)(SO4)(OH)·2H2O (Kampf et al., Reference Kampf, Kasatkin, Čejka and Marty2015b), are topologically identical to that in feynmanite. The sheets in johannite and plášilite are geometrical isomers, differing in the orientation of the SO4 groups, while that in deliensite is the same geometrical isomer as in feynmanite (Fig. 5).
The formulas of feynmanite and plášilite differ only in their numbers of H2O groups i.e. 3.5 H2O pfu for feynmanite and 2 H2O pfu for plášilite. Interestingly, the powder X-ray diffraction patterns of partially dehydrated feynmanite crystals exhibit lines apparently corresponding to both feynmanite and plášilite. It might be conjectured that the loss of H2O from the interlayer region in the feynmanite structure results in reconfiguration into the plášilite structure; however, this would necessitate a reconfiguration of some of the SO4 groups in the uranyl-sulfate sheet, which seems unlikely. Perhaps, a more likely possibility is that the dehydration of feynmanite results in another phase that is very similar to plášilite structurally, but contains a [(UO2)2(SO4)2(OH)2]2– sheet identical to that in feynmanite.
Finally, it should be noted that the structures of feynmanite and deliensite (Fig. 6), while they are based upon identical [(UO2)2(SO4)2(OH)2]2– sheets (except for minor geometrical differences), have very different interlayer regions and, consequently, very different linkages between their sheets. The periodicity orthogonal to the sheets in the deliensite structure is double that in the feynmanite structure due to the relative lateral shifting between sheets in deliensite. Notably, in the deliensite structure, there are no O–cation–O linkages between the sheets, as the interlayer FeO6 octahedra link only to one uranyl-sulfate sheet. Therefore, the sheets in deliensite are linked only by hydrogen bonding, while those in feynmanite are linked by a combination of O–Na1–O and hydrogen bonds.
The crystal structure of feynmanite compared with that of deliensite. The unit-cell outlines are in red. The O atoms of H2O groups are shown as white spheres. Na–O bonds are drawn as sticks.

Acknowledgements
Reviewer Fernando Cámara, Structures Editor Peter Leverett and Editorial Board Member Mark Welch are thanked for their constructive comments on the manuscript. A portion of this study was funded by the John Jago Trelawney Endowment to the Mineral Sciences Department of the Natural History Museum of Los Angeles County.
Supplementary material
To view supplementary material for this article, please visit https://doi.org/10.1180/mgm.2018.117