





Introduction
As the setting of an increasing proportion of acute care visits and non-elective hospital admissions, the emergency department (ED) has been identified as a key location for viral surveillance. Reference Hughes, Edeghere, O’Brien, Vivancos and Elliot1 However, clinical viral testing is limited to symptomatic patients, leaving asymptomatic/presymptomatic patients, healthcare workers, and visitors out of the screening pool. As high volumes of patients and visitors often sit in ED waiting rooms for prolonged times in close proximity, evaluating the presence of airborne circulating respiratory viruses in ED waiting rooms could supplement surveillance of clinical respiratory viral testing. Reference Rothman, Irvin and Moran2 Further, novel and emerging pathogens (e.g., measles and avian influenza) can be detected in air samples when diagnostic assays are not available or clinical testing is limited.
The aim of this study is to evaluate the association between the detection of respiratory pathogen genetic material by sampling the air in an ED waiting room and the number of confirmed clinical cases of COVID-19, influenza A, and respiratory syncytial virus (RSV).
Methods
We deployed a Thermo Fisher AerosolSense air sampler in the main ED waiting room at a Midwest quaternary care center. The Thermo Fisher AerosolSense air sampler is a portable device that uses impaction to collect particles from incoming air onto foam substrates enclosed in a cartridge which are then processed with molecular assays, including reverse transcription quantitative polymerase chain reaction (RT-qPCR). This ED serves an average of ∼190 patients daily and has 58 beds including a separate pediatric ED with 10 pediatric rooms and a pediatric waiting room connected to the main waiting room by a door. The median number of patients in the ED waiting rooms per hour of the day ranged from 4 to 33 during the study period, and the median (IQR) wait time was 16 (5–45) minutes. Hospital policy requires masking within the ED including waiting rooms.
The air sampler was placed in the main ED waiting area which is ∼1,100 sq ft, and patients could be 8–45 ft from the air sampler. The air sampler ran continuously October 24, 2024—September 8, 2025, and cartridges were removed and replaced approximately every 2–3 days, for a total of 129 air sampling time periods across the study (Supplemental Table 1). The cartridges were processed using Cepheid GeneXpert® Xpress assays for COVID-19, influenza A1, and RSV which utilize RT-qPCR and produce a semi-quantitative cycle threshold (Ct) value (number of amplification cycles). Reference Dutta, Naiyer and Mansuri3,4 Samples with no nucleic acid detected after 45 cycles were recorded as negative with no Ct value. A sample processing control was performed for each cartridge to ensure adequate sample and conditions for testing.
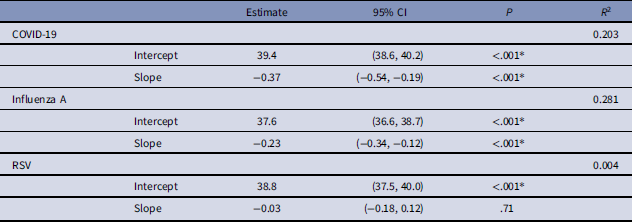
Linear regression to predict Ct value by number of clinical cases

Table 1. Long description
The table presents data on the estimates, 95% confidence intervals (CI), p-values, and R-squared values for COVID-19, Influenza A, and RSV. It has four rows and four columns. The columns are labeled Estimate, 95% CI, P, and R2. The rows are labeled COVID-19, Influenza A, and RSV, with each having an Intercept and Slope. For COVID-19, the Intercept estimate is 39.4 with a 95% CI of (38.6, 40.2) and a p-value of <.001. The Slope estimate is -0.37 with a 95% CI of (-0.54, -0.19) and a p-value of <.001. The R-squared value is 0.203. For Influenza A, the Intercept estimate is 37.6 with a 95% CI of (36.6, 38.7) and a p-value of <.001. The Slope estimate is -0.23 with a 95% CI of (-0.34, -0.12) and a p-value of <.001. The R-squared value is 0.281. For RSV, the Intercept estimate is 38.8 with a 95% CI of (37.5, 40.0) and a p-value of <.001. The Slope estimate is -0.03 with a 95% CI of (-0.18, 0.12) and a p-value of .71. The R-squared value is 0.004.
* P < 0.05, Slope Units: Amplification cycles/clinical case.
We utilized an existing electronic health record surveillance data set that included ED patients diagnosed with ARTIs, as identified by ICD-10 (International Classification of Diseases, 10th Revision) diagnosis codes (Supplemental Table 2), and their clinical respiratory viral testing results. We then recorded the number of laboratory-confirmed COVID-19, influenza A, and RSV positive cases for each period.
We defined air sample positivity as a Ct value < 40. Reference Ramuta, Newman and Brakefield5 For each pathogen, we categorized the individual time periods by air sampling qualitative result (positive/negative) and calculated the median and interquartile range (IQR) of clinical positive tests within the positive/negative air sample groups. We used Wilcoxon rank sum tests to assess the difference in the distributions and median number of ED clinical cases by air sample positivity with a significance level of 0.05.
Additionally, we created simple linear regression models for each pathogen to evaluate the relationship between Ct values (outcome) and the number of ED clinical cases (predictor). We used t-tests to assess the significance of the intercept, the mean Ct value when there are zero clinical cases, and slope, the average change in the amplification cycles per additional clinical case, coefficients and reported the R 2 for each model, the percentage of variance explained by the model.
Sensitivity analyses excluding pediatric ED clinical cases and using a Ct cutoff of 45 to define air sample positivity are included in the supplemental material.
Results
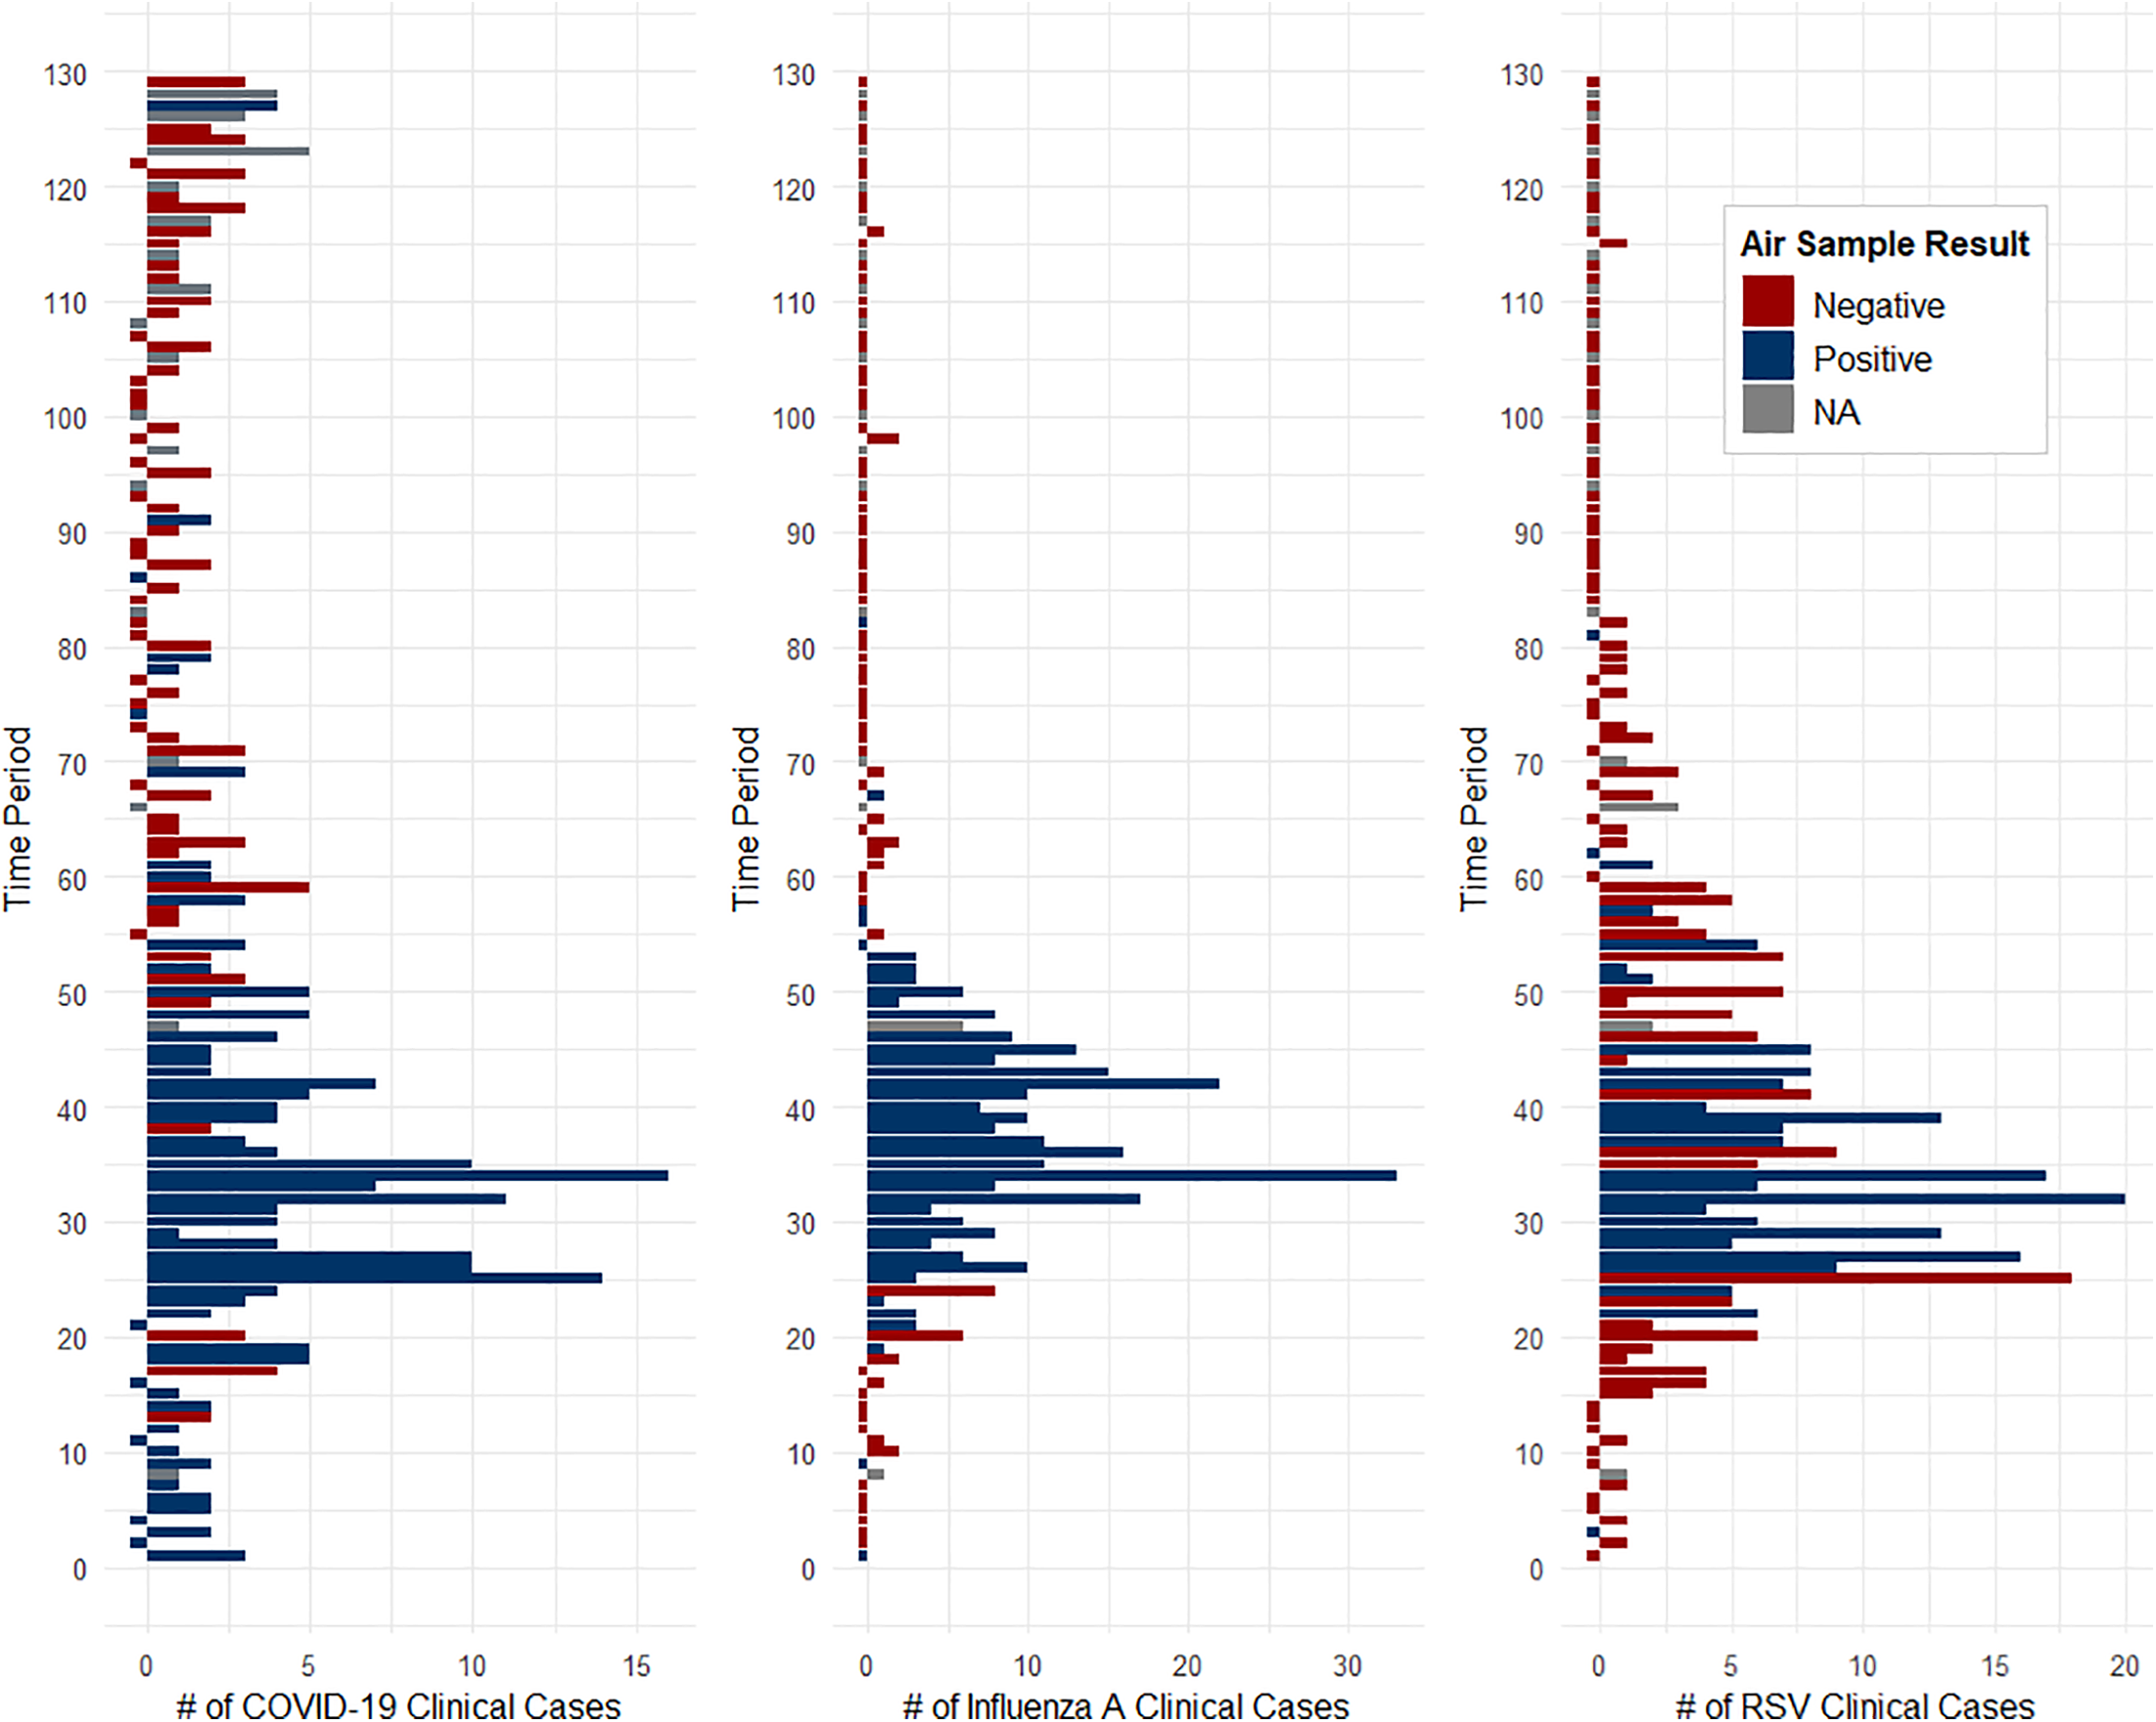
During the study period, we identified 295 clinical COVID-19 cases, 310 clinical influenza A cases, and 311 clinical RSV cases. The number of cases by period and the corresponding air sampling result are displayed for each pathogen in Figure 1. One period was excluded based on the sample processing control, and Cepheid GeneXpert® Xpress assays were not performed in 16 time periods. COVID-19 was positive in 55/112 (49.1%) periods, influenza A was positive in 39/112 (34.8%) periods, and RSV was positive in 26/112 (23.2%) periods. The median [IQR] number of clinical cases by positive vs negative air sampling period for COVID-19 (3 [2, 4] vs 1 [0, 2] cases), influenza (6 [2.5, 10] vs 0 [0, 0] cases), and RSV (6 [2.5, 8] vs 0 [0, 1.75] cases) were all significantly different (P < .001).
Number of COVID-19, influenza A, and respiratory syncytial virus (RSV) cases for time periods (1–129) from October 24, 2024 to September 8, 2025, and air sample positivity defined using Ct < 40 (positive: blue, negative: red, N/A [not tested or no result]: gray). All time periods were 2–3 days except for time periods (1,22,25,32,34,87,103,127) that were 4–5 days. Bar for <0 cases used to indicate air sampling result for time periods with 0 clinical cases.

Only time periods with a Ct value were included in the models. The intercept was significant in each of the models (Table 1). The number of clinical cases of COVID-19 and influenza A were significant linear predictors of air sample Ct value and explained 20.3% and 28.1% of the variance in Ct values, respectively, meaning that 80%–70% of the variance was due to unaccounted for factors (e.g., distance from air sampler).
Discussion
We found the detection of respiratory viruses (COVID-19, influenza A, RSV) in air samples collected by the Thermo Fisher AerosolSense in an ED waiting room was associated with higher median numbers of clinical cases. The number of clinical COVID-19 and influenza A cases was also found to be inversely related to Ct values. Previous studies have found that air sample detection in community settings mirror that of individual clinical testing, consistent with our results. Reference Ramuta, Newman and Brakefield5–Reference Raymenants, Geenen and Budts7 A few studies have investigated air sampling surveillance in healthcare settings, including a recent study which reported that ED air samples had four times higher odds of being positive than ICU samples, establishing the ED as a high risk area for nosocomial transmission. Reference MacIntyre, Notaras and Bari8,Reference Eren, Vatansever and Kabadayı9
The ED monitored in this study primarily utilizes COVID-19/influenza/RSV panels during typical respiratory viral season months and uses single COVID-19 testing the rest of the year. Air sampling surveillance could guide ED clinicians on when to make the seasonal shift to COVID-19/influenza/RSV panels and guide the use of significantly more expensive expanded panels that include less common or emerging pathogens. Therefore, air sampling surveillance could be a valuable tool for diagnostic stewardship, selecting the right test for the right patient at the right time. Reference Zakhour, Haddad and Kerbage10
This study had several limitations. First, influenza A and RSV were not routinely tested for in the spring/summer, and our study encompassed a single respiratory viral season. The variability in period length and the location of the air sampler within the ED waiting room also could have influenced our results. Finally, this study analyzed the results for one assay, the Cepheid GeneXpert® Xpress.
Future research should investigate the optimal implementation of air sampling into clinical operations such as reducing turnaround time through the use of point-of-care viral assays for air samples, developing strategies for communicating air sampling results with clinicians, and measuring changes in clinical respiratory viral testing (e.g., number of tests, testing type, positivity rate including rare pathogens such as measles virus) pre/post-implementation of air sampling surveillance.
Supplementary material
The supplementary material for this article can be found at https://doi.org/10.1017/ice.2026.10538.
Acknowledgements
Thank you to the DHO and SLO lab undergraduate students for collecting air cartridges from the ED.
Financial support
This project was supported by Inkfish, LLC and by an option to Dave and Shelby O’Connor at UW-Madison as part of NIH/NIAID 75N93021C00045 to the Johns Hopkins Center of Excellence for Influenza Research and Response.
Competing interests
MG, HI, JG, AE, AM, DS, and MP declare no conflicts of interest.
Use of AI
Claude Opus models (predominantly Opus 4.7) were used to simulate manuscript peer review as described in https://github.com/dhoconno/revisaurus. In addition to identifying weaknesses and making suggestions for amplifying key messages, Opus agents were used to refine and improve text from the perspective of different simulated readers, including suggesting text edits that were manually accepted, rejected, or edited.


 Open access

