Implications
There seems to be some heterogeneity in growth and differentiation of muscle satellite cells (SCs) isolated from low-, medium- and high-weight pig litter mates. The ability of SC to divide and differentiate into muscle fibres seems to be dependent on the host from which they were collected. It could be that the SCs have adapted their behaviour to the environment in which they developed, meaning that the SCs are programmed during either foetal or early postnatal life. When and how this possible programming is taking place and whether it is possible to manipulate it could be the basis for further research.
Introduction
Within litters of pigs, there is a large variation in birth weight and postnatal growth rate. Several studies have shown a positive correlation between birth or weaning weight and postnatal growth rate, showing that the postnatal growth of low-birth-weight pigs is slower than that of their heavier litter mates (Handel and Stickland, Reference Handel and Stickland1988; Nissen et al., Reference Nissen, Jorgensen and Oksbjerg2004; Gondret et al., Reference Gondret, Lefaucheur, Louveau, Lebret, Pichodo and Le Cozler2005).
The total number of muscle fibres as well as the growth rate of the individual fibres is an important aspect of postnatal muscle growth. The muscle fibres are formed during foetal life, and in pigs the number is fixed before birth (Ashmore et al., Reference Ashmore, Addis and Doerr1973; Wigmore and Stickland, Reference Wigmore and Stickland1983; Christensen et al., Reference Christensen, Oksbjerg, Henckel and Jørgensen2000). As the number of muscle fibres in pigs is fixed before birth, postnatal muscle growth depends on growth of the individual muscle fibres. The growth rate of muscle fibres has been shown to be lower in pigs with a slow postnatal growth rate than in pigs with a fast postnatal growth rate (Nissen et al., Reference Nissen, Jorgensen and Oksbjerg2004). Muscle fibre growth is associated with an increase in both DNA and protein content. The increase in DNA is accomplished by the proliferation of the SC, which is a mono-nucleated muscle cell residing between the basal membrane and the sarcolemma of skeletal muscle fibres (Mauro, Reference Mauro1961), and its fusion with existing muscle fibres. Thereby the potential for protein turnover (synthesis – degradation) also increases within the fibres. Up to 90% of the DNA within muscle fibres in adult animals comes from SCs (Allen et al., Reference Allen, Merkel and Young1979).
Thus, the hypothesis is that differences in postnatal growth rate within litters of pigs are associated with a difference in SC proliferation, differentiation and fusion with existing fibres and/or the protein synthesis capacity of muscle fibres. The purpose of the present study was to examine differences between isolated SC cultures from low-, medium- and high-weaning-weight litter mates of pigs in their capacity to proliferate, differentiate and to synthesize and degrade protein after fusion into myotubes to test this hypothesis in vitro.
Material and methods
Animals
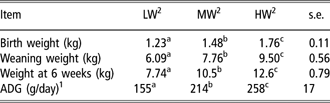
The experiments were conducted at the Faculty of Agricultural Sciences, University of Aarhus, Denmark. Eight Danish Landrace × Large White sows were mated to Duroc boars and allowed to farrow, and their litters were kept with the sow for a 4-week lactation period. Following weaning, the litters were fed ad libitum for another 2 weeks. The weights of individual pigs were recorded at birth, weaning and at 6 weeks of age (Table 1). At 6 weeks, SCs from the lowest weight (LW), medium weight (MW) and highest weight (HW) female pig within each litter were isolated. Thus, eight cultures of SCs were established for each of the three weight groups within litter, giving a total of 24 individual cell cultures.
Performance of pigs with different weaning weight within litter
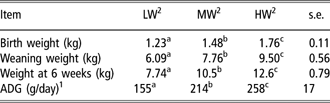
1ADG: average daily gain from birth to slaughter at 6 weeks of age.
2LW: lowest weight; MW: medium weight; HW: highest weight within litter.
a,b,cValues within row with different superscripts differ (P < 0.001).
Satellite cell isolation procedure
The method for isolation of SCs has previously been described for postnatal and foetal muscle tissue in pigs (Nissen et al., Reference Nissen, Sørensen, Vestergaard and Oksbjerg2005; Theil et al., Reference Theil, Sørensen, Nissen and Oksbjerg2006). In short, the LW, MW and HW female pigs within each of the eight litters were stunned by the CO2 method. Immediately after bleeding, the M. semimembranosus on the right side was dissected, and muscle tissue without visible fat and connective tissue was collected from the middle portion of the muscle. The muscle tissue was placed in 16 ml of phosphate buffered saline (PBS) containing 1% glucose, 30 mg collagenase (Collagenase Type 2, LS 4176; Medinova, Glostrup, Denmark), 2 ml of 2.5% trypsin (cat. no. 10210234001; Roche, Hvidovre, Denmark) and 2 ml of 0.1% DNAase (DN-25; Sigma, Brøndby, Denmark), and digested for 3 × 20 min in a water bath at 37°C. Between digestions the supernatant was collected in 50 ml tubes together with 20 ml of primary growth medium (PGM) containing Dulbecco’s modified Eagle’s medium (DMEM) (GIBCO 10106169; Invitrogen, Tåstrup, Denmark), 10% foetal calf serum (FCS) and 10% horse serum (HS) (GIBCO 26050088; Invitrogen) and kept on ice. The remaining tissue was mixed with PBS before a new round of digestion. After digestions, the cell suspensions were centrifuged (630 × g for 8 min at 4°C). The pellet was resuspended in 20 ml of PGM and filtered through a 200 μm filter and subsequently a 50 μm filter. To enrich the SC population of the cell suspension, the cell suspension was centrifuged (13 000 × g for 5 min) through a 20% Percoll gradient, and the cell suspension in the lower part of the centrifugation tube was collected, centrifuged (630 × g for 8 min at 4°C) and resuspended in PGM, and the number of cells was counted. Most cells were frozen in dimethyl sulphoxide (DMSO) in liquid nitrogen for later experiments, while a small portion was seeded in culture dishes for evaluation of proliferation and differentiation capacity.
Culture conditions
Cells were grown in 96- or 24-well plates (Nunc-143982; Biotech Line, Slangerup, Denmark) coated with Matrigel (1 : 50). The cells were seeded with 100 000 cells per ml (5000 cells per well in 96-well plates, 50 000 cells per well in 24-well plates) in DMEM containing 10% FCS, 10% HS, penicillin/streptomycin solution (final concentration 100 units penicillin, 100 μg streptomycin/ml, P-3539; Sigma), amphotericin B solution (final concentration 3 μg/ml, A-2942; Sigma) and gentamycinsulphate solution (final concentration 20 μg/ml, Sigma G-1272; Denmark). The medium was changed every 48 h. When the cells reached 80% confluence, the medium was changed to fusion medium containing DMEM with 10% FCS, 1 μmol/l of insulin (I-9278; Sigma) and antibiotics for the first 24 h, and thereafter DMEM with 5% FCS, 1 μmol/l of insulin, 1 μmol/l of cytosinearabinoside and antibiotics.
Proliferation
Proliferation was measured over a short period of 5 days. The rate of proliferation was quantified as described previously (Oksbjerg et al., Reference Oksbjerg, Petersen, Sørensen, Henckel, Vestergaard, Ertbjerg, Møller, Bejerholm and Støier2000) with minor changes. Briefly, cells were seeded in 96-well plates in four replicates per culture/pig at a density of 100 000 cells per ml in PGM and allowed to proliferate. The medium was changed every 48 h. At day 3 to 7 after seeding, the number of viable cells was quantified using a WST-1 kit (cat. no. 11644807001; Roche). Ten microlitres of WST-1 was added per well, and the absorbance was read at 450 and 630 nm on a microplate reader after 4 h.
Differentiation
SC differentiation was evaluated by measuring the activity of creatine phosphokinase (CPK). Cells were seeded in 96-well plates in four replicates per culture/pig at a density of 100 000 cells per ml in PGM. The medium was changed every 48 h. At 80% confluence, the medium was changed to fusion medium as described above. CPK activity was measured on the day the cells were 80% confluent, and thereafter at 24, 45, 72 and 88 h. To measure CPK activity, cells were washed with PBS buffer before adding 50 μl of ice-cold glycyl-glycine to each well. Plates were frozen at −80°C before measuring in order to allow the cells to lyse. After thawing, 25 μl of the lysate was transferred to a new 96-well plate, and another 25 μl of glycyl-glycine was added. One hundred and fifty microlitres of a reagent was added per well. The reagent included 2 ml of creatine phosphate (200 mM), 2 ml of glucose (200 mM), 2 ml of Mg-acetate (100 mM), 2 ml of ADP (1 mM), 2 ml of adenosine monophosphate (10 mM) and 10 ml of glycyl-glycine (0.1 M). On the day of measuring, 20 μl of glucose-6-phosphate-dehydrogenase (1 U/ml), 200 μl of hexokinase (0.5 U/ml), 218 μl thio-nicotinamide-adenine-dinucleotide (thio-NAD) (25 μg/μl) and 200 μl of dithiotreitol (154.9 μg/μl) were added to 20 ml of the above reagent, before it was added to the wells. Absorbance was read every minute for a 25-min period at a microplate reader at 405 nm. The activity of CPK in the cells was obtained against a standard curve.
Fusion percentages
The fusion percentage was calculated in SC cultures from one litter (three pigs). A total of approximately 2000 nuclei were counted per culture distributed at seven different locations in the wells. At each location the number of mono-nucleated cells, the number of cells/myotubes with two nuclei and the number of myotubes with more than two nuclei were counted.
Protein turnover
SC protein synthesis and degradation rates were evaluated by measuring the incorporation or release of 3H-tyrosine (TRK 200; Amersham Bioscience, Hillerød, Denmark). Cells were seeded in 24-well plates in four replicates per culture/pig at a density of 50 000 cells per well in PGM. The medium was changed every 48 h. At 80% of confluence, the medium was changed to fusion medium as described above.
Protein synthesis was measured as follows. Fusion is completed approximately 48 h after the cells reached 80% of confluence. At this time, the medium was changed to 5% fusion medium with 1 μci/well of 3H-tyrosine and incubated at 37°C for 5 h. After 5 h the cells were washed with PBS and harvested by adding 300 μl 0.25% trypsin per well and incubated at 37°C for 5–10 min until the cells had detached from the well. Trypsin was inactivated by adding 300 μl DMEM with 10% FCS per well, and the content was transferred to centrifuge vials together with another 200 μl of the medium, which had been used to wash the wells. The cells were centrifuged at 10 000 × g for 5 min. The pellet was washed with PBS and centrifuged again. The cells in the pellet were lysed with 200 μl of PBS with 1 M NaCl, mixed and homogenized with a sonicator (20 cycles: amplitude: 80%; cycle: 0.75 s). Hundred microlitres was used for counting in a β-counter.
Protein degradation was measured by seeding and growing the cells until 80% confluence as described above. At 80% confluence, the medium was changed to fusion medium containing 10% FCS and 2 μci/well of 3H-tyrosine. After 24 h the medium was changed to 5% FCS with 1 μmol/l of insulin, 1 μmol/l of cytosinearabinoside and 2 μci/well of 3H-tyrosine for another 24 h. The cells were washed with 2 × PBS, and a new medium with 2 mM tyrosine was added. After 24 h the medium was collected, and the cells were washed with 2 × PBS. Both medium and PBS were collected in a vial together with 500 μl of 15% trichloroacetic acid and kept overnight at 4°C. The next day the suspension was centrifuged at 13 000 × g for 5 min, and the supernatant was collected. The pellet was added 0.1 ml PBS with 1 M NaCl, mixed and kept at 4°C, until the pellet dissolved. The cells in the wells were harvested by adding 300 μl 0.25% trypsin, stopped with 300 μl DMEM with 10% FCS and transferred to a centrifugation vial. The wells were washed with a 200 μl medium, which was also collected. The suspension was centrifuged at 10 000 × g for 5 min, the pellet was washed with PBS and centrifuged again. Two hundred microlitres of PBS with 1 M NaCl was added to the pellet, mixed and homogenized with a sonicator. All collected materials were counted in a β-counter. The protein degradation rate was calculated by dividing d.p.m. in the soluble part of the medium (S), by d.p.m. in the insoluble part of the medium (I) and adding the d.p.m. in the cell layer (C) and the soluble part of the medium (S * 100/I + C + S).
Flow cytometry
The purity of the SC cultures was evaluated by characterizing the cell population for markers that are specific for muscle and SCs using flow cytometry. The primary antibodies used were Myo-D1 (M351201; Dako, Glostrup, Denmark), desmin (M076001; Dako), Pax 7 and 5.1H11. The Pax 7 and 5.1H11 antibodies were obtained from the Developmental Studies Hybridoma Bank developed under the auspices of the NICHD and maintained by the University of Iowa, Department of Biological Sciences, Iowa City, IA, USA. The procedure for staining with the cell surface marker 5.1H11 was as follows. SCs isolated from MW pigs were grown to 70–80% confluence, blocked with flourescent assisted cell sorting (FACS) buffer containing 10% goat’s serum and incubated for 30 min at 37°C. The cells were then incubated with primary antibody for 30 min at 37°C. The 5.1H11 was diluted 1 : 50 in PBS containing foetal bovine serum (FBS) before use. Subsequently the cells were incubated with the secondary antibody for 30 min at 37°C. The secondary antibody used was goat anti-mouse Alexa flour 488 Fab2 fragment (cat. no. 108115; BioLegend, San Diego, USA) diluted 1 : 250 in PBS containing FBS before use. To remove the cells from the wells, 4 ml of Accutase (L02-007; Fisher Scientific Biotech Line, Slangerup, Denmark) was added, and the cells were incubated for 7–10 min at 37°C. The cells were centrifuged for 5 min at 500 × g in FACS tubes coated with FACS buffer and later resuspended in 1 ml of FACS buffer prior to flow cytometry analysis.
The staining procedures for Pax 7, Myo-D1 and desmin were as follows. SCs isolated from MW pigs were grown to 70–80% confluence and removed from the wells by trypsin. The trypsin was blocked with DMEM with 10% FCS, and the cells were centrifuged for 5 min at 500 × g. The cells were fixed with ice-cold MeOH for 10 min at −20°C, and then FACS buffer was added. Centrifugation and resuspension in FACS buffer were repeated twice. Later the cells were blocked with 10% goat’s serum for 30 min at 4°C followed by incubation with primary antibody. Desmin was diluted 1 : 100, and Myo-D1 was diluted 1 : 10 before use and incubated for 2 h at 4°C. Pax 7 was used undiluted and incubated overnight at 4°C. After washing with FACS buffer, the cells were incubated with the secondary antibody for 1 h at 4°C. The secondary antibody used was goat anti-mouse Alexa flour 488 Fab2 fragment (cat. no. 108115; BioLegend) diluted 1 : 250 in PBS containing FBS before use. Subsequently the cells were washed and resuspended in FACS buffer prior to flow cytometry analysis.
Cell counting was obtained on a flow cytometer (FACS Canto; Becton Dickinson A/S, Brøndby, Denmark). The number of cells counted was approximately 30 000.
Statistical analysis
Data analysis was performed using the MIXED procedure of SAS (SAS Institute Inc., Cary, NC, USA). All analyses were performed using MIXED, with pig size (LW, MW or HW) as fixed effect, and sow as a random effect. For proliferation, the first measurement at day 1 (Figure 1) was included as a covariate in the statistical model. For differentiation, the first measurement was not included as a covariate as it was not significant. Results are presented as LSMeans, and when appropriate, LSMeans were separated by the differences of LSMeans-option in SAS.
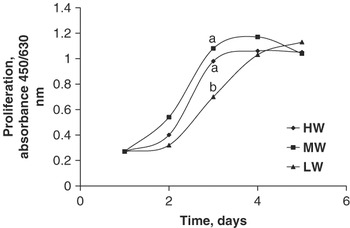
Satellite cell proliferation, measured as the number of viable cells at different time points, of cells isolated from the lowest weight (LW), medium weight (MW) and highest weight (HW) female pigs with eight litters. The time point 1 is the third day after seeding, but the first time the number of viable cells was measured. The time point 1 was used as a covariate in the statistical model. Each value represents the LSMeans of cultures from eight pigs. s.e. = 0.06.

Results
Pig weights
At 6 weeks of age, pigs were selected by weight as the LW, MW and HW female pig within each of the eight litters. As expected, birth and weaning weights also differed significantly among litter mates (P < 0.001) (Table 1). Therefore, average daily gain from birth to 6 weeks also differed significantly among litter mates (P < 0.001), and the HW had the highest daily gain followed by the MW and LW pigs.
Proliferation rate
Overall, a tendency towards a difference in proliferation (P = 0.09) was found among SC cultures from LW, HW and MW pigs (Figure 1). When analysing the different time points separately, no significant differences in the number of viable cells among cultures were found at days 2, 4 and 5, whereas at day 3 a significantly lower number of viable cells was found in cultures from LW pigs compared to cultures from HW (P < 0.05) and MW (P < 0.01) pigs. No significant differences were found between HW and MW cultures at any time point. Even though there was no overall significant difference in proliferation between LW, MW and HW cultures, LW cultures reached confluence approximately 1 day after the SC cultures of HW and MW pigs.
Differentiation rate
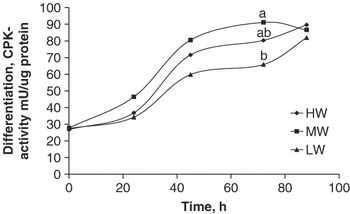
Differentiation, measured as the activity of CPK at different time points after the cells had reached 80% confluence, was significantly different between cultures (P < 0.05; Figure 2). At 72 h, differentiation was significantly higher in cultures from MW pigs compared to cultures from LW pigs, whereas no significant differences were found between cultures from MW and HW, and LW and HW pigs. Also, at 45 h a tendency (P = 0.07) towards a difference in differentiation between cultures from LW and MW pigs was found. At all other time points measured, no significant differences in differentiation among cultures were found.
Satellite cell differentiation, measured as the CPK activity at different time points, of cells isolated from the lowest weight (LW), medium weight (MW) and highest weight (HW) female pigs with eight litters. At 0 h the cells were 80% confluent, and at 24 h they were 100% confluent. Each value represents the LSMeans of cultures from eight pigs. s.e. = 5.8.

Fusion percentages
The fusion percentages including myotubes with more than two nuclei were 61 ± 3.8, 63 ± 3.7 and 65 ± 2.9 for SC cultures from the MW, LW and HW pigs within one litter, respectively. Fusion percentages including myotubes with two or more nuclei were 67 ± 3.4, 69 ± 3.4 and 73 ± 2.6 for SC cultures from the MW, LW and HW pigs within one litter, respectively.
Protein synthesis and degradation
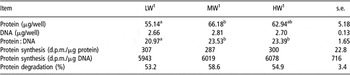
Protein synthesis and degradation as well as the protein and DNA content in the wells were measured in all cultures (Table 2). The protein content per well was significantly lower in cultures of SC from LW compared to MW pig (P < 0.05), whereas there were no significant differences between LW and HW, and between MW and HW pigs. Numerically, the protein content in HW pigs was between LW and MW. The DNA content per well did not differ significantly between cultures. The calculated protein : DNA ratio differed significantly between LW and both MW and HW pigs (P < 0.05), whereas no difference was found between MW and HW pigs.
Protein and DNA content, and protein synthesis and degradation in primary satellite cell cultures isolated from pigs with different weaning weight within litter

d.p.m. = disintegrations per minute.
1LW: lowest weight; MW: medium weight; HW: highest weight within litter.
a,bValues within row with a different superscript differ (P < 0.05).
Neither the protein synthesis nor the protein degradation rate differed significantly among litter mates (Table 2).
Characterization of cell population with flow cytometry
The SC cultures measured were 98.5% and 98.8% positive for desmin and Pax 7, respectively, and 99.9% positive for Myo-D1 and 5.1H11.
Discussion
In this study, pigs were selected by weight at 6 weeks of age with the purpose to select the pigs within litter with the highest difference in postnatal growth rate potential, to test the hypothesis that differences in postnatal growth rate within litters of pigs are associated with a difference in SC proliferation and fusion with existing fibres and/or the protein synthesis capacity of muscle fibres. As expected, the selected pigs differed significantly in both birth and weaning weights – in the same order as when selected at 6 weeks.
Although not significant, a tendency towards an overall difference in proliferation between cultures isolated from LW, MW and HW female litter mates was found in this study. Specifically, the number of viable cells was lower in cultures from LW compared to cultures from MW and HW pigs at day 3 but not at earlier or later time points, implying that the rate of proliferation was slower in LW cultures. In vivo, a slower proliferation rate would result in fewer SCs being available for fusion with existing muscle fibres at a given time. Thus, the slower postnatal muscle growth in LW compared to MW and HW litter mates may be partly related to the lower proliferation rate of the SC. An indication for this was also found in an earlier study by Nissen et al. (Reference Nissen, Jorgensen and Oksbjerg2004), where the mean fibre area in the M. semitendinosus was estimated, and it showed that at the same age MW and HW litter mates had the same area of muscle fibres, whereas LW litter mates had a smaller fibre area, implying that muscle fibre growth was slower in LW than in MW and HW pigs. In that study, the difference in growth rate between MW and HW litter mates was found to be due to differences in the number of muscle fibres and not the growth rate of the individual muscle fibres, whereas the difference between the LW and the HW was due to a difference in both the number of muscle fibres and the growth rate of the individual muscle fibres. Thus, a slow growth of individual muscle fibres may be related to the proliferation rate of attached SCs.
When SCs are cultured in vitro, they are taken out of their natural environment and grown under the same conditions in the laboratory. In vivo, differences in growth characteristics of SCs can be explained by differences in nutrient supply, amount of growth factors and fibre type, whereas this is not the case in vitro. Thus, differences in SC growth characteristics as found in this study must be due to different characteristics of the SCs themselves, which may reflect the in vivo environment they were isolated from. Differences in in vitro growth characteristics of SCs isolated from animals exhibiting different growth rates in vivo have also been found by others in different species. Chickens with high weight at hatch exhibit enhanced muscle growth, and this has been found to be at least partly due to a greater number of SCs as well as a higher proliferative activity of the SCs compared to small chicks (Sklan et al., Reference Sklan, Heifetz and Halevy2003). Velleman et al. (Reference Velleman, Liu, Nestor and McFarland2000) also found a difference in SC proliferation rate between SCs isolated from a line of fast- and slow-growing turkeys, showing that selection for increased muscle growth is closely related to an increased proliferation rate of the SCs. In the callipyge sheep, postnatal muscle hypertrophy is significantly higher than in normal sheep. This is accomplished by a higher DNA and protein content in several muscles, suggesting an increased proliferation rate of the SCs (Koohmaraie et al., Reference Koohmaraie, Shackelford, Wheeler, Lonergan and Doumit1995). Despite this increase in muscle DNA in callipyge sheep, Carpenter et al. (Reference Carpenter, Rodriguez and Cockett2000) did not find a difference in SC proliferation between callipyge and normal sheep when grown in vitro.
In the present study, proliferation was measured as the number of viable cells over a short period of 5 days. The first day of measurement (day 1) was used as a covariate in the statistical model. Thereby, any differences in the number of viable cells between cultures at the start of the measurement were taken into account when analyzing the later results.
The covariate (number of viable cells at day 1) was found to be significant, showing that the number of viable cells was different between cultures at the start of the experiment. This difference may be due to either a difference in plating efficiency/cell survival within the first days after seeding the cells or may be an indication of the SCs responding at a different rate to seeding and medium – giving rise to a lag period before proliferation starts. A lag phase has been observed by others, with a difference in the length of the lag phase dependent on whether or not cattle were implanted with a trenbolone acetate/estradiol implant before isolation of SC (Johnson et al., Reference Johnson, Halstead, White, Hathaway, DiCostanzo and Dayton1998). Also SCs isolated from rats at different ages exhibit various lengths of the lag period before proliferation starts (Schultz and Lipton, Reference Schultz and Lipton1982). It is believed that the longer the lag phase, the more quiescent the SCs present in the cell population, and they will take longer to activate than SCs that are cycling. Unfortunately, the reason for the difference in cell number at day 1 (which is 3 days after seeding) was not analysed in this study. Measurements earlier than day 1 would have been helpful to understand the difference at day 1, but based on earlier observations it was believed that no real proliferation was taking place within the first 2 to 3 days in our porcine primary cultures, and therefore these measurements were not included in this experiment.
Differentiation, measured as CPK activity, was significantly different between cultures. Thus, at 45 h a tendency was found and at 72 h a significant difference was found, showing that CPK activity was lower in LW cultures compared to MW cultures, whereas no difference was found between LW and HW, and HW and MW cultures. This implies that differentiation and fusion are taking place at a slower rate in LW than in MW cultures. This slower rise in CPK can be due to either fewer SCs actually withdrawing from the cell cycle and starting to differentiate or the fact that the fusion of differentiated SCs into multinucleated myotubes is inefficient and slower. By the end of the experiment, the CPK activity was the same in all cultures, suggesting that an equal number of SCs differentiate and fuse in cultures from LW, MW and HW litter mates although at a slower rate in LW cultures. This was also apparent as we found no significant differences in fusion percentages between cultures from LW, MW and HW litter mates.
A slow differentiation and fusion rate will result in a slower rise in myonuclei DNA and consequently in a lower capacity for protein synthesis. Thus, there also seems to be a close relationship between the differentiation and fusion rate, and the growth rate of the pigs in this study. This has also been found by others in poultry. In chickens, the myogenin levels were measured in muscle tissue from heavy- and light-hatching chickens, which exhibit differences in muscle growth rate, and the myogenin level peaked 1 day earlier in heavy-hatching than in light-hatching chickens (Sklan et al., Reference Sklan, Heifetz and Halevy2003). As myogenin is an important transcription factor involved in differentiation of muscle cells, the results from that study indicate that differentiation is initiated earlier in chickens with a fast growth rate than in slow-growing chickens. Measuring CPK protein levels, Velleman et al. (Reference Velleman, Liu, Nestor and McFarland2000) also found that SCs from fast-growing male turkeys had a faster differentiation rate than SCs from slow-growing male turkeys. In contrast, the opposite was found when comparing female fast- and slow-growing turkeys (Velleman et al., Reference Velleman, Liu, Nestor and McFarland2000).
Eventually, accumulation of protein within muscle fibres is the basis for muscle growth. A high protein synthesis together with low protein degradation is most beneficial for growth. In this study, both protein synthesis and degradation were measured at time points where the CPK activity either tended to or was significantly lower in LW compared to HW and MW SC cultures. In good agreement with this, lower protein content was found in LW compared to MW and HW cultures. Protein synthesis did not differ among cultures when calculated by the amount of both protein and DNA. Also, no significant difference was found among cultures in protein degradation. The explanation for lower protein content in cultures from LW compared to cultures from MW and HW pigs without any difference in protein synthesis and degradation rate is not obvious, but must be due to either a higher protein synthesis or degradation at earlier time points. Thus, the results in this study did not show any relation between protein synthesis and degradation rate in vitro, and postnatal growth potential of the pigs. In vivo studies may be relevant to further study this area, as the in vivo situation is much different from the in vitro one, especially because of the environment in which the cells grow and differentiate, as discussed earlier.
Primary cultures are, to a certain extent, contaminated with other cell lines than the one intended. In this study, the purity of the SC cultures was evaluated by characterizing the cell population for some muscle-specific markers by flow cytometry. The primary antibodies selected were both intracellular and membrane-bound markers for muscle and SCs. Results showed that for all markers (desmin, Myo-D1, 5.1H11 and Pax 7), at least 98% of the cells counted were positive. This indicates that the cell cultures used in this study are very pure regarding the amount of muscle cells, which is also observed visually. Although the cultures are very pure when characterizing with muscle cell markers, fusion percentages were measured from 61% to 73%. Thus, some cells do not fuse even though they are characterized as muscle cells. The explanation for this is not clear, but some cells may not be activated to differentiate and fuse under the culture conditions used.
Conclusions
The results presented in this study show that there is some heterogeneity in growth and differentiation of SCs isolated from LW, MW and HW pig litter mates. Generally, SCs from LW pigs have a significantly lower rate of differentiation and a tendency towards a lower proliferation rate compared to SCs from both MW and HW pigs. SCs from MW and HW pigs do not differ significantly in their growth and differentiation characteristics. The results found in this study show no difference in the ability of SCs to affect protein synthesis or degradation between SCs from litter mates exhibiting different growth rates in vivo.
Acknowledgements
The authors wish to acknowledge the Danish Councils for Independent Research for financial support for this project, and to thank Inge Lise Sørensen and Marianne Rasmussen for excellent laboratory and technical assistance.