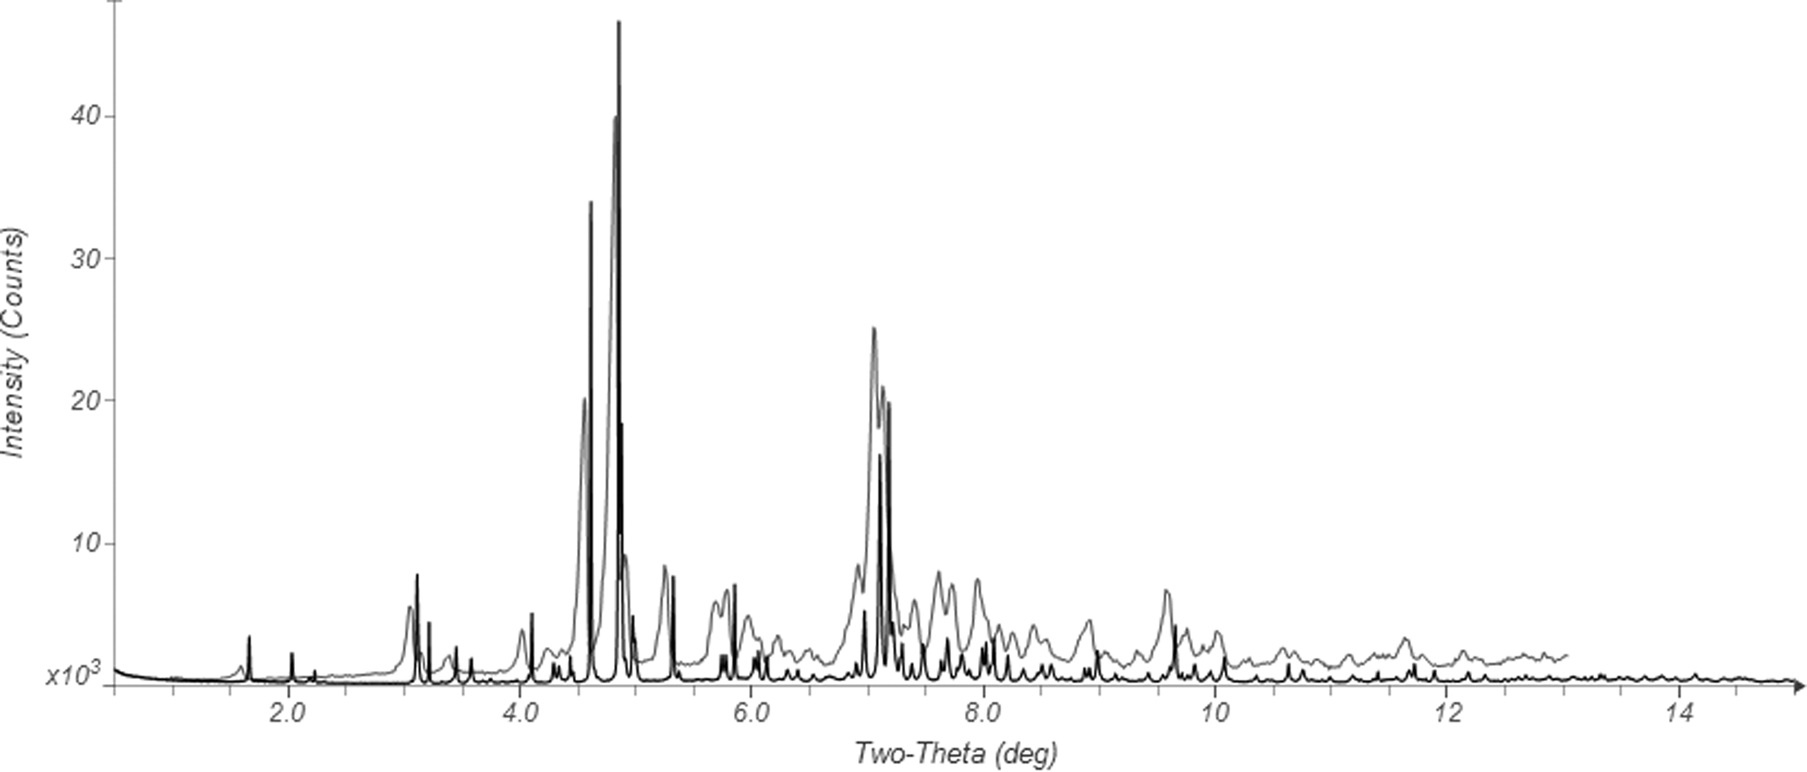
Pazopanib, sold under the brand name Votrient, is an anti-cancer medication. It is a potent and selective multi-targeted receptor tyrosine kinase inhibitor that blocks tumor growth and inhibits angiogenesis. It has been approved for renal cell carcinoma and soft tissue sarcoma by numerous regulatory administrations worldwide. Commercial pazopanib hydrochloride, CASRN 635702-64-6, crystallizes in space group P-1 (#2) with a = 8.45008(6), b = 8.71310(12), c = 16.05489(35) Å, α = 79.5996(9), β = 86.4784(5), γ = 87.3764(3)°, V = 1159.724(9) Å3, and Z = 2. A name search in the Cambridge Structural Database (Groom et al., Reference Groom, Bruno, Lightfoot and Ward2016) yielded Refcode CEVYEK, which is a private communication (Rybakov et al., Reference Rybakov, Putilova and Nhernobrovkin2018). A search of the patent literature demonstrates that this structure corresponds to Form 1 (referred to as L1) of US Patent Application 2016/0280689 A1 (Chava et al., Reference Chava, Gorantla, Indukuri, Dehury, Mekala, Shaik and Kuchipudi2016; Laurus) and its international equivalent WO 2015/068175 A2 (Chava et al., Reference Chava, Gorantla, Indukuri, Dehury, Mekala, Shaik and Kuchipudi2015) (Figure 1).
Comparison of the synchrotron powder diffraction pattern (black) of pazopanib hydrochloride to the reported laboratory X-ray diffraction pattern (green) of Form 1 (referred to as Form L1) from Chava et al. (Reference Chava, Gorantla, Indukuri, Dehury, Mekala, Shaik and Kuchipudi2015).

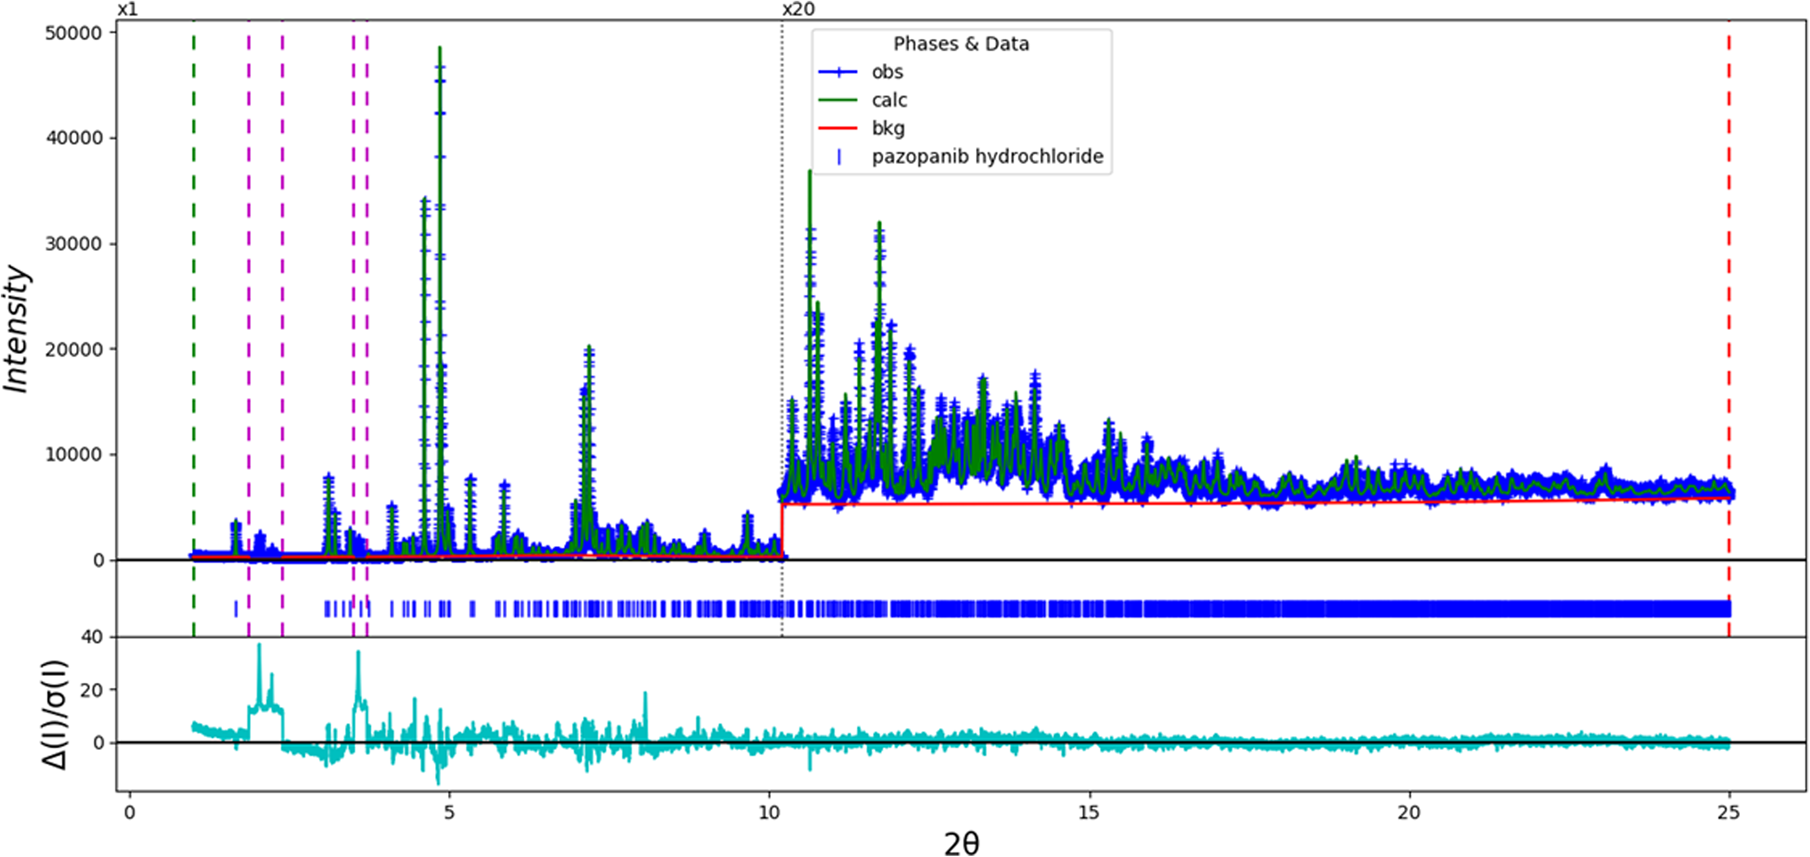
In this work, the sample was ordered from Ambeed (Lot #A623193-04) and analyzed as-received. The diffraction data for this study were collected on beamline 11-BM at the Advanced Photon Source, Argonne National Laboratory. The room temperature (295 K) crystal structure was refined (Figure 1) using synchrotron powder diffraction data (λ = 0.457912(2) Å) and optimized using density functional theory (DFT) techniques. The structure was refined using GSAS-II (Toby and Von Dreele, Reference Toby and Von Dreele2013; d min = 1.058 Å). All bond distances and angles were restrained using the results of a Mercury/Mogul Geometry Check (Bruno et al., Reference Bruno, Cole, Kessler, Luo, Motherwell, Purkis, Smith, Taylor, Cooper, Harris and Orpen2004; Sykes et al., Reference Sykes, McCabe, Allen, Battle, Bruno and Wood2011). The DFT optimization was carried out, along with a Mulliken population analysis, using CRYSTAL14 (Dovesi et al., Reference Dovesi, Orlando, Erba, Zicovich-Wilson, Civalleri, Casassa, Maschio, Ferrabone, De Le Pierre, D'Arco, Noel, Causa, Rerat and Kirtman2014); the B3LYP functional and 8 k-points were used. The basis sets for the H, C, N, and O atoms were those of Gatti et al. (Reference Gatti, Saunders and Roetti1994), and the basis sets for S and Cl were those of Peintinger et al. (Reference Peintinger, Vilela Oliveira and Bredow2013). The sample contains at least one crystalline impurity, which does not seem to correspond to Forms L-1 through L-9 of the Chava patent applications. The regions of the impurity peaks were excluded from the refinement (Figure 2).
The Rietveld plot for the refinement of pazopanib hydrochloride Form 1. The blue crosses represent the observed data points, and the green line is the calculated pattern. The cyan curve is the normalized error plot. The vertical scale has been multiplied by a factor of 20× for 2θ >10.2°. The pairs of vertical dashed lines indicate the excluded regions, which contain peaks from the unidentified impurity.

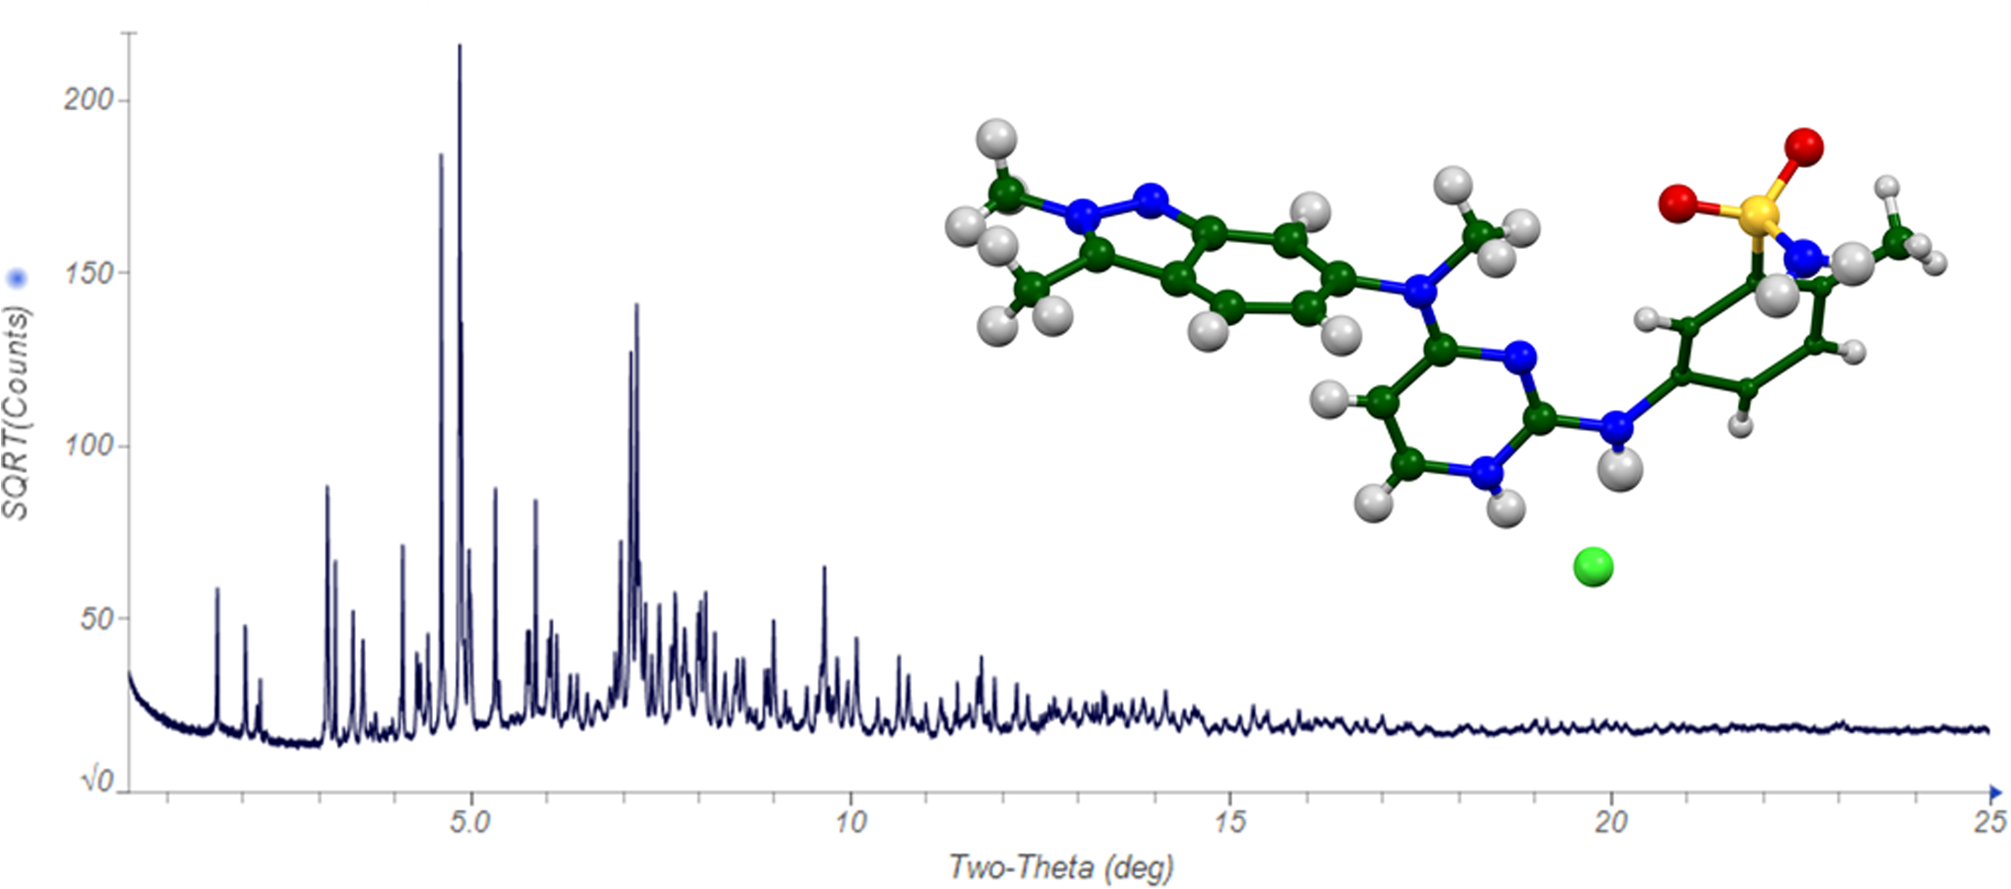
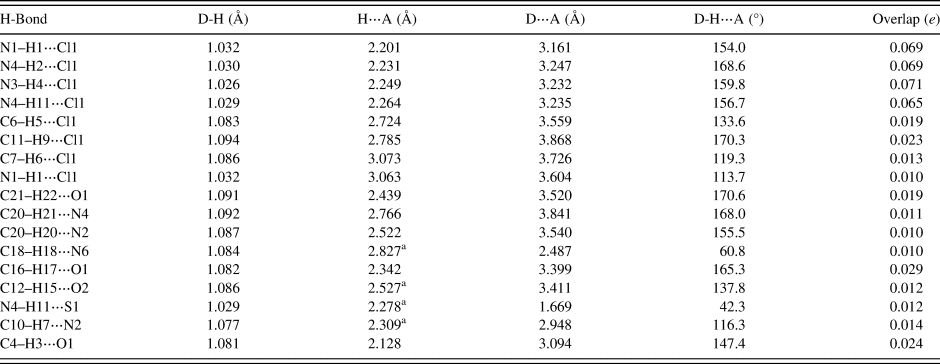
As expected, there are four strong N–H⋯Cl hydrogen bonds to the chloride anion (Table I). Several additional weaker N–H⋯Cl and C–H⋯Cl hydrogen bonds are also present. A variety of C–H⋯O, C–H⋯N, and N–H⋯S hydrogen bonds also contribute to the lattice energy. The lattice parameters determined in this study are slightly larger (0.1%) than those reported by Rybakov et al. (Reference Rybakov, Putilova and Nhernobrovkin2018) (also at room temperature). The differences probably reflect differences in the samples themselves. The single-crystal, Rietveld, and DFT structures are essentially identical. The root-mean-square Cartesian displacement between the non-H atoms of CEVYEK and Rietveld structures is 0.061 Å, and the comparable value for the Rietveld and DFT structures is 0.085 Å. The X-ray powder diffraction pattern from this study (Figure 3) has been submitted to ICDD for inclusion in the Powder Diffraction File (Gates-Rector and Blanton, Reference Gates-Rector and Blanton2019).
The powder diffraction pattern of pazopanib hydrochloride Form 1 (note that the vertical scale is the square root of the observed intensity) and the refined molecular structure (inset). The atoms are represented by 50% probability spheroids.

Hydrogen bonds (CRYSTAL14) in pazopanib hydrochloride Form 1.

a Intramolecular.
DEPOSITED DATA
The Crystallographic Information Framework (CIF) files were deposited with ICDD. You may request this data from info@icdd.com.
ACKNOWLEDGEMENTS
The use of the Advanced Photon Source at Argonne National Laboratory was supported by the U.S. Department of Energy, Office of Science, Office of Basic Energy Sciences, under Contract No. DE-AC02-06CH11357. This work was partially supported by the International Centre for Diffraction Data. We thank Lynn Ribaud and Saul Lapidus for their assistance in the data collection, and Andrey Rogachev for the use of computing resources at IIT.
CONFLICTS OF INTEREST
The authors have no conflicts of interest to declare.