


INTRODUCTION
Fasciolosis is a cosmopolitan anthropozoonotic disease of great importance for both veterinary and public health caused by the trematode Fasciola hepatica. In South America, F. hepatica must have been introduced by sheep and cattle brought by the early European settlers. It is an established cause for economic losses and decreased animal welfare in sheep and cattle (Torgerson and Claxton, Reference Torgerson, Claxton and Dalton1999). Although control is made with the mass treatment of humans and animals using triclabendazole, resistance to this drug has been reported in sheep in Europe and in South America (Oliveira et al. Reference Oliveira, Ferreira, Stival, Romero, Cavagnolli, Kloss, Araujo and Molento2008).
The patterns behind the geographical distribution of human diseases can be studied for disease mapping using geographic information systems (GIS) and subsequent development of risk maps to attribute a more cost-efficient control (i.e. vector-borne diseases) (Beck et al. Reference Beck, Lobitz and Wood2000). Disease mapping can use various methods, such as multivariate linear or logistic regression, spatio-temporal Bayesian modelling, maximum entropy and/or decision trees.
Decision trees are machine learning algorithms that use decision rules to classify the data in more uniform groups, thus reducing the entropy in the data and improving the information gain (Witten and Frank, Reference Witten and Frank2005). Decision trees have been used before in disease mapping and has proved to be valuable and easily interpretable results (Witten and Frank, Reference Witten and Frank2005; Martins-Bedê et al. Reference Martins-Bedê, Dutra, Freitas, Guimarães, Amaral, Drummond and Carvalho2010). The prevalence of F. hepatica in cattle and its link with several environmental and management variables have been studied in the Brazilian states of Rio Grande do Sul, Santa Catarina, Espírito Santo and Minas Gerais, however these studies were restricted to limited areas (Oliveira, Reference Oliveira2008; Dutra et al. Reference Dutra, Molento, Naumann, Biondo, Fortes, Savio and Malone2010; Alves et al. Reference Alves, Carneiro, Martins, Bernardo, Donatele, Pereira Júnior, Almeida, Avelar and Leão2011; Silva et al. Reference Silva, Freitas, Dutra and Molento2016). In this paper, the geographical distribution of bovine fasciolosis in Brazil was studied using a decision tree approach, and a logistic regression combined by a GIS query.
MATERIALS AND METHODS
Study area
The Brazilian territory comprises 8,514,215.3 km2 and is divided in 5 regions, 27 federal units and 5567 municipalities (IBGE, 2012). According to the Köppen climate classification system, the climate varies from equatorial and tropical in the north to semiarid in the northeast, highland tropical at the highlands of Brasilia, Belo Horizonte and São Paulo and subtropical or even temperate in the South (i.e. Florianopolis and Curitiba). In 2006, the total Brazilian cattle herd was 205·9 million heads (IBGE, 2016). Cattle production takes place in the entire Brazilian territory, but is concentrated in the Central west region, predominantly in the states of Mato Grosso, Mato Grosso do Sul and Goias (IBGE, 2016).
Data
Disease data
For this study, prevalence data were based on liver inspection of cattle slaughtered in establishments registered with the Federal Inspection Service of the Ministry of Agriculture, Livestock and Supply of Brazil, MAPA, during 2002–2011. The number of slaughtered animals and animals infected with F. hepatica were registered per municipality of origin. The data are described elsewhere (Bennema et al. Reference Bennema, Scholte, Molento, Medeiros and Carvalho2015).
Climatic and geographic data
The available climatic and geographic data are described in Table 1. MODIS provided a 16-day period data on Land Surface Temperature (LST) (day and night), NDVI (Normalized Difference Vegetation Index) and EVI (Enhanced Vegetation Index) for the period of 2002–2011. From these data, annual averages were calculated as well as the total average for the period.
Climatic and geographic data variables used for the model of Fasciola hepatica in Brazil

Other climatic variables were available from the Worldclim–Global Climate Data, which provided the interpolated monthly climatic information from weather stations and databases over a 50-year period (from 1950 to 2000) (see Table 1). Worldclim data have been used successful for ecological niche models by the global climate change community (Waltari et al. Reference Waltari, Hijmans, Peterson, Nyari, Perkins and Guralnick2007; Scholte et al. Reference Scholte, Carvalho, Malone, Utzinger and Vounatsou2012).
Additional geographic data concerned altitude and slope (Shuttle Radar Topography Mission, SRTM data), distance to rivers and water areas (1 km resolution, calculated from the Inland water map from the Digital Chart of the World) and vegetation type from the Land cover map (Global Land Cover 2000 Project) were used for the final calculation.
Decision tree approach
Classification of the F. hepatica observed prevalence
The observed average prevalence of F. hepatica over 2002–2011 was divided into three classes: low (0–15%), medium (15–30%) and high (>30%) prevalence. Due to the skewed distribution of the data, this rendered an imbalanced dataset where most cases belonged to class 1 (854/1032).
Variable selection
To restrict the number of variables entering in the decision tree, per data group (climatic/geographic) variables were selected based on their correlation with the continuous prevalence values.
Machine learning
The decision tree in this paper was developed using the Waikato Environment for Knowledge Analysis (Weka) (Hall et al. Reference Hall, Frank, Holmes, Pfahringer, Reutemann and Witten2009). This open source software provides several machine learning algorithms, including the J48 classifier that was used in this paper. This classifier is based on the C4·5 algorithm developed by Quinlan (Reference Quinlan1993).
The dataset used in this study was strongly imbalanced, which may cause an important inflation of the accuracy (Drummond and Holte, Reference Drummond and Holte2003; Albisua et al. Reference Albisua, Arbelaitz, Gurrutxaga, Martín, Muguerza, Pérez and Perona2009). Two strategies were used for the training of the tree: (1) using the whole dataset as training set, not correcting for the imbalance in the data and validating using 3-fold cross-validation and (2) dividing the data randomly into a training set (80% of the data) and a validation set (20%) and correcting the training set for imbalance: prevalence class 1 and 2 of the training set were under-sampled so that a dataset with 39 observations in each class was obtained. This causes a great reduction in the number of observations used for training, but reduces the imbalance effects. Under-sampling is a commonly applied technique in data mining of imbalanced data (Drummond and Holte, Reference Drummond and Holte2003).
The minimum number of cases per leaf was set at 12, and trees were pruned using subtree raising testing several levels of confidence. The level of confidence providing the highest global accuracy and precision was chosen for the final trees. Pruning simplifies the decision tree, producing a more general decision tree. This usually reduces accuracy, but prevents over fitting and facilitates interpretation (Witten and Frank, Reference Witten and Frank2005).
The first, uncorrected decision tree was validated using 3-fold cross-validation. The under-sampled decision tree was validated using the 20% validation set, with the original distribution of classes (i.e. not corrected for imbalance). A confusion matrix was constructed and based on the analysis using the global accuracy and area under the curve (AUC) of the Receiver Operating Characteristic (ROC). Also, the precision and the AUC per class were calculated. Using these new decision trees, all Brazilian municipalities were classified into the three prevalence classes and mapped using ArcGIS 9.3 (ESRI; Redlands, CA, USA). Classification errors were mapped for the municipalities where prevalence data was available.
Logistic regression
Logistic models were built in R (2.15.0) using the generalized linear model function, to study the associations between the prevalence of fasciolosis and several climatic and geographical factors. The proportion of animals infected with F. hepatica and slaughtered between 2002 and 2011 was used as a dependent variable (cases: slaughtered animals infected with F. hepatica, controls: slaughtered animals not infected with F. hepatica). Two models were built, the first (Model 1) included all factors as independent variables and the second (Model 2) included all factors except the BIOCLIM factors. This second model was built because the MODIS factors, which are available for 16-day periods, are more suitable for application in temporal prediction models (i.e. yearly or monthly risk prediction) than the 50-year average of the climate variables of BIOCLIM.
A training set of 80% of the data was used to build the models. Independent variables were centred by subtraction of their mean, in order to reduce co-linearity of possibly included interaction terms. Based on the AUC of the ROC analysis in an univariate logistic regression, independent variables were chosen to be included in a multivariate logistic regression using a forward stepwise method with a nominal significance level of α = 0·05 and 0·10 for the entry and removal of a variable, respectively. In case of a strong correlation between the independent variables (r ⩾ 0·5), only the variable with the highest AUC in the univariate logistic regression was included. The Akaike Information Criterion (AIC) of each model was calculated and used for model selection. The smaller the AIC, the better the model (Burnham and Anderson, Reference Burnham and Anderson2002). The model with the lowest AIC and highest AUC was chosen as the final model.
All two-way interactions were tested and significant interactions were included in the model if not compromising the parsimony of the model. The normality of the deviance residuals and heteroscedasticity was evaluated by a histogram of the residuals and a plot of residuals vs the predicted values.
The models were validated in the validation set, consisting of 20% of the data that were not used to build the models. In this validation, the predicted probability on municipality level was compared with the observed prevalence of infected animals. An AUC was calculated using as a threshold for ‘highly’ infected municipalities, an observed prevalence of infected animals of 15%. The accuracy of the prediction, as well as, the sensitivity and specificity were calculated using the same prevalence threshold of 15%. The optimal cut off of the predicted probability of infection used to estimate the accuracy, sensitivity and specificity of the models, was based on the best trade-off between sensitivity and specificity: 0·05 for Model 1 and 0·10 for Model 2. The resulting models were used to predict the probability of F. hepatica in Brazil.
GIS query model
In ArcGIS 9.3 (ESRI; Redlands, CA, USA) a GIS query was conducted, selecting the Brazilian municipalities with climatic and geographical characteristics falling within the range of the characteristics observed in the municipalities with prevalence higher than 5% of bovine fasciolosis. This method has been used before in the prediction of fasciolosis in Colombia (Valencia-López et al. Reference Valencia-López, Malone, Gómez Carmona and Velásquez2012). The same set of climatic and geographical variables, as used in the decision tree, were taken into account in this query. Using this selection, a map was made displaying the areas with environmental characteristics probably suitable for F. hepatica in Brazil. The suitability for F. hepatica of the areas outside this range requires further study.
RESULTS
Decision tree
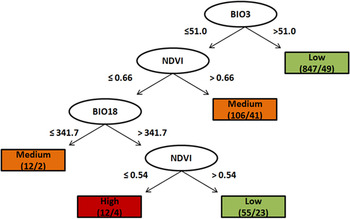
The decision tree was based on the original data including isothermality (BIO3), the average NDVI (2002–2011) and the precipitation in the warmest quarter of the year (BIO18).
Being represented at the root of the tree, the variable ‘isothermality’ contained the most information. Isothermality represents the diurnal oscillation in temperature compared with the summer to winter oscillation: in areas where the diurnal range is equal to the annual range, the isothermality has a value of 100, whereas in areas where the annual range is larger, such as in temperate climates, this value decreases. When constructing the decision tree, municipalities with an average isothermality higher than 51, meaning areas where the summer-winter oscillation is small, were classified as low prevalence areas.
Municipalities with BIO3 lower than 51 and an NDVI of higher than 0·66 were classified as medium prevalence areas. Municipalities with an NDVI smaller or equal to 0·66 and BIO18 lower than or equal to 341·7 mm were classified as medium prevalence areas as well. Municipalities with a BIO18 higher than 341·7 mm were classified either as high risk, when NDVI was lower than or equal to 0·54, or as low risk in case of an NDVI between 0·54 and 0·66.
The global accuracy of this tree was 85·1%. As shown in Table 2, the confusion matrix for the cross-validation, the precision of the tree decreased from 92% in the lowest prevalence class, to 48% in the medium class and 25% in the highest class. This indicates that the decision tree had difficulties classifying the two higher classes correctly, which can also be concluded from the numbers displaying the number of classifications/misclassifications shown in Fig. 1. The high global accuracy of this tree is due to the class imbalance, since most municipalities are in class 1. A tree predicting every municipality to be class 1 and omitting the other two classes would have a high global accuracy as well. The average AUC of this three was 0·84 with an AUC of 0·87; 0·84; and 0·82 in class 1, 2 and 3, respectively.

Confusion matrix tree 1 trained on the full dataset used for the model of Fasciola hepatica in Brazil

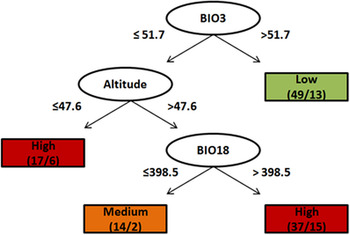
The tree trained on the under-sampled data included BIO3, altitude and BIO18 (Fig. 2). Municipalities with isothermality higher than 51·7 were classified as low risk areas. Municipalities with a lower isothermality and an altitude lower than or equal to 47·6 m were classified as high risk areas, whereas higher municipalities were classified as medium class if the precipitation in the warmest quarter was lower than or equal to 398·5 mm and higher class in case of more precipitation. As shown in Table 2, the confusion matrix for the cross-validation, the precision of the tree decreases from 96% in the lowest prevalence class, to 60% in the medium class and 13% in the highest class. The global accuracy of this tree was still high (80·7%) but might be more reliable because it has been corrected for class imbalance. Also, the accuracy of the medium class was higher. However, the classification of the highest class was less accurate, leading to more misclassifications (Table 3) of the municipalities with a high prevalence. The average AUC of this tree was 0·83, with an AUC of 0·88, 0·82 and 0·70 in class 1, 2 and 3, respectively.

Confusion matrix tree 2 trained on the under-sampled dataset used for the model of Fasciola hepatica in Brazil

In conclusion for this part, the prediction performance of both trees was similar though 80% is probably a more reliable estimate of the accuracy, as BIO3 and BIO18 were included in both trees.
Logistic regression
Model 1, starting from all variables, included BIO3 (isothermality) and BIO18 (the precipitation in the warmest quarter of the year) and both had a significantly negative effect on the logarithm of the odds of infection with F. hepatica (Table 4). This model had an AIC and AUC of 263·490 and 0·83 in the training set, respectively. In Model 2 (Table 4), excluding the BIOCLIM variables, altitude and the mean daily LST were kept as predictive factors, also both having a negative relationship with the logarithm of the odds of infection. The interaction between altitude and LST was significant, and also had a negative effect. Model 2 had an AIC of 482·577 and an AUC of 0·84 in the training set, respectively. Model 1, including the BIOCLIM variables had a lower AIC and thus a better fit.
Multivariate logistic regression models assessing the relationship of the proportion of Fasciola hepatica in cattle in Brazil as found using abattoir data from 2002–2011, and climatic and environmental variables. Model 1 including all variables and Model 2 excluding the BIOCLIM variables

a AIC: 263490, AUC: 0·83.
b AIC: 482577, AUC: 0·84.
Validation on the test set of 20% of the data showed an AUC of 0·92 for Model 1 and an AUC of 0·91 for Model 2. Using a cut-off of the prediction probability of 0·05, the prediction accuracy of Model 1 was 0·86 (95% CI 0·80–0·90) and the sensitivity and specificity were 0·87 (95% CI 0·71–0·95) and 0·86 (95% CI 0·79–0·90), respectively. Using a cut-off of the prediction probability of 0·10, Model 2 had an accuracy of 0·87 (95% CI 0·81–0·91) in the test set and a sensitivity and specificity of 0·87 (95% CI 0·72–0·95) and 0·86 (95% CI 0·81–0·91).
GIS query model
Table 5 shows the observed suitable ranges of the included variables in the dataset. The municipalities that fell within these ranges were considered possibly suitable, where the municipalities outside of this range were considered possibly unsuitable.
The range of the climatic variables in the municipalities with the presence of Fasciola hepatica in bovines in the period of 2002–2011

Risk mapping
The prediction maps made using the two decision trees indicated the south region as the area with the highest prevalence of F. hepatica. The uncorrected decision tree shows high risk areas only in the northern coast of RS, and medium class prevalence more inland and in the South of RS and along the coast of SC, PR and south SP (Fig. 3A). The decision tree that was corrected for data imbalance, classified more municipalities in the high prevalence class: along the coast of RS, SC, PR and south SP and inland in RS. In Fig. 4 however, it can be seen that many of these municipalities were over classified. Figure 3B shows the observed prevalence and the classifications of the tree of the municipalities where data were available. The classification error map confirmed the high global accuracy of the tree found in the cross-validation, as most of the municipalities are correctly classified, but also showed the lower precision in the medium and high classes, causing classification errors to occur mainly in the states with higher prevalence (RS, SC and PR states).
Classification maps: (A) based on the tree trained on the full dataset and (B) based on the tree trained using the under-sampled dataset.

Classification errors of both decision trees. (A) Display the observed prevalence classes, (B) and (D) display the predicted prevalence classes of tree 1 and 2, respectively, and (C) and (E) display the classification errors of tree 1 and 2, respectively.

The maps produced using the logistic regression models (Fig. 5) also show a higher infection risk in the southern states, especially RS and the coast of SC. Model 2, based on altitude and LST showed probability of infection of up to 0·3 along the entire coast and following the Amazon river. Model 1, based on BIO3 and BIO18 showed medium probability at the border of RS with Uruguay and Argentina.
Prediction maps based on the logistic regression models: (A) including BIOCLIM factors and (B) excluding BIOCLIM factors.

The GIS query map (Fig. 6) showed that in a large part of Brazil the studied climate variables fell within the same range as in the areas where F. hepatica infections were observed. Only the North and North East Regions, with the exception of part of Bahia, Pará and Rondonia, fell outside of this range, due to the ranges of BIO3 and BIO6.
Suitability for F. hepatica in Brazil based on a GIS-query of environment and climate data used in our study including BIO3, BIO6, BIO18, altitude and the average daily LST.

DISCUSSION
For the first time, the spatial distribution of F. hepatica was modelled using various methods for Brazil. Isothermality (BIO3) was the most influential variable and was included in both final decision trees and the final logistic regression model considering BIOCLIM variables. Other variables included in these final trees and models were BIO18 (precipitation in the warmest quarter of the year), altitude, NDVI and LST. Except for isothermality, the included variables have been linked to the presence of F. hepatica elsewhere (Malone et al. Reference Malone, Gommes, Hansen, Yilma, Slingenberg, Snijders, Nachtergaele and Ataman1998; Tum et al. Reference Tum, Puotinen and Copeman2004; Bennema et al. Reference Bennema, Ducheyne, Vercruysse, Claerebout, Hendrickx and Charlier2010; McCann et al. Reference McCann, Baylis and Wiliams2010). In this paper, a high isothermality was linked to low prevalence areas. These are areas with a tropical climate and dense vegetation: temperate climate areas, have a low isothermality and are more suitable for F. hepatica and its intermediate hosts (Torgerson and Claxton, Reference Torgerson, Claxton and Dalton1999). Therefore, a higher prevalence of F. hepatica is found more in the South of Brazil where the climate is subtropical to temperate. Isothermality seems to be an accurate predictor of the distribution of F. hepatica on a large scale, in this case: entire Brazil, but probably also applicable for other areas in South America. However, it is possible that on a smaller scale other factors influence the distribution and explain smaller disease clusters (Charlier et al. Reference Charlier, Bennema, Caron, Counotte, Ducheyne, Hendrickx and Vercruysse2011), such as cattle management or parasite control programs (Aleixo et al. Reference Aleixo, Freitas, Dutra, Malone, Martins and Molento2015).
The high AUC of the developed decision trees indicates an overall good predictive performance of this method. However, both trees showed a low accuracy in the medium and high classes and therefore more classification errors in those classes, and the accuracy of the decision tree in these classes was not improved by correcting for imbalance in the dataset. In the logistic models, high prevalence areas were predicted more accurately, as is seen from the high sensitivity of the predictions in the validation set.
The results of the logistic regression models were similar to those of the decision trees concerning the included variables as well as the predicted spatial distribution. The model including the BIOCLIM variables had a better fit than the model excluding these variables, indicating that longer year averages of climate data are useful in the prediction of bovine fasciolosis in Brazil. However, in temporal models, the MODIS data might be more useful.
The GIS query model showed that a large part of Brazil is probably suitable for F. hepatica, except for the North and Northeast where minimum temperatures and isothermality are too high. The GIS query method is a crude way of showing suitability, although possible interactions with other factors, rendering the areas unsuitable, were not considered. Also, the areas outside the range might still be suitable for F. hepatica due to combinations of other appropriate characteristics and because of the absence of observations outside the range of a climatic variable does not necessarily mean unsuitability of that part of the range.
Advantages of the decision tree approach are easy to interpret and no assumptions on distribution are made. Therefore, the approach allows accurate description of linear, as well as, non-linear relationships. A disadvantage of both the decision tree and the logistic regression is that spatial autocorrelation is not taken into account. Spatial autocorrelation entails that, for example, observations closer to each other are more similar than observations separated by a larger distance, and this phenomenon can cause inflation of the significance and exponents of the found risk factors (Durr et al. Reference Durr, Tait and Lawson2005).
Extrapolation for a large area like Brazil can be a dangerous practice when samples are not equally distributed over the study area, as is the case in our study. To confirm the performance of the used methods and the reliability of the risk maps, more data collection in areas where no data were available is required. This can be reached through fieldwork or through a combination of the municipal, state and federal abattoir data.
In future studies, it would be interesting to compare maps of the distribution of Lymnaea (e.g. Medeiros et al. Reference Medeiros, Scholte, D’ávila, Lima Caldeira and Carvalho2014) with the risk of fasciolosis found in this paper, or include such maps as risk factor for the prediction of fasciolosis occurrence. Further research in this area could be carried out using statistical methods such as Bayesian hierarchical modelling to account for possible spatial autocorrelation.
ACKNOWLEDGEMENTS
The authors acknowledge FIOCRUZ/René Rachou for the post-doc scholarship to Dr S. Bennema and to Dr C. Conti Naumann from the Ministry of Agriculture data supply.
FINANCIAL SUPPORT
This research received no specific grant from any funding agency, commercial or not-for-profit sectors.