





Adequate protein intake is essential for health and functioning when ageing. Low appetite, decreased physical activity and increased muscle loss, combined with low protein intake, are risk factors for decreased physical functioning(Reference Cederholm, Jensen and Correia1). In addition, adequate protein intake is crucial to our immune system(Reference Li, Yin and Li2) and wound healing(Reference Arnold and Barbul3). Despite its importance, up to 70 % of community-dwelling older adults do not meet the widely recommended protein intake of 1·0–1·2 g/kg body weight (BW)/d(Reference Hengeveld, Boer and Gaudreau4–Reference Deutz, Bauer and Barazzoni6). The Finnish national recommendations are based on the Nordic Nutrition Recommendations (2023)(Reference Blomhoff, Andersen and Arnesen7), and the daily recommended protein intake for older adults aged >65 years is 1·2–1·5 g/kg BW/d, being one of the highest worldwide.
Especially individuals over 80 years old are prone to energy-protein malnutrition(Reference Leij-Halfwerk, Verwijs and van Houdt8) and suboptimal protein intake, due to illnesses and loss of appetite. In the Newcastle 85+ Study(Reference Mendonça, Granic and Hill9), higher protein intake, especially 1·0 g/kg aBW/d or more, was associated with better disability trajectories.
Even though protein-energy malnutrition is a common nutritional problem among older adults(Reference Dent, Wright and Woo10), tools for screening and assessment of suboptimal protein intake are scarce. To our knowledge, Protein Screener 55+ (Pro55+, https://proteinscreener.nl/#/) (Reference Wijnhoven, Elstgeest and de Vet11), developed and validated in the Netherlands for research purposes, is the only one. It evaluates the probability of protein intake less than 1 g/kg BW/d based on food consumption frequency over the past 4 weeks. However, since protein intake recommendation in many Nordic countries is up to 1·2–1·5 g/kg BW/d(Reference Blomhoff, Andersen and Arnesen7), Pro55+ will not detect all individuals in need of intervention. In addition, due to cultural differences in food consumption, it is important to develop screening tools with culture-specific food items with good validity tested among national populations. Thus, there is a clear need for a simple, accessible screening tool to identify individuals at risk for low protein intake in clinical practice.
In this study, we aimed to validate a novel protein screening test, namely, the GERY Protein Intake Screening Test (GERYPROT), to identify suboptimal protein intake among the Finnish community-dwelling oldest-olds (80+ years). We used a 1-d food record as a reference and aimed to define the optimal cut-off point by maximizing both sensitivity and specificity.
Methods
Overall study design
The study population consists of a subsample of community-dwelling adults aged 80, 85, 90, 95 and 100+ years participating in the Helsinki Aging Study in 2019–2025(Reference Pitkälä, Aalto and Roitto12). The Helsinki Aging Study started in 1989 and has included multiple age cohorts (75-, 80-, 85-, 90- and 95-year-olds or over) drawn from the population register every 10 years(Reference Pitkälä, Strandberg and Tilvis13). The aim of the Helsinki Aging Study is to investigate the health of an ageing population and markers of ageing such as changes in well-being, functional capacity and morbidity(Reference Pitkälä, Aalto and Roitto12). The study includes postal surveys, clinical visits and telephone interviews (during COVID-19)(Reference Knuutila, Rautiainen and Lehti14).
Ethical approval
Ethical approval was provided by the Ethics Committee of Helsinki University Central Hospital, Finland (HUS/456/2023). Oral informed consent was obtained from participants before the screening procedure and written informed consent at the start of the clinical visit.
Study population
We included a subsample of 140 older adults (64 % women, age range 80–100 years) participating in the follow-up of the fourth cohort wave (2019–2022) of the Helsinki Aging Study between March 2024 and November 2024. The study population of the fourth wave (N 1810) consisted of age cohorts of 75, 80, 85, 90, 95 and 100+ years randomly drawn from the population register (Figure 1). The COVID-19 pandemic hindered the clinical examinations and forced us to perform the examinations at multiple time points. Many of the oldest olds (85- to 100-year-olds’) got tired and did not want to continue in the study. In 2021, N 898 participated in telephone interviews. In 2022, those who were willing and able to attend the clinical visit were recruited to the follow-up (N 640), which included novel dimensions related to nutrition and their associations with frailty, sarcopenia and quality of life. In 2024–25, the volunteering participants (N 351) were re-assessed by study nurses and examined for their oral health by a dentist. Of them, the first (N 140) visited a nutritionist who gave detailed instructions on how to complete a 1-d food diary and the GERY Protein Intake Screening Test.
A flow chart of the study sample selection.

The main inclusion criteria were Finnish as the first language, community-dwelling status, literacy and cognitive and functional capacity to consent and complete the clinical visits and at-home dietary assessments. All participants who completed the study visits and at-home dietary assessments by 21st of November 2024 were included in this validation study.
Screening for protein intake: GERY Protein Intake Screening Test (GERYPROT)
The GERY Protein Intake Screening Test (GERYPROT) was developed between 2021 and 2023 by the Society for Gerontological Nutrition in Finland (GERY). The aim was to provide a practical, easy-to-use, tool to evaluate suboptimal protein intake among Finnish older adults and a guidance tool that illustrates good protein sources. The test results in estimated daily protein intake in grams.
The test was developed following the methodological framework outlined by Contillo et al.(Reference Contillo, Chun and Rodriguez15), incorporating three key elements: (1) selection of protein sources most commonly consumed by older adults in Finland, (2) inclusion of standardised portion sizes supported by visual representations and (3) refinement based on feedback obtained from the target group.
The selection of the nineteen protein sources was guided by evidence from the Finnish national dietary survey(Reference Valsta, Kaartinen and Tapanainen16), which shows that the majority of protein intake in Finnish adults is derived from a limited number of food groups, particularly dairy products, meat, egg and cereal products. These sources together account for most of the total protein intake, with approximately two-thirds coming from animal-based and one-third from plant-based sources. The screener includes a broad range of commonly consumed protein sources in Finland, including dairy products, meat and meat products, cereal products and plant-based protein sources.
Hence, the final version of the test comprises nineteen protein sources most often present in the diets of older Finnish adults: milk, yogurt, quark, (cottage)cheese, egg, meat, fish, cold-cut meat/sausage, sausage, beans, peas/pea soup, tofu, nuts, muesli, bread, porridge and pasta.
Designed to be visual, straightforward and user-friendly, the test records the number of daily servings consumed (as such or in mixed dishes), with each serving represented by an image and a numerical value corresponding to ∼7 g of protein. The test also considers other protein-rich food products (e.g. nutritional supplements and protein drinks) provided that the amount of protein (in grams) is reported. The total dietary protein intake is calculated by multiplying the number of servings by 7 (g) and adding any additional protein sources reported.
Measures
Background measures included sex, age, BMI, years of education, smoking, household status, self-rated mobility, difficulties in everyday activities, nutritional status, unintentional weight loss within the previous 3 months, appetite, stomachache, use of vitamin supplements, dysphagia, cognition, mortality risk and frailty.
Sex, date of birth and years of education were retrieved from the previous records collected in 2019–2022. BMI was calculated based on measured weight at the study visit in 2024 and measured height at the study visit in 2019. All other background measures were assessed at the study visit in 2024 by a questionnaire. Self-rated mobility was assessed with a question part of the 15D(Reference Sintonen17) questionnaire evaluating health-related quality of life. Responses “I am able to walk normally (without difficulty) indoors, outdoors and on stairs” and “I am able to walk without difficulty indoors, but outdoors and/or on stairs I have slight difficulties” were perceived as “Independent mobility with or without a device”. Difficulties in everyday activities were assessed with a question on usual activities, also part of the 15D. Responses “I am able to perform my usual activities much less effectively, with considerable difficulty, or not completely”, “I can only manage a small proportion of my previously usual activities” and “I am unable to manage any of my previously usual activities” were considered having ‘difficulties in everyday living’. Stomachache was assessed with a question “Have you had these symptoms during the past two weeks?”. Responses “occasionally” and “often” were perceived as having stomachache. Use of vitamin supplements was derived from the food diaries. Dysphagia was assessed with a question “Do you have difficulties in swallowing food?”, and responses “always” and “sometimes” were considered as dysphagia. Nutritional status, unintentional weight loss within the past 3 months and appetite were assessed with the Mini Nutritional Assessment (MNA-SF) screening tool(Reference Rubenstein, Harker and Salvà18). Responses “weight loss greater than 3 kg” and “weight loss between 1 and 3 kg” were considered “unintentional weight loss”. Appetite was assessed with a question: “Has your food intake declined over the past 3 months?”. A response “No decrease in food intake” was perceived as “good appetite”. Cognition was assessed with the clock-drawing test (i.e. “draw a dial with numbers showing a specific time”)(Reference Shulman, Pushkar Gold and Cohen19) and the verbal fluency test (i.e. “name as many animals as possible in one minute”)(Reference Rosen20). Mortality risk was assessed with Charlson comorbidity index(Reference Charlson, Pompei and Ales21). Frailty status was assessed using the Fried criteria for phenotypic frailty(Reference Fried, Tangen and Walston22).
Nutrient intake was assessed using a 1-day food record in which the participants reported all foods, beverages and dietary supplements consumed during the day. The GERY Protein Intake Screening Test was conducted at the end of the same day or the following morning, corresponding to the completion of the food record. Participants were asked to recall which food items they consumed and reported the number of servings consumed. The participants were also asked to consider protein sources included in mixed dishes (e.g. meat in a casserole or egg in baked goods), if possible. The servings could be recorded as halves or less, if needed.
The dietary assessment took place at home on a set day after the clinical visit. The participants received detailed instructions for completing the dietary assessment forms: both oral instructions during study visits and written instructions to be reviewed at home. Additionally, the participants received advice by telephone, if needed. On the day after (or as soon as possible), a research assistant interviewed the participants by telephone and documented both the food record and the protein test that they had completed. Clarifying, non-leading, questions were asked when necessary.
Nutrient intake was derived from the food records using the Finnish Food Composition database “Fineli”(23). The daily intakes of energy (kcal), fat (g), carbohydrates (g) and protein (g and g/kg BW) were calculated. Protein intake (g) based on the GERY Protein Intake Screening Test was calculated as described above.
The validity of the GERY Protein Intake Screening Test was assessed using the 1-d food record as a reference, with suboptimal protein intake defined as <1·2 g/kg BW/d based on the national food recommendations for older adults in Finland(24).
Statistical analysis
The required sample size was calculated to detect an area under the receiver operating characteristic curve (AUC) of 0·70, compared with a null-hypothesis AUC of 0·50. Variance estimates(Reference Obuchowski, Lieber and Wians25) were computed for continuous data, assuming a two-sided significance level of 5 % and 90 % statistical power. Based on these assumptions, the minimum required sample size was estimated to be eighty-four subjects.
Background data and nutrient intake data from the food record were categorised based on protein intake data (g/kg BW/d). Three classification thresholds (<1·00, 1·00–1·19 and ≥1·20 g/kg BW/d) were determined based on existing recommendations(Reference Bauer, Biolo and Cederholm5,24) .
Descriptive values were presented as means with sd, counts with percentages or medians with interquartile range. The hypothesis of linearity across protein intake categories was tested using analysis of variance for continuous variables and the Cochran–Armitage test(Reference Armitage26) for categorical variables. Criterion validity, specifically concurrent validity, of the protein screening test was evaluated using the food record as a reference. The assumption that protein intake ˂1·2 g/kg BW/d is suboptimal was applied in the analysis.
A Bland–Altman plot(Reference Bland and Altman27) was constructed to assess the absolute agreement between the protein screening test and the food record. The coefficient of repeatability expressed the expected maximum size of 95 % of the absolute differences between the paired observations. The degree of agreement between the two dietary assessment methods was evaluated using Lin’s concordance correlation coefficient(Reference Lin28) and visualised with a scatter plot. Sensitivity and specificity were reported to describe the ability of the protein screening test to identify individuals with suboptimal protein intake and those without, respectively. The positive likelihood ratio (LR+) was calculated to estimate how much more likely a positive screening result is to occur in those with suboptimal intake, relative to those without. A receiver operating characteristic curve was constructed to visualise the diagnostic performance of the protein screening test. The AUC was calculated to assess the test’s discriminative capacity. The optimal cut-off for identifying suboptimal protein intake with the screening test was determined by maximizing both sensitivity and specificity. CI for the primary values were obtained by bias-corrected and accelerated bootstrapping (5000 replications). The Shapiro–Wilk test was used to assess the normality of the data.
Results
The background characteristics of the study sample by protein intake are presented in Table 1. The majority of participants in all groups were women, and the mean age was 85 years. All participants excluding one were prefrail or frail based on the Fried criteria(Reference Fried, Tangen and Walston22). Nutritional status measured by mean MNA was good, and mortality risk, measured by Charlson comorbidity index, low, in all groups. Only one participant reported use of oral nutritional supplements, and none had meals on wheels receipts (data not shown). Statistically significant differences between the groups were observed in mean BMI, independent mobility and the clock-drawing test score. The mean BMI was highest in the low intake group, and lowest is the high intake group.
Background characteristics of the study sample (n 140) by protein intake (g/kg BW/d)

Table 1. Long description
A table comparing background characteristics of study participants by protein intake levels. The table has 18 rows and 11 columns. Column headers are Variable, <1.00, 1.00-1.19, >= 1.20, and P-value. Row labels include Women, Age, BMI, Education years <8, Never smoked, Living alone, Independent mobility with/without device, Difficulties in everyday living, MNA-SF score, Unintentional weight loss, Good appetite, Stomach ache, Use of vitamin supplements, Dysphagia, Number of medications, Clock-drawing test score, Animal-naming test score, CCI score, and Frailty status. Each row provides data for the categories <1.00, 1.00-1.19, and >= 1.20, including counts and percentages for categorical variables and means with standard deviations for continuous variables. Notable trends include significant differences in BMI, independent mobility, and clock-drawing test scores across protein intake levels.
Abbreviations: MNA-SF, Mini Nutritional Assessment, Short Form; CCI, Charlson comorbidity index.
* P value for linearity.
† Frailty classification: robust = score 0/5; pre-frail = score 1–2/5; frail = score 3/5 or higher.
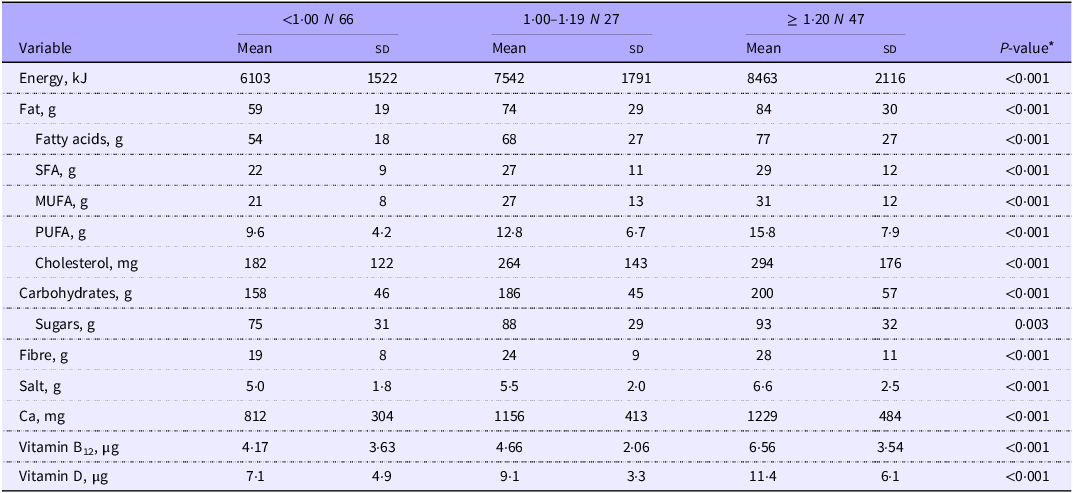
Nutrient intake by protein intake is presented in Table 2. In the highest protein intake group, the intake of all nutrients was significantly greater than in the other intake groups.
Intake of energy and nutrients by protein intake (g/kg BW/d) among the study sample (n 140)

Table 2. Long description
The table presents nutrient intake data categorized by protein intake levels, with three groups: less than 1.00 grams per kilogram of body weight per day (N 66), 1.00 to 1.19 grams per kilogram of body weight per day (N 27), and 1.20 grams or more per kilogram of body weight per day (N 47). The table includes columns for mean values and standard deviations (SD) of various nutrients. Row labels include Energy (kJ), Fat (g), Fatty acids (g), SFA (g), MUFA (g), PUFA (g), Cholesterol (mg), Carbohydrates (g), Sugars (g), Fibre (g), Salt (g), Calcium (mg), Vitamin B12 (µg), and Vitamin D (µg). Each row provides the mean and SD values for these nutrients across the three protein intake groups. The P-value column indicates the statistical significance of the differences observed among the groups.
* P value for linearity.
The Bland–Altman plot (Figure 2) shows good agreement between the GERY Protein Intake Screening Test and the 1-day food record (coefficient of repeatability = 0·44, 95 % CI: 0·39–0·49). In addition, concordance correlation coefficient (Figure 3) demonstrates good agreement between the two methods (0·87, 95 % CI: 0·83–0·91).
Bland–Altman plot comparing protein intake estimates between the GERY Protein Intake Screening Test and the 1-d food record in the study sample. Difference in protein intake is expressed as protein screening test – 1-d food record. Abbreviations: BW, body weight; CR, coefficient of repeatability.

Scatterplot of protein intake from the GERY Protein Intake Screening Test v. the 1-d food record in the study sample. Abbreviations: BW, body weight; CCC, concordance correlation coefficient.

The receiver operating characteristic curve (Figure 4) indicates good diagnostic performance of the test (AUC = 0·90, 95 % CI: 0·85–0·95). This finding is supported by high sensitivity (0·85, 95 % CI: 0·72–0·94), specificity (0·81, 95 % CI: 0·71–0·88) and positive likelihood ratio (4·40, 95 % CI: 2·86–6·77). An optimal cut-off for the screening test to identify suboptimal protein intake was assessed at <1·00 g/kg BW/d.
Receiver operating characteristic (ROC) curve for the GERY Protein Intake Screening Test in identifying suboptimal protein intake among the study sample. Abbreviations: TPF, true-positive fraction; FPF, false-positive fraction; AUC, area under the curve; LR+, positive likelihood ratio.

Discussion
In this study, we validated a novel screening tool, namely, the GERY Protein Intake Screening Test, to predict low protein intake among the Finnish community-dwelling oldest-olds. The test showed good concurrent validity with the food record and diagnostic performance. Thus, our findings support the use of the GERYPROT to screen suboptimal protein intake (<1·2 g/kg BW/d) among the Finnish community-dwelling oldest-olds in clinical settings. This is the first screening tool developed and validated among the Finnish population that screens specifically sub-optimal protein intake.
Assessment of the protein screening test indicated good criterion validity, particularly concurrent validity, according to metrics of agreement and diagnostic accuracy. The high concordance correlation coefficient value further supports the strong and consistent agreement between the two dietary assessment methods. The Bland–Altman plot showed a modest systematic underestimation of protein intake, likely attributable to the test’s limited coverage of diverse protein sources in the diet. The test included nineteen protein sources from various food groups most often present in the diets of older Finnish adults. However, mixed dishes represent a known challenge in dietary assessment, as their protein content depends on multiple ingredients and preparation methods. In this study, respondents were explicitly instructed to consider protein-containing ingredients used in food preparation, which partly mitigates this limitation. Nevertheless, screening tools are often prone to systematic error(Reference Contillo, Chun and Rodriguez15), and as the tool relies on self-report and estimation, some degree of underestimation remains likely. The expected absolute difference between the two methods was ≤0·44 g/kg BW/d, which should be taken into account in clinical settings.
The AUC indicated a strong discriminative capacity for the protein screening test. High values for sensitivity and specificity further reflect vast diagnostic potential. Ensuring high sensitivity is particularly important to maximise the detection of true-positive cases and reduce the likelihood of missed cases that would benefit from an intervention. However, the positive likelihood ratio (LR+), which indicates the ratio of false-positive results to true-positive results, can only be considered moderate. The absolute number of false-positive and false-negative results was n 3 and n 23, respectively (Supplemental material, Table 1). Since most of the false cases were false negative, and the chosen cut-off <1 g/kg BW/d is less than the current recommendation, it won’t decrease the clinical applicability of the GERYPROT. There were no statistically significant differences in the background characteristics between the true and false cases (Supplemental material, Table 2).
The chosen cut-off maximised both sensitivity and specificity, as intended. It reflects the actual intake below the national recommendations for protein intake(24).
To our knowledge, the Pro55+(Reference Wijnhoven, Elstgeest and de Vet11) is the only other protein-specific dietary screening tool developed and validated for adults aged over 55 years. It is an online tool that provides the probability (%) of suboptimal (<1·0 g/kg BW/d) protein intake based on food intake of the past four weeks, including ten questions regarding frequency. The Pro55+ showed good validity among Dutch community-dwelling (older) adults, when tested against a food frequency questionnaire(Reference Wijnhoven, Elstgeest and de Vet11). However, given the differences between Pro55+ and the GERYPROT in terms of validation metrics, contextual factors and sample characteristics, it is not methodologically justified to compare their construct validity or utility for screening suboptimal intake of protein. Below we highlight these differences in more detail.
First, the recall period of the two tests differs substantially. Pro55+(Reference Wijnhoven, Elstgeest and de Vet11) assesses intake over the previous 4 weeks, requiring respondents to estimate habitual consumption, which may increase cognitive burden and recall bias, particularly among older adults. In contrast, the GERYPROT focuses on a single recent day, aligning more closely with established dietary assessment methods such as 24-h recall.
Second, the coverage of protein sources differs. The Pro55+(Reference Wijnhoven, Elstgeest and de Vet11) tool includes a relatively limited set of food items and does not fully capture some of the main contributors to protein intake in Finnish diets, such as a broader range of cereal products, dairy products (including milk) and meat-based dishes. The GERYPROT was specifically developed based on Finnish dietary data(Reference Valsta, Kaartinen and Tapanainen16) to reflect the most important protein sources at the population level.
Finally, the intended use and format of the tools are different. The Pro55+(Reference Wijnhoven, Elstgeest and de Vet11) screener was primarily developed to identify individuals at risk of inadequate protein intake, whereas GERYPROT aims to provide a more detailed estimation of protein intake to support dietary counselling and identify individuals with suboptimal protein intake. The GERYPROT was also designed as a simple, paper-based tool that can be self-administered by older adults or completed together with a healthcare professional in clinical settings. The inclusion of portion size images further supports usability and facilitates more accurate estimation of intake.
Taking together, these differences in methodology, content and intended use support the development of a new, context-specific tool rather than direct adaptation of the Pro55+(Reference Wijnhoven, Elstgeest and de Vet11) screener.
This study has several strengths. The GERYPROT is the first of its kind, developed in alignment with the conceptual framework of Contillo et al.(Reference Contillo, Chun and Rodriguez15) The test is based on the Finnish cultural context, is easy to use and is applicable in clinical settings. The study adhered to a rigorously standardised protocol, with transparent reporting practices to ensure good reproducibility and scientific integrity. Statistical analyses were selected in collaboration with an experienced statistician to guarantee high quality of the study.
Some limitations warrant discussion. Interpretation and generalisation of energy and nutrient intake data should be approached with caution. First, 1-d food record may not adequately capture individual day-to-day variability, and non-weighed portion size estimations – particularly those based on visual assessment – may introduce measurement error. Mean protein intake over multiple days would give more reliable data on general protein intake. However, at a population level, 1-d food diary has been considered adequate(Reference Basiotis, Welsh and Cronin29). Secondly, it should be noted that the GERYPROT test is retrospective and requires good cognitive abilities for accurate completion. Thirdly, the study population consists of community-dwelling, prefrail and frail older adults with good nutritional and cognitive status. It is highly selective since the participants were able to participate in several follow-ups from 2019. Thus, the findings can be applied only to cognitively relatively intact community-dwelling older adults.
Fourthly, the synchronous increase of all dietary macronutrients and micronutrients suggests that the protein intake level is heavily confounded by total dietary intake volume, rather than reflecting independent consumption of protein-rich foods. Therefore, the optimal cut-off should be interpreted cautiously. The synchronous increase of protein and energy has been seen in previous studies(Reference Niskanen, Wijnhoven and Pitkälä30). However, this did not lead to an increase in weight. It might be difficult to increase only protein intake without increasing total energy intake.
Fifthly, we did not systematically collect data on feasibility and users’ experiences, but we received favourable spontaneous feedback from several participants about the nice photos in the screener and its ease of use.
Conclusions
The GERY Protein Intake Screening Test shows good validity in identifying suboptimal protein intake among the Finnish community-dwelling oldest-olds (80+ years). It shows diagnostic potential for identification of individuals with suboptimal intake and potential for targeted intervention for those in need. Further systematic verification should be done to ensure applicability and generalisability of the GERYPROT to those with cognitive impairment, poor nutritional status, robust individuals and those living in long-term care facilities. Also, user experience studies are needed to assess the feasibility of the tool. Lastly, the results are not applicable in other cultural settings using other foods without modification. Further validation of the GERYPROT among different populations is encouraged.
Supplementary material
For supplementary material/s referred to in this article, please visit https://doi.org/10.1017/S0007114526109398
Data availability statement
The data are available from the corresponding author on reasonable request.
Acknowledgments
We acknowledge the members of the Helsinki Aging Study group. In addition, we acknowledge the personnel of the Society for Gerontological Nutrition in Finland (GERY) for contributing to the development of the GERY Protein Intake Screening Test and data collection. Finally, we thank the study participants.
Author contributions
K.H.P. and M.H.S. obtained funding for the Helsinki Aging Study. M.H.S. obtained funding for the Society for Gerontological Nutrition in Finland (GERY). K.H.P. and M.H.S. contributed to the conception and design of the trial. H.S.-S. and M.H.S. were responsible for development and refinement of the GERY Protein Intake Screening Test. M.J. coordinated the data collection. A.R. and M.J. contributed to data collection. H.K. provided statistical expertise and conducted statistical analysis. R.T.N. and A.R. drafted the manuscript. H.S.-S., M.J., M.M., S.K., K.H.P., S.K.J. and M.H.S. all critically reviewed the manuscript. All authors approved the final version.
Financial support
The Helsinki Aging Study was funded by the Helsinki University Hospital VTR funds and the Society for Gerontological Nutrition in Finland (GERY). Personal grants were received from the Juho Vainio Foundation.
Competing interests
The authors declare no competing interests.




 Open access

