1. Introduction
In this paper, we answer the question of what are the effects of income tax reductions in an economy where production is organized in a network. Bigio and La’o (Reference Bigio and La’o2020) and Baqaee and Farhi (Reference Baqaee and Farhi2020) explore the effects of sectoral revenue taxes, or macroeconomic effects of microeconomic distortions in general, around the efficient and inefficient economy, respectively.Footnote 1 We assume income taxes instead of revenue taxes. Income taxes and revenue taxes are different because income taxes do not change the comparative price between products and their intermediate inputs, but revenue taxes do. And so income taxes do not distort the product market, but revenue taxes do.
Because of these differences between income taxes and revenue taxes, we contribute to the literature by showing that real distortions in terms of income taxes have distinct first-order effects on the economy with production networks from those in terms of revenue taxes assumed in the literature. We theoretically characterize one simple enough sufficient statistics for the first-order effect of sectoral income tax reductions on the GDP or the TFP and quantify the effects of the income tax reductions during the COVID-19 pandemic in the USA.
We first characterize the closed-form comparative statics of the macroeconomy where production is organized in networks after one-time income tax reductions. We decompose the comparative static effects into two channels: positive downstream demand channel and negative labor channel, the latter of which is further decomposed into two sub-channels of negative labor demand channel and positive labor supply channel. The positive downstream demand channel states that when income taxes of upstream sectors are cut, downstream sectors produce more because downstream sectors demand more inputs from cheaper upstream sectors. The labor demand channel states that higher labor costs, induced by more labor demand after income tax cuts, dampen sectoral outputs. The labor supply channel states that higher wages, induced by income tax cuts, incentivize households to supply more labor and increase sectoral outputs.
We show that the effect of sectoral income tax reductions on the GDP or the TFP is given by a sufficient statistics: the product of sectoral labor demand elasticity and sectoral Domar weight minus the sectoral labor share in the total labor supply if labor is fixed. The former represents the effect of income tax reductions on the GDP through downstream demand channel, and the latter represents the effect of income tax reductions on the GDP through labor demand channel. If labor is elastic, there is a third labor supply channel. The sufficient statistics for the effect to the GDP should be adjusted by labor supply elasticity.
We find that the sufficient statistics for the first-order effect of sectoral income tax reductions on the total labor income share, or the labor wedge in the literature, is the product of the sectoral demand elasticity of labor and the sectoral Domar weight, different from the sectoral Domar weight itself found by Bigio and La’o (Reference Bigio and La’o2020). This is because Bigio and La’o (Reference Bigio and La’o2020) assume revenue taxes as the general form of real distortions. We show that the form of real distortions as revenue taxes is not general enough, and income taxes as real distortions have distinct effects.
These results hinge on the specialty of income taxes that they change the comparative price between labor input and intermediate goods input but do not change the comparative price between intermediate goods and their intermediate inputs in the production. Thus, income taxes distort the labor market, and the downstream demand channel and the labor demand channel both represent the allocative inefficiency of income taxes as real distortions. However, income taxes do not have allocative effects to the intermediate goods market and do not change the sectoral Domar weights, or the ratios of sectoral nominal output over nominal GDP. Even though these results depend on the C-D production functions and they do not generally hold in the CES economy, this study expands our understanding to the impacts of different types of real distortions in the economy where sectoral substitution is not important or the second-order effect is miniscule.
We apply the multi-sector general equilibrium model with income taxes as real distortions to explore the macroeconomic effects of sectoral income tax reductions during the COVID-19 pandemic in the USA. After the pandemic, all advanced economies carried out various subsidy plans including the USA, which can be considered as income tax reductions. We find that:
-
(1) The income tax reduction in each sector has positive effect to its own sector’s production but negative effect to most of other sectors. This is because the positive downstream effect dominates in the effect to its own sector, but the negative labor demand effect dominates in the effect to most of other sectors;
-
(2) The top three sectors among the largest impacts of sectoral income tax reductions on the GDP are, respectively, “Miscellaneous professional, scientific, and technical services,” “Federal Reserve banks, credit intermediation, and related activities,” and “Administrative and support services,” with 0.0163, 0.0101, and 0.0089% GDP increase. The bottom three sectors among the lowest impacts are, respectively, “Motor vehicle and parts dealers”, “Food and beverage stores”, and “General merchandise stores”, with a tiny marginal increase.
-
(3) Input–output linkages are important to determine the impact of sectoral income tax reductions on the GDP. Without input–output linkages, the direct effects of some sectors’ income tax reductions on the GDP are negative. For these sectors, the indirect/spillover effects are positive.
Literature Review. In the last decade, the literature on macroeconomic effects of microeconomic shocks (Gabaix (Reference Gabaix2011), Acemoglu et al. (Reference Acemoglu, Carvalho, Ozdaglar and Tahbaz-Salehi2012), Baqaee and Farhi (Reference Baqaee and Farhi2019)) are burgeoning. Along the literature on production networks, there is a line of literature on different kinds of distortions in the economy with production networks. Jones (Reference Jones2011a) and (Reference Jones2011b) use a model with production networks and distortions to analyze the role that input–output linkages and complementarities play in the determination of income differences of different countries. Bigio and La’o (Reference Bigio and La’o2020) explore the comparative statics of sectoral taxes, or macroeconomic effects of microeconomic distortions in general, in a model with production networks. Baqaee and Farhi (Reference Baqaee and Farhi2020) decompose the effects of sectoral technology change into technology effect and reallocation effect in an economy with distortions. Though Baqaee and Farhi (Reference Baqaee and Farhi2020) model many types of real distortions including income taxes, they only show the allocative inefficiency with respect to markups which are isomorphic to revenue taxes. We show that income taxes impact the economy through distortions of labor market but not product market. This is generally different from the impacts of revenue taxes. Other related studies in this area include Bartelme and Gorodnichenko (Reference Bartelme and Gorodnichenko2015), Osotimehin and Popov (Reference Osotimehin and Popov2021), Fadinger et al. (Reference Fadinger, Ghiglino and Teteryatnikova2022), and Caliendo et al. (Reference Caliendo, Parro and Tsyvinski2022).
Our paper is also related to macroeconomic impacts of allocative distortions on aggregate productivity. This study is initiated by Hsieh and Klenow (Reference Hsieh and Klenow2009), who study the TFP loss of resource misallocation in a multi-sector economy with real distortions in terms of markups, revenue taxes, and income taxes. They assume there are no input–output linkages in the economy. Our paper generalizes their model with general input–output linkages and show the effects of income tax reductions. Hang et al. (Reference Hang, Krishna and Tang2020) employ a multi-sector Hsieh and Klenow (Reference Hsieh and Klenow2009) economy with input–output linkages and show that the multi-sector economy is isomorphic to the economy without input–output linkages in Hsieh and Klenow (Reference Hsieh and Klenow2009) when the intermediate input taxes are zero. We indicate that this is because the income taxes do not distort the product market in the multi-sector economy with C-D production technology. Wang (Reference Wang2021) also show that intermediate input usage distortions matter in the measurement of the TFP loss. Our paper generally contributes to the literature on the impacts of real distortions on the economy.
The rest of this paper is as follows: Section 2 introduces the model; Section 3 shows the analytical results; Section 4 illustrates the scenarios of the horizontal economy and the vertical economy; Section 5 applies the model to empirically analyze the effect of income tax reductions during the COVID-19 pandemic in the USA; and Section 6 concludes.
2. The model
The model features a general equilibrium with production networks and sectoral real distortions as income taxes. We explore the effects of income tax reductions along the supply chain.
Preferences. The representative household has a typical concave utility function:
 \begin{align*} u\left (C(t),L(t)\right )=\ln C(t)-\frac{L(t)^{1+\frac{1}{\kappa }}}{1+\frac{1}{\kappa }}, \end{align*}
where
 $\kappa$
is the Frisch labor supply elasticity. Households consume final goods
 $C(t)$
, supply labor
 $L(t)$
to the producer with received wage income
 $W(t)L(t)$
, and government transfer of labor income taxes
 $T(t)$
. The budget constraint is
 \begin{align*} P(t)C(t)=W(t)L(t) + T(t), \end{align*}
where
 $P(t)$
is the price of final goods and
 $W(t)$
is the nominal wage. The equilibrium labor supply equation is
 \begin{align} L(t)^{\frac{1}{\kappa }}C(t)=\frac{W(t)}{P(t)}. \end{align}
We follow Acemoglu et al. (Reference Acemoglu, Carvalho, Ozdaglar and Tahbaz-Salehi2012) that final goods consumption
 $C(t)$
is a Cobb–Douglas aggregation of consumption goods of
 $N$
sectors in the economy:
 \begin{align*} \ln C(t)=\sum _{k=1}^{N}\beta _{k}\ln \left [ \frac{C_{k}(t)}{\beta _{k}}\right ],\quad \sum _{k=1}^{N}\beta _{k}=1, \end{align*}
where
 $\beta _k$
is the share of goods from sector
 $k$
in the final goods and
 $C_k(t)$
is the consumption of goods from sector
 $k$
. The budget for the final goods is balanced that
 $P(t)C(t)=\sum _{k=1}^{N} P_k(t)C_k(t)$
. The demand of good
 $k$
is given by:
 \begin{align} P_{k}(t)C_{k}(t)=\beta _{k}P(t)C(t). \end{align}
Technology. Production in the economy is organized in a network with
 $N$
sectors in which each sector produces with labor and intermediate goods from all sectors as inputs. The production function of
 $Q_k(t)$
where
 $k\in [1,\cdots,N]$
is a Cobb–Douglas function:Footnote
2
 \begin{align*} \ln Q_{k}(t)= \ln A_{k}+ \sum _{j=1}^{N}\theta _{kj}\ln \left ( \frac{M_{kj}(t)}{\theta _{kj}}\right ) +\alpha _{k}\ln \left ( \frac{L_{k}(t)}{\alpha _{k}}\right ), \quad \sum _{j=1}^N \theta _{kj} + \alpha _k =1. \end{align*}
 $A_{k}$
is the sectoral productivity of sector
 $k$
.Footnote
3
 $M_{kj}(t)$
is the amount of good
 $j$
used in the production of good
 $k$
at time
 $t$
, and
 $L_k(t)$
is the labor used in the production of good
 $k$
.
 $\theta _{kj}$
and
 $ \alpha _k$
are the demand elasticities in the production of good
 $k$
.
 $\tau _k(t)$
is the wage income tax rate in sector
 $k$
. For each unit of used labor, the producer not only pays wage
 $W(t)$
but also pays
 $\tau _k(t)W(t)$
more to the government as income taxes.Footnote
4
Producers in sector
 $k$
maximize their profits:
 \begin{align*} \max _{M_{kj}(t),L_k(t)}\quad P_k(t) Q_k(t) - \sum _{j=1}^{N} P_j(t) M_{kj}(t) - (1+\tau _k(t))W(t)L_k(t). \end{align*}
The first-order conditions for the intermediate goods producers’ problem are as follows:
 \begin{equation} P_{j}(t)M_{kj}(t)=\theta _{kj}P_{k}(t)Q_{k}(t), \end{equation}
 \begin{equation} W\left ( t\right ) L_{k}(t) =\frac{\alpha _{k}}{1+\tau _{k}\left ( t\right ) }P_{k}(t)Q_{k}(t). \end{equation}
Market-Clearing Conditions. The markets of all sectors are cleared:
 \begin{align*} Q_{k}(t)=C_{k}(t)+\sum _{j=1}^{N}M_{jk}(t), \forall k\in [1,\cdots,N]. \end{align*}
The labor market is cleared:
 \begin{align*} L(t)=\sum _{k=1}^{N}L_{k}(t). \end{align*}
And government runs a balanced budget:
 \begin{align*} T\left ( t\right ) =\sum _{k=1}^{N}\tau _{k}(t)W(t)L_{k}(t). \end{align*}
Tax Reductions. We consider a one-time income tax reductions from the steady state and explore comparative statics of the tax cuts along the supply chains:
 \begin{align*} \ln \left [ 1+\tau _{k}(t)\right ] = \begin{cases} \ln \left [ 1+\tau _{k}\right ] -\ln z_{k}&t\geq 0 \\[4pt] \ln \left [ 1+\tau _{k}\right ]& t\lt 0\end{cases},\quad z_k\gt 1. \end{align*}
If
 $\tau _k=0, \forall k$
, we explore the effects of income tax reductions in the efficient economy.
3. Equilibrium analysis
In this section, we first state the definitions related to production networks and then discuss the comparative statics and the welfare analysis of the one-time wage income tax cuts.
3.1 Definitions
Definition 1.
 $v_k(t)$
is defined as the sales share or Domar weight of sector
 $k$
in the economy.
 $\tilde{\alpha }_k(t)$
is defined as the labor income share in the production of goods
 $k$
.
 $\gamma _k(t)$
is defined as the share of labor used in sector
 $k$
in the total labor supply
 $L(t)$
.
 $\tilde{\Lambda }_L(t)$
is defined as the share of total labor income in the economy.
 \begin{align*} v_k(t) \equiv \frac{P_k(t)Q_k(t)}{P(t)C(t)}, \quad \tilde{\alpha }_k(t)\equiv \frac{W(t) L_k(t)}{P_k(t)Q_k(t)},\quad \gamma _k(t) \equiv \frac{L_k(t)}{L(t)}, \quad \tilde{\Lambda }_L(t)\equiv \frac{W(t)L(t)}{P(t)C(t)}. \end{align*}
Definition 2.
Define input–output matrix
 $\boldsymbol{\Omega}$
(
 $N\times N$
), Leontief inverse
 $\boldsymbol{\Psi}$
(
 $N\times N$
), consumption share vector
 $\boldsymbol{\beta }$
(
 $N\times 1$
), labor income share vector
 $\boldsymbol{\tilde{\alpha }}(t)$
(
 $N\times 1$
) in the production, sales share (Domar weight) vector
 $\boldsymbol{v}(t)$
(
 $N\times 1$
), and sectoral productivity vector
 $\boldsymbol{A}$
(
 $N\times 1$
).
 \begin{align*} \boldsymbol{\Omega} &=\left [ \begin{array}{c@{\quad}c@{\quad}c} \theta _{11} & \ldots & \theta _{1N} \\[4pt] \vdots & \ddots & \vdots \\[4pt] \theta _{N1} & \ldots & \theta _{NN}\end{array}\right ] ; \quad \boldsymbol{\Psi}=\left (\boldsymbol{ I}-\boldsymbol{\Omega}\right ) ^{-1}=\left [ \begin{array}{c@{\quad}c@{\quad}c} \psi _{11} & \ldots & \psi _{1N} \\[4pt] \vdots & \ddots & \vdots \\[4pt] \psi _{N1} & \ldots & \psi _{NN}\end{array}\right ] ; \\[4pt] \boldsymbol{\beta } &=[\beta _1,\cdots,\beta _N];\ \boldsymbol{\tilde{\alpha }}(t)=[\tilde{\alpha }_1(t),\cdots,\tilde{\alpha }_N(t)]; \\[4pt] \boldsymbol{v}(t)&=[v_{1}(t),\cdots,v_{N}(t)];\quad \boldsymbol{A}=[A_1,\cdots, A_N]. \end{align*}
As in the production network literature,
 $\boldsymbol{\Omega}$
represents the input–output linkages between sectors of the economy,
 $\boldsymbol{\Psi}$
is the Leontief inverse matrix, and
 $\boldsymbol{v}(t)$
is the Domar weight vector representing the importance of each sector in the economy. The competitive equilibrium is defined as usual.
Definition 3.
The competitive equilibrium is defined as an allocation
 $(C(t),\boldsymbol{C}(t),\boldsymbol{Q}(t), \\[4pt] L(t), \boldsymbol{L}(t), \boldsymbol{M}(t))$
and a price system
 $(P(t), \boldsymbol{P}(t), W(t))$
such that
-
(1) given the price system, the allocation solves households’ problem;
-
(2) given the price system, the allocation solves producers’ problem;
-
(3) all markets are cleared;
-
(4) the government runs a balanced budget,
where
 \begin{align*} \boldsymbol{C}(t)&=[C_1(t),\cdots,C_N(t)], \boldsymbol{Q}(t)=[Q_1(t),\cdots,Q_N(t)]; \\[4pt] \boldsymbol{L}(t)&=[L_1(t),\cdots,L_N(t)], \boldsymbol{P}(t)=[P_1(t),\cdots,P_N(t)]; \\[4pt] \boldsymbol{M}(t)&=\left [ \begin{array}{c@{\quad}c@{\quad}c} M_{11}(t) & \ldots & M_{1N}(t) \\[4pt] \vdots & \ddots & \vdots \\[4pt] M_{N1}(t) & \ldots & M_{NN}(t)\end{array}\right ] ; \end{align*}
and
 $P(t)$
is normalized to 1.
We use black boldface to represent matrices and vectors. We denote
 $\boldsymbol{X}^0$
and
 $\boldsymbol{X}^1$
to represent steady state vector before and after the tax cuts where
 $\boldsymbol{X}$
can be output
 $\boldsymbol{Q},\boldsymbol{C},\boldsymbol{v}, \widetilde{\Lambda }_L, L$
.
Definition 4.
The TFP
 $A(t)$
is defined by the aggregate production function:
 \begin{align} C(t) = A(t)L(t), \end{align}
where
 $C(t)$
is the final goods consumption or GDP and
 $L(t)$
is the total labor supply in the economy.
As the labor market is distorted by income taxes, the TFP
 $A(t)$
is distorted by income taxes.
3.2 Equilibrium results
We show that the Domar weight
 $\boldsymbol{v}(t)$
, labor income share vector
 $\widetilde{\boldsymbol{\alpha }}(t)$
, total income share
 $\widetilde{\Lambda }_L(t)$
, and sectoral labor share in the labor supply
 $\gamma _k$
are functions of the primitives of the economy with production netowrks in Lemma 1.
Lemma 1.
 $v_k(t)=\sum _{j=1}^N \psi _{jk} \beta _j$
,
 $\tilde{\alpha }_k(t)=\frac{\alpha _k}{1+\tau _k(t)}$
,
 $\widetilde{\Lambda }_{L}(t)=\sum _{k=1}^{N} \tilde{\alpha }_{k}(t) v_{k}$
, and
 $\gamma _k(t)=\frac{\tilde{\alpha }_{k}(t) v_{k}}{\vphantom{{}^{\int}}\widetilde{\Lambda } _{L}(t)}$
.
Check Appendix A to see the proof. After the one-time income tax rate cuts at
 $t=0$
, the sales shares or Domar weights
 $\boldsymbol{v}$
do not change and the labor income shares increase shown in Lemma 2.
Lemma 2.
 $v_k^1-v_k^0=0, \quad \widetilde{\Lambda }_L^1-\widetilde{\Lambda }_L^0\gt 0$
.
Refer to Appendix A to see the proof. This lemma shows that the income tax cuts do not change the sales shares or Domar weights, which is different from the results in Bigio and La’o (Reference Bigio and La’o2020) where real distortions are in the form of revenue taxes. This is because income tax cuts do not change the comparative price between intermediate goods and their intermediate inputs. The total labor income shares
 $\widetilde{\Lambda }(t)$
increase because the wage increases due to higher labor demand after the tax cuts.
Remark 1. Lemma 2 is quite important that drives all the results in the paper. Real distortions of income taxes are actually different from revenue taxes because income taxes do not change the comparative price of goods market and so that’s the reason there are no allocative distortions in the intermediate goods market. The allocative distortions are manifested in the factor market that labor allocations are distorted by income taxes. Actually, misallocation resulted from factor market distortions is the insight illustrated in Hsieh and Klenow (Reference Hsieh and Klenow2009). However, there are no input–output linkages in Hsieh and Klenow (Reference Hsieh and Klenow2009) and they can’t show any sectoral allocative inefficiency in production networks.
We assume elastic labor supply in this model. Actually, elastic labor supply is an important channel to drive the effects of income tax reductions in this paper. We follow Saez (Reference Saez2001) by defining elasticities to solve the labor supply.
Lemma 3. The change of labor supply is given by:
 \begin{align} \ln \frac{L^1}{L^0} = -\frac{\kappa }{1+\kappa } \ln \frac{\widetilde{\Lambda }_{L}^{0}}{\vphantom{{}^{\int}}\widetilde{\Lambda }_{L}^{1}}\gt 0. \end{align}
The wage increases after income taxes are reduced and thus incentivizes households to supply more labor. This lemma is intuitive, and this labor supply channel augments the effects of income tax reductions to the whole economy.
Proposition 1.
The change of steady state output of sector
 $k$
is
 \begin{align*} \Delta _{k} &=\ln \frac{Q_{k}^{1}}{Q_{k}^{0}}=\sum _{j=1}^{N}\psi _{kj}\alpha _{j}\ln z_{j} +\frac{1}{1+\kappa } \ln \frac{\widetilde{\Lambda }_{L}^{0}}{\vphantom{{}^{\int}}\widetilde{\Lambda }_{L}^{1}}, \end{align*}
Or in the matrix form,
 \begin{align*} \boldsymbol{\Delta}&=\ln \boldsymbol{Q}^{1} - \ln \boldsymbol{Q}^{0}=\boldsymbol{\Psi} diag(\boldsymbol{\alpha }) \ln \boldsymbol{z}+ \frac{1}{1+\kappa } \ln \frac{\widetilde{\Lambda }_{L}^{0}}{\vphantom{{}^{\int}}\widetilde{\Lambda }_{L}^{1}}\boldsymbol{1}. \end{align*}
And
 \begin{align*} \ln \frac{\widetilde{\Lambda }_{L}^{0}}{\vphantom{{}^{\int}}\widetilde{\Lambda }_{L}^{1}}= \ln \frac{\sum _{k=1}^{N}\frac{\alpha _{k}v_{k}}{1+\tau _{k}}}{\sum _{k=1}^{N}\frac{\alpha _{k}v_{k}}{1+\tau _{k}}z_k}\lt 0. \end{align*}
The proof is given in Appendix C. This proposition indicates that the income tax reduction in sector
 $k$
influences production of sector
 $k$
through two channels:
-
(1) One channel is through positive downstream demand effect induced by lower comparative price due to tax cuts:
 $\sum _{j=1}^{N}\psi _{kj}\alpha _{j}\ln z_{j}\gt 0$
. When the income tax in sector
$j$
which is the upstream sector or supplier of sector
$k$
is cut by
$\ln z_j$
, the price of intermediate good of sector
$j$
is reduced with an augmentation of labor share
$\alpha _j$
. Sector
$k$
demands more intermediate goods from sector
$j$
and thus produces more, which is amplified by the production network
$\psi _{kj}$
. Obviously, only the downstream sectors are influenced through this channel implied by
$\psi _{kj}$
.
-
(2) The other channel is through negative labor effect
$\frac{1}{1+\kappa }\ln \frac{\widetilde{\Lambda }_{L}^{0}}{\vphantom{{}^{\int}}\widetilde{\Lambda } _{L}^{1}}$
. We further decompose this effect into negative labor demand effect and positive labor supply effect.-
(i) The first sub-channel is called labor demand effect which is negative. The labor cost is higher in the economy induced by more labor demand:
$\ln \frac{\widetilde{\Lambda }_{L}^{0}}{\vphantom{{}^{\int}}\widetilde{\Lambda } _{L}^{1}}\lt 0$
. The wage is higher after the income tax cut because labor demand is higher keeping aggregate labor supply fixed. The total labor income share in the economy is higher after the income tax cut, which reduces the steady state output. -
(ii) The second sub-channel is through positive labor supply effect because labor supply is higher in the economy induced by the higher wage:
$\ln \frac{L^1}{L^0}=-\frac{\kappa }{1+\kappa }\ln \frac{\widetilde{\Lambda }_{L}^{0}}{\vphantom{{}^{\int}}\widetilde{\Lambda } _{L}^{1}}\gt 0$
. The wage is higher after the income tax cut, and households are incentivized to supply more labor and produce more.
The latter two effects are combined to the term
$\frac{1}{1+\kappa }\ln \frac{\widetilde{\Lambda }_{L}^{0}}{\vphantom{{}^{\int}}\widetilde{\Lambda } _{L}^{1}}$
which is negative. When
$\kappa =0$
is 0 or labor supply is fixed, the labor supply effect disappears. When
$\kappa$
goes to infinity or labor supply is fully elastic, the two sub-channels counteract each other. -


Notice that both channels are resulted from the distorting effects on the labor market instead of intermediate goods market. The first effect and the second effect are opposite and the total change of production depends on the magnitude of each one.
We are interested in the scenario when the income taxes of all sectors are cut by the same percentages as this is a probable case in the real world. This scenario is given by Corollary 1.
Corollary 1.
The change of steady state output of sector
 $k$
after homogeneous income tax reductions across all sectors is zero that
 \begin{align*} \Delta _k = \ln \frac{Q_k^1}{Q_k^0} =\frac{\kappa }{1+\kappa }\ln z,\quad if\quad z_k=z,\forall k. \end{align*}
Especially, when labor is inelastic or fixed
 $\kappa =0$
, the change is zero
 $\Delta _k=0$
.
When labor supply is fixed and income tax reductions are the same across sectors, the positive downstream demand effect counteract the negative labor demand effect completely.
Remark 2. This result
 $\Delta =0$
when labor is fixed
 $\kappa =0$
looks astonishing at first glance as this result holds in the vicinity around the inefficient economy when
 $\tau _k\neq 0$
. Distortions have allocative effects around the inefficient point so that the first-order effect is not zero as documented by Baqaee and Farhi (Reference Baqaee and Farhi2020). However, here in the income tax case, there is no allocative effect of distortion change to the product market. From Lemma 2, we can see that the economic structure doesn’t change whether it is in the vicinity of efficient economy or not. The two channels counteract each other when income tax reductions are homogeneous across all sectors and labor supply is fixed. If labor is elastic, the labor supply effect dampens the negative labor demand effect and the change is positive.
Proposition 2. The TFP is given by:
 \begin{align} \ln A(t) = \boldsymbol{v}^T \ln \boldsymbol{A} - \boldsymbol{v}^T diag(\boldsymbol{\alpha })\ln (1+\boldsymbol{\tau }(t)) - \ln \widetilde{\Lambda }_L(t). \end{align}
When there are no income taxes
 $\boldsymbol{\tau }(t)=0$
, the TFP goes to the efficient one that
 $\ln A(t) = \boldsymbol{v}^T \ln \boldsymbol{A}$
. When income taxes are reduced, the TFP is impacted through two channels discussed in Proposition 1: the downstream demand channel and labor demand channel.
Remark 3. Proposition 2 shows similar insight as Hang et al. (Reference Hang, Krishna and Tang2020) who documents the TFP in an economy with production networks is isomorphic to that in a horizontal economy without input–output linkages (called the value-added economy in their paper) when the intermediate input taxes are zero. This result holds because factor taxes do not distort the product market but distort the factor markets. The TFP loss is totally due to allocative effects to the labor market as Domar weights do not change with factor taxes.
Corollary 2. The change of the TFP is given by:
 \begin{align*} \ln A^1 - \ln A^0 = \boldsymbol{v}^T diag(\boldsymbol{\alpha }) \ln \boldsymbol{z}+ \ln \frac{\widetilde{\Lambda }_{L}^{0}}{\vphantom{{}^{\int}}\widetilde{\Lambda }_{L}^{1}} \end{align*}
As final goods consumption
 $C(t)$
is a product of the TFP
 $A(t)$
and labor supply
 $L(t)$
, we can see that the change of the final consumption
 $C(t)$
is the sum of the change of the TFP and labor supply
 $\Delta C(t) = \Delta A(t) + \Delta L(t)$
. Next, we show the effect of the income tax reductions on the GDP or the TFP in Proposition 3.
Proposition 3. The change of GDP in the economy after income tax reductions is given by:
 \begin{align*} \ln C^{1} - \ln C^{0}= \ln A^{1} - \ln A^{0} + \ln L^1 - \ln L^0 =\beta ^T\boldsymbol{\Delta}=\boldsymbol{v}^T diag(\boldsymbol{\alpha }) \ln \boldsymbol{z}+ \frac{1}{1+\kappa }\ln \frac{\widetilde{\Lambda }_{L}^{0}}{\vphantom{{}^{\int}}\widetilde{\Lambda }_{L}^{1}}. \end{align*}
The marginal effect of the income tax reductions in sector
 $k$
on GDP is given by a sufficient statistics
 $\xi _k$
:
 \begin{align*} \frac{d({\ln}\, C^{1} - \ln C^{0})}{d \ln z_k} = \xi _k, \end{align*}
where
 \begin{align*} \xi _k=v_k \alpha _k - \frac{1}{1+\kappa } \gamma _k^0, \quad \gamma _k^0=\frac{L_k^0}{L^0}=\frac{\frac{\alpha _k v_k}{1+\tau _k}}{\sum _{k=1}^N \frac{\alpha _k v_k}{1+\tau _k}}. \end{align*}
Especially, in the efficient economy when
 $\tau _k=0,\forall k$
, we have
 \begin{align*} \xi _k =\frac{\kappa }{1+\kappa }v_k \alpha _k, \end{align*}
and further when labor is inelastic
 $\kappa =0$
in the efficient economy, the sufficient statistics is zero
 $\xi _k=0$
.
The proof of Proposition 3 is obvious and the proof is in Appendix D. The first-order effect of income tax reductions on the GDP is just the sum of these two channels, which is represented by the sufficient statistics
 $v_k\alpha _k-\frac{1}{1+\kappa }\gamma _k^0$
. We can still decompose the sufficient statistics into the two channels mentioned in Proposition 1:
-
(1) The sufficient statistics for the positive downstream demand channel of the effects of income tax reductions on the final goods consumption is just the product of labor demand elasticity in the production function
$\alpha _k$
and the Domar weight
$v_k$
. -
(2) The sufficient statistics for the negative labor channel of the effects of income tax reductions on the GDP is just opposite of the sectoral labor share in the total labor supply before income tax reductions adjusted for the labor supply
$-\frac{1}{1+\kappa }\gamma _k^0$
. This channel can be further decomposed into two sub-channels.-
(i) The sufficient statistics for the negative labor demand channel of the effects of income tax reductions on the GDP is just opposite of the sectoral labor share in the total labor supply before income tax reductions
$-\gamma _k^0$
. -
(ii) The sufficient statistics for the positive labor supply channel of the effects of income tax reductions on the GDP is
$\frac{\kappa }{1+\kappa }\gamma _k^0$
.
-


We can see that when labor supply is inelastic, the second sub-channel in the labor effect disappears and the first-order effect is just
 $v_k \alpha _k - \gamma _k^0$
, which is the product of labor demand elasticity in the production function
 $\alpha _k$
and the Domar weight
 $v_k$
minus the sectoral labor share before income tax reduction
 $\gamma _k^0$
.
The marginal effect of income tax reductions around the efficient economy is
 $\frac{\kappa }{1+\kappa }v_k \alpha _k$
. When labor is inelastic
 $\kappa =0$
, the marginal effect is zero when the two channels counteract each other, which has the same insight as Bigio and La’o (Reference Bigio and La’o2020). This is because the labor effect is equal to
 $-v_k \alpha _k$
in the efficient economy, which is shown in Corollary 3.Footnote
5
Corollary 3.
The first-order effect of the income tax reduction in sector
 $k$
on the labor wedge or total labor income share
 $\widetilde{\Lambda }_L$
is
 $\alpha _k v_k$
in the efficient economy.
Footnote
6
 \begin{align*} \frac{d\left({\ln}\, \widetilde{\Lambda }_L ^{1} - \ln \widetilde{\Lambda }_L ^{0}\right)}{d \ln z_k} =\alpha _k v_k. \end{align*}
The proof of this corollary is embedded in that of Proposition 3. Corollary 3 shows that the sufficient statistics of the first-order effect of income tax reductions on the labor wedge around the efficient economy is the product of labor demand elasticity
 $\alpha _k$
and Domar weight
 $v_k$
. The result is different from that in Bigio and La’o (Reference Bigio and La’o2020) who show that the first-order effect of real distortions in general is the Domar weight
 $v_k$
with revenue taxes.
The difference lies in the setup in their paper that real distortions are represented by revenue taxes. This difference changes the comparative price among produced goods, labor, and intermediate inputs. In their setup, revenue taxes do change the comparative price between intermediate goods and their intermediate inputs. Here in our setup, income taxes do not change the comparative price between intermediate goods and their intermediate inputs, and thus Domar weights do not change with income tax reductions. The reason why
 $\alpha _k$
appears in the sufficient statistics is because real distortions in terms of income taxes exert effects on sectoral output and the GDP only through the labor input in the production and the elasticity of labor demand is
 $\alpha _k$
.
Our result shows that revenue taxes are not general enough to include all the real distortions. The setup in this paper is one example that income taxes have different first-order effects from revenue taxes.
3.3 Direct effect and indirect effect
Production networks act as shock amplifiers in the economy. Sectoral shocks not only affect the sectors that shocks originate but also spill over to other sectors through input–output linkages. We decompose the direct and indirect/spillover effect in this subsection. This decomposition hinges on the Leontief inverse matrix
 $(\boldsymbol{I}-\boldsymbol{\Omega})^{-1}$
, which denotes the total effects of shocks to the economy. The direct effect is represented by the identity matrix
 $\boldsymbol{I}$
and the rest
 $(\boldsymbol{I}-\boldsymbol{\Omega})^{-1}-\boldsymbol{I}$
goes to the spillover effect:
 \begin{align*} (\boldsymbol{I}-\boldsymbol{\Omega})^{-1} = \left (\boldsymbol{I}\right ) + \left ((\boldsymbol{I}-\boldsymbol{\Omega})^{-1}-\boldsymbol{I} \right ). \end{align*}
We decompose the direct effect and indirect/spillover effect in Proposition 4.
Proposition 4.
The direct effect and indirect/spillover effect to sectoral production change
 $\boldsymbol{\Delta}$
, TFP change
 $\ln A^1 - \ln A^0$
, and GDP change
 $\ln C^1 - \ln C^0$
are represented by:
 \begin{align*} \boldsymbol{\Delta}= \boldsymbol{\Delta}_d + \boldsymbol{\Delta}_s, \quad \ln A^1 - \ln A^0=\Delta _d^A + \Delta _s^A, \quad \ln C^1 - \ln C^0=\Delta _d^C + \Delta _s^C, \end{align*}
where
 \begin{align*} \boldsymbol{\Delta}_d & = \boldsymbol{I}\ diag(\boldsymbol{\alpha }) \ln \boldsymbol{z} + \boldsymbol{I}\ diag(\boldsymbol{\alpha }) \boldsymbol{1} \frac{1}{1+\kappa } \ln \frac{\widetilde{\Lambda }_{L}^{0}}{\vphantom{{}^{\int}}\widetilde{\Lambda }_{L}^{1}},\\[4pt] \boldsymbol{\Delta}_s & = \left (\boldsymbol{\Psi}-\boldsymbol{I}\right ) diag(\boldsymbol{\alpha }) \ln \boldsymbol{z} + \left (\boldsymbol{\Psi}-\boldsymbol{I}\right ) diag(\boldsymbol{\alpha }) \boldsymbol{1} \frac{1}{1+\kappa } \ln \frac{\widetilde{\Lambda }_{L}^{0}}{\vphantom{{}^{\int}}\widetilde{\Lambda }_{L}^{1}}, \\[4pt] \Delta _d^A & = \boldsymbol{\beta }^T \boldsymbol{I}\ diag(\boldsymbol{\alpha }) \ln \boldsymbol{z} + \boldsymbol{\beta }^T \boldsymbol{I}\ diag(\boldsymbol{\alpha }) \boldsymbol{1} \ln \frac{\widetilde{\Lambda }_{L}^{0}}{\vphantom{{}^{\int}}\widetilde{\Lambda }_{L}^{1}}, \\[4pt] \Delta _s^A & = \boldsymbol{\beta }^T \left (\boldsymbol{\Psi}-\boldsymbol{I}\right ) diag(\boldsymbol{\alpha }) \ln \boldsymbol{z} + \boldsymbol{\beta }^T \left (\boldsymbol{\Psi}-\boldsymbol{I}\right ) diag(\boldsymbol{\alpha }) \boldsymbol{1} \ln \frac{\widetilde{\Lambda }_{L}^{0}}{\vphantom{{}^{\int}}\widetilde{\Lambda }_{L}^{1}}, \\[4pt] \Delta _d^C & = \boldsymbol{\beta }^T \boldsymbol{I}\ diag(\boldsymbol{\alpha }) \ln \boldsymbol{z} + \boldsymbol{\beta }^T \boldsymbol{I}\ diag(\boldsymbol{\alpha }) \boldsymbol{1} \frac{1}{1+\kappa } \ln \frac{\widetilde{\Lambda }_{L}^{0}}{\vphantom{{}^{\int}}\widetilde{\Lambda }_{L}^{1}}, \\[4pt] \Delta _s^C & = \boldsymbol{\beta }^T \left (\boldsymbol{\Psi}-\boldsymbol{I}\right ) diag(\boldsymbol{\alpha }) \ln \boldsymbol{z} + \boldsymbol{\beta }^T \left (\boldsymbol{\Psi}-\boldsymbol{I}\right ) diag(\boldsymbol{\alpha }) \boldsymbol{1} \frac{1}{1+\kappa } \ln \frac{\widetilde{\Lambda }_{L}^{0}}{\vphantom{{}^{\int}}\widetilde{\Lambda }_{L}^{1}}. \end{align*}
Proof is illustrated in Appendix E. Notice that all direct effects are related to the identity matrix
 $\boldsymbol{I}$
which denotes the self-impacted from the income tax reduction of the same sector. All the indirect effects are related to the matrix
 $\boldsymbol{\Psi}-\boldsymbol{I}=(\boldsymbol{I}-\boldsymbol{\Omega})^{-1}-\boldsymbol{I}$
, which denotes the difference between total effect represented by Leontief matrix
 $(\boldsymbol{I}-\boldsymbol{\Omega})^{-1}$
and direct effect represented by identity matrix
 $\boldsymbol{I}$
.
There are two terms in all the direct effects
 $\boldsymbol{\Delta}_d, \Delta _d^A, \Delta _d^C$
and indirect effects
 $\boldsymbol{\Delta}_s, \Delta _s^A, \Delta _s^C$
. The first term is due to the downstream demand channel, and the second term is due to the labor channel. In the literature of production networks, the division of direct effect and indirect/spillover effect relies on whether there is the spillover through input–output linkages. The downstream demand channel functions absolutely through input–output linkages, so without these linkages the direct effect must be the one to the sector itself.
But the labor channel functions not only through input–output linkages but also through economy-wide labor demand and labor supply. It is because the income tax reduction of any sector results in the economy-wide wage increase even without input–output linkages. Thus, the direct effect of labor channel not only affects the sector itself but also spillovers to other sectors through the wage change. This seems not so “direct,” but this is related to the definition of what we mean by “direct effect.” We still follow the literature of production networks by defining “direct effect” as the effect without input–output linkages. Under this definition, the labor channel of income tax reductions still spill over to other sectors through labor demand and labor supply.
4. Examples
In this section, we discuss two special production networks to show the impacts of different network structures on the effects of sectoral distortion changes on the macroeconomy.
Horizontal economy.
Note: This figure denotes the production organization of the horizontal economy. All sectors employ labor to produce but not intermediate inputs of other sectors. The households or consumers consume final goods directly from all sectors.

4.1 Horizontal economy
Example 1. Horizontal Economy is an economy that production is not organized in a network that each sector employs only labor as inputs and does not employ goods of other sectors as inputs, as depicted in Fig. 1. The production structure of the horizontal economy can be represented by
 $( \boldsymbol{\Omega},\boldsymbol{\Psi},\boldsymbol{\tilde{\alpha }}(t),\boldsymbol{v},\widetilde{\Lambda }_L(t))$
:
 \begin{align*} \boldsymbol{\Omega}&=\left [\begin{array}{c@{\quad}c@{\quad}c} 0 & \cdots & 0 \\[4pt] \vdots & \vdots & 0 \\[4pt] 0 & \cdots & 0 \end{array} \right ], \boldsymbol{\Psi}=\left [\begin{array}{c@{\quad}c@{\quad}c} 1 & \cdots & 0 \\[4pt] \vdots & \vdots & 0 \\[4pt] 0 & \cdots & 1 \end{array} \right ], \\[4pt] \boldsymbol{\alpha }&=[1,\cdots,1],\quad, \boldsymbol{\widetilde{\alpha }}(t) =[1/(1+\tau _1(t)),\cdots,1/(1+\tau _N(t))], \boldsymbol{v}=\boldsymbol{\widetilde{\Psi }}^T \boldsymbol{\beta }= [\beta _1,\cdots,\beta _N], \\[4pt] \widetilde{\Lambda }_L(t) &= \boldsymbol{\widetilde{\alpha }}(t)^T \boldsymbol{v}=\sum _{k=1}^N \frac{ \beta _k}{1+\tau _k(t)}. \end{align*}
After one-time income tax cuts, the change of steady state output of sector
 $k$
is
 \begin{align*} \Delta _{k} &=\ln \frac{Q_{k}^{1}}{Q_{k}^{0}}=\ln z_{k} + \frac{1}{1+\kappa } \ln \frac{\widetilde{\Lambda }_{L}^{0}}{\vphantom{{}^{\int}}\widetilde{\Lambda }_{L}^{1}}, \end{align*}
where
 \begin{align*} \ln \frac{\widetilde{\Lambda }_{L}^{0}}{\vphantom{{}^{\int}}\widetilde{\Lambda }_{L}^{1}}&= \ln \frac{\sum _{k=1}^{N}\frac{\beta _{k}}{1+\tau _{k}}}{\sum _{k=1}^{N}\frac{\beta _{k}}{1+\tau _{k}}z_k}\lt 0. \end{align*}
We can see that the positive downstream demand effect is collapsed to a self-influenced term
 $\ln z_{k}$
and all the network effects are gone due to no input–output structure in the horizontal economy. The production of sector
 $k$
increases due to higher final demands as price is lowered after the tax reduction.
The network effect is also missing in the labor effect or the income share change
 $\ln \frac{\widetilde{\Lambda }_{L}^{0}}{\vphantom{{}^{\int}}\widetilde{\Lambda }_{L}^{1}}$
where the Domar weight
 $v_k$
is no longer determined by a weighted average of consumption shares of all sectors but the consumption share
 $\beta _k$
of itself.
The welfare change of one-time income tax cuts of sector
 $k$
is given by:
 \begin{align*} \ln C^{1} - \ln C^{0}=\sum _{k=1}^N \beta _k \ln z_k + \frac{1}{1+\kappa } \ln \frac{\widetilde{\Lambda }_{L}^{0}}{\vphantom{{}^{\int}}\widetilde{\Lambda }_{L}^{1}}, \end{align*}
where
 \begin{align*} \ln \frac{\widetilde{\Lambda }_{L}^{0}}{\vphantom{{}^{\int}}\widetilde{\Lambda }_{L}^{1}}&= \ln \frac{\sum _{k=1}^{N}\frac{\beta _{k}}{1+\tau _{k}}}{\sum _{k=1}^{N}\frac{\beta _{k}}{1+\tau _{k}}z_k}\lt 0. \end{align*}
Due to the missing network effect, the change of GDP is a weighted average of self-influenced terms
 $\beta _k \ln _k$
of all sectors, where the weight is just the consumption share of each sector, along with the labor demand effect.
The sufficient statistics for the marginal effect of income tax reductions in sector
 $k$
on GDP is given by:
 \begin{align*} \xi _k = \beta _k - \frac{1}{1+\kappa } \gamma _k^0,\quad \gamma _k^0=\frac{L_k^0}{L(t)}=\frac{\frac{ \beta _k}{1+\tau _k}}{\sum _{k=1}^N \frac{ \beta _k}{1+\tau _k}}. \end{align*}
When labor supply is inelastic or
 $\kappa =0$
, we have
 $\xi _k=\beta _k - \gamma _k^0$
. The marginal effect of the income tax reduction of sector
 $k$
on GDP is just the consumption ratio of sector
 $k$
in the final goods minus the labor share of sector
 $k$
.
4.2 Vertical economy
Example 2. Vertical Economy is an economy that production is organized in a vertical network that each sector employs goods of the neighbor sector as inputs and does not employ labor as inputs except sector
 $1$
which only employs labor as its input, as depicted in Fig. 2. The production network structure in the vertical economy can be represented by
 $( \boldsymbol{\Omega}(t),\boldsymbol{L},\boldsymbol{\alpha },\boldsymbol{v},\widetilde{\Lambda }_L(t))$
:
Vertical economy.
Note: This figure denotes the production organization of the vertical economy. Each sector employs goods of the neighbor sector as inputs and does not employ labor as inputs except sector
 $1$
which only employs labor as its input. The household or consumer directly consume the goods of sector
 $N$
.
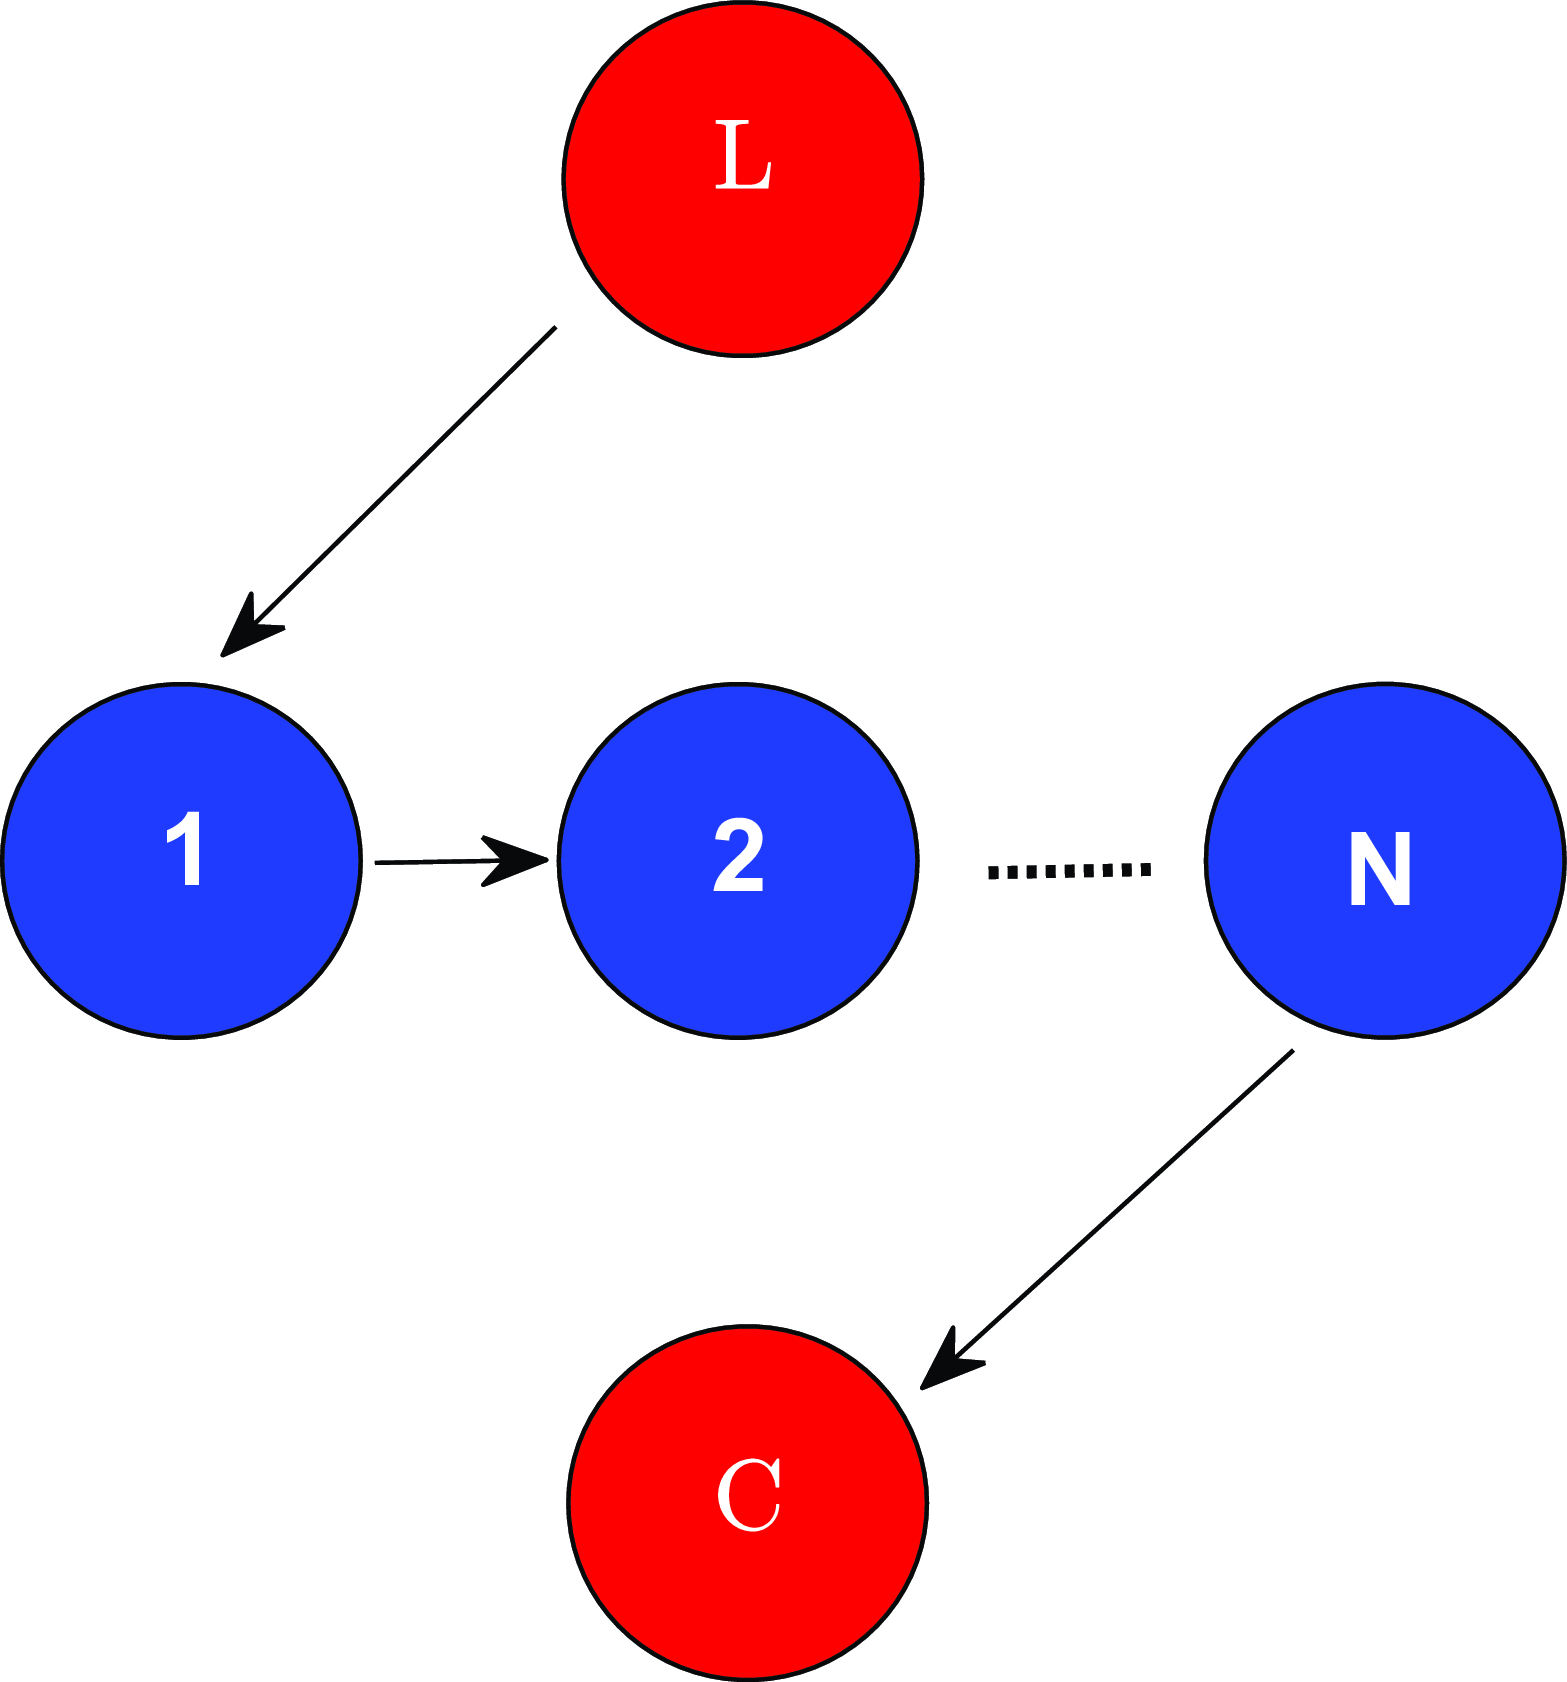
 \begin{align*} \boldsymbol{\Omega}&=\left [\begin{array}{c@{\quad}c@{\quad}c@{\quad}c} 0 & 0 & \cdots & 0 \\[4pt] 1 &0 &\cdots & 0 \\[4pt] \vdots & \cdots &\cdots & \vdots \\[4pt] 0 & \cdots & 1 & 0 \end{array} \right ], \boldsymbol{\Psi}=\left [\begin{array}{c@{\quad}c@{\quad}c@{\quad}c} 1 & 0 & \cdots & 0 \\[4pt] 1 & 1 & \cdots & 0 \\[4pt] 1&\cdots & 1 & 0 \\[4pt] 1&\cdots & 1 &1 \end{array} \right ], \\[4pt] \boldsymbol{\alpha }&=[1,0,\cdots,0],\quad \boldsymbol{\widetilde{\alpha }}(t) =[1/(1+\tau _1(t)), 0, \cdots,0],\quad \boldsymbol{\beta }=[0,\cdots,1],\\[4pt] \boldsymbol{v}&=\boldsymbol{\Psi}^T \boldsymbol{\beta }=[1,\cdots,1],\quad \widetilde{\Lambda }_L(t) = \boldsymbol{\widetilde{\alpha }}(t)^T \boldsymbol{v}=1/(1+\tau _1(t)). \end{align*}
After one-time income tax cuts, the change of steady state output of sector
 $k$
is
 \begin{align*} \Delta _{k} &=\ln \frac{Q_{k}^{1}}{Q_{k}^{0}}=\ln z_{1} + \frac{1}{1+\kappa } \ln \frac{\widetilde{\Lambda }_{L}^{0}}{\vphantom{{}^{\int}}\widetilde{\Lambda }_{L}^{1}}=\frac{\kappa }{1+\kappa }\ln z_{1}, \end{align*}
where
 \begin{align*} \ln \frac{\widetilde{\Lambda }_{L}^{0}}{\vphantom{{}^{\int}}\widetilde{\Lambda }_{L}^{1}}&=- \ln z_1. \end{align*}
When labor supply is inelastic
 $\kappa =0$
, the change of sectoral output is just zero.
From the example of the vertical economy, we can clearly see what each of the two impact channels is. First, only the tax reduction in the first sector matters to the two channels because only this sector hires labor as its input and other sectors only hire upstream intermediate goods as inputs. The tax reduction results the reduction of the price of sector one and transmits to every downstream sector through vertical production networks. Second, the positive downstream demand effect is collapsed to the tax reduction term of the first sector
 $\ln z_1$
transmitted through the production networks. Third, the negative labor demand effect
 $-\ln z_1$
is negative as the first sector demands more labor thus pushes up the wage. Fourth, the labor supply effect
 $\frac{\kappa }{1+\kappa }\ln z_1$
is positive as higher wage induces households to supply more labor and thus sectoral production is higher. Last, the positive downstream demand effect and negative labor demand effect offsets each other in the vertical economy, and it is totally due to the Cobb–Douglas production function in which the elasticity of substitution is just one. That’s why the total effect is equal to the positive labor supply effect.
The welfare change of one-time income tax cuts of sector
 $k$
is given by:
 \begin{align*} \ln C^{1} - \ln C^{0}=\ln z_1 + \frac{1}{1+\kappa } \ln \frac{\widetilde{\Lambda }_{L}^{0}}{\vphantom{{}^{\int}}\widetilde{\Lambda }_{L}^{1}}= \frac{\kappa }{1+\kappa } \ln z_1. \end{align*}
where
 \begin{align*} \ln \frac{\widetilde{\Lambda }_{L}^{0}}{\vphantom{{}^{\int}}\widetilde{\Lambda }_{L}^{1}}&=- \ln z_1. \end{align*}
Especially, when labor is inelastic or
 $\kappa =0$
, we have
 \begin{align*} \ln C^{1} - \ln C^{0}=0. \end{align*}
As only labor supply effect exists in the effect of income tax reductions on sectoral production, the effect on the GDP is also from this sub-channel. The sufficient statistics for the marginal effect of income tax reductions in sector
 $k$
on GDP is given by:
 \begin{align*} \xi _k = \frac{\kappa }{1+\kappa }. \end{align*}
Especially, when labor is inelastic or
 $\kappa =0$
, we have
 \begin{align*} \xi _k=0. \end{align*}
The marginal effect of the income tax reduction of sector
 $k$
on GDP is zero even in the inefficient economy with vertical production networks and inelastic labor supply.
5. Quantitative analysis
In this section, we apply the model illustrated above to quantify the effects of income tax reductions during the COVID-19 pandemic in the USA. We calibrate all the parameters of production networks based on the 2019 input–output table of the USA. We consider the income tax rates of all sectors the same as average income tax rate 13% in 2019.Footnote 7 After the COVID-19 pandemic, the US government releases a series of covid-related tax relief policies. Though the policies have various different details, we can still apply the model with production networks to explore the effects of income tax reductions on specific sectors and the economy as a whole.
We collect the 2019 US summarized input–output use table, which is the year before the covid pandemic, and adjust the use table by:
-
(1) We ignore the following sectors “GFGD”, “GFGN”, “GFE”, “GSLG”, “GSLE”.
-
(2) We ignore the following sectors “GFGD”, “GFGN”, “GFE”, “GSLG”, “Other”, “Used”.Footnote 8
After the deletion, there are 66 sectors in the input–output table so
 $N=66$
, the names of which are listed in Appendix G. We divide each column of this
 $66\times 66$
matrix by “Total industry output” of each sector to compute
 $\boldsymbol{\Omega}'$
.
 $\boldsymbol{\alpha }'$
is obtained by dividing “Compensation of employees” of each sector by "Total industry output." In the model, the production function is constant return to scale in its input labor and intermediate inputs of goods from other sectors. Then we renormalize
 $\boldsymbol{\alpha }, \boldsymbol{\Omega}$
to make sure the parameters of each sector are added to 1.
We add the column “personal consumption expenditure” (F010), “Nonresidential private fixed investment in equipment” (F02E), “Nonresidential private fixed investment in intellectual property product)” (F02N), and “Residential private fixed investment in structures” (F02S) to be the sectoral consumption. Then
 $\boldsymbol{\beta }$
, the consumption share vector, is calculated by the sectoral consumption divided by “Total industry output.” We renormalize
 $\boldsymbol{\beta }$
to make sure the consumption shares of all sectors are added to one. We calibrate the income tax rate as
 $\tau _k=0.13$
for all sectors
 $k\in [1,\cdots,N]$
, which is the average income tax rate of the USA in 2019, the year before the COVID-19 pandemic.
First, we show the impact of income tax reductions of each sector on the sectoral output changes
 $\boldsymbol{\Delta}$
of all sectors illustrated in the heatmap of Fig. 3.Footnote
9
Each entry in the heatmap denotes the output percentage change
 $\Delta _k$
of sector
 $k$
(vertical axis) when the income tax of sector
 $j$
(horizontal axis) is reduced by 1%. Red square denotes positive impact and blue square denotes negative impact. The darker the color, the higher the impact is. We can see that the diagonal line is dark red, which means that the output increases up to the income tax reduction of its own sector. The positive downstream demand effect dominates the negative labor effect. However, most of the off-diagonal entries are blue, which means that the output decreases up to the income tax reduction of other sectors, and the negative labor effect dominates the positive downstream demand effect in the spillover.
Impacts of sectoral income tax reductions of on sectoral outputs
 $\boldsymbol{Q}$
.
Note: Each entry in the heatmap denotes the sectoral output percentage change
 $\Delta _k$
of sector
 $k$
(vertical axis) when the income tax of sector
 $j$
(horizontal axis) is reduced by 1%. Red square denotes positive impact and blue square denotes negative impact. The darker the color, the higher the impact is.

Impacts of sectoral income tax reductions on the GDP
 $C$
.
Note: The number denotes the percentage change of the GDP/welfare
 $C$
when the income tax of each sector is reduced by 1%.

Direct impacts of sectoral income tax reductions on the GDP
 $C$
.
Note: The number denotes the direct percentage change of the GDP/welfare
 $C$
when the income tax of each sector is reduced by 1%.

Indirect/spillover impacts of sectoral income tax reductions on the GDP
 $C$
.
Note: The number denotes the indirect/spillover percentage change of the GDP/welfare
 $C$
when the income tax of each sector is reduced by 1%.

Second, we show a graph of the percentage change of the the GDP/welfare
 $C$
when the income tax of each sector is reduced by 1% in Fig. 4. All the numbers are positive, and the welfare or GDP increases after income tax reductions of any sector is reduced. We also decompose the total effect into direct effect in Figs. 5 and 6.
-
The top three sectors among the largest impacts are, respectively, “Miscellaneous professional, scientific, and technical services,” “Federal Reserve banks, credit intermediation, and related activities,” and “Administrative and support services,” with 0.0163, 0.0101, and 0.0089% GDP increase.
-
The bottom three sectors among the lowest impacts are, respectively, “Motor vehicle and parts dealers,” “Food and beverage stores,” and “General merchandise stores,” with a tiny marginal increase.
-
We can see that some of the direct effects in Fig. 5 are negative and this is because the negative labor channel dominates the positive downstream demand channel. Even in the direct effect without input–output linkages, wage increase due to income tax reduction spills over economy-widely, as we illustrate in Remark 4.
-
As we see from Fig. 5, input–output linkages are so important for the effects of income tax reductions. Without input–output linkages, the welfare of the economy does not necessarily increase after income tax reductions. The negative direct effects are complemented by positive indirect effects so that the total effects are still positive.
6. Conclusion
We analytically characterize the comparative statics of income tax reductions along supply chains in the economy. We contribute to the literature by showing that income taxes have distinct effects from revenue taxes in the production networks. We analytically show that the effect of sectoral income tax reductions on the GDP is given by a sufficient statistics, the product of sectoral labor demand elasticity and sectoral Domar weight minus the sectoral share of the used labor in the total labor supply when labor supply is fixed.
Our results hinge on the Cobb–Douglas production function so that our results omit the second-order effect when the elasticities of substitution between sectors are not one, the point of which is especially illustrated by Baqaee and Farhi (Reference Baqaee and Farhi2019). They show that sectoral shocks have second-order effects due to the change of sectoral Domar weights when the elasticities of substitution between sectors are not one. The impacts of different types of real distortions deserve to be explored in the CES economy when sectoral substitution degree matters more. We leave theses important issues for future research.
Acknowledgements
All errors are our own. We thank Yuhan Yang for his excellent research assistance. Generous help from the Editor, Associate Editor, and two anonymous referees is acknowledged. This paper is a part of the paper previously circulated as “The Dynamic Effects of Income Tax Reductions in Production Networks.” This paper is supported by Joint Project of Research Center of Low Carbon Economy for Guangzhou Region and Guangzhou Social Science Foundation NO. 2022JDGJ12. Chunyang Fu thanks the support provided by special project for the cultivation of major humanities and social sciences projects at the University of Chinese Academy of Social Sciences “Analysis of Platform Economic Impact and Comprehensive Governance-Based on the Perspective of Internet Consumption Big Data” (2022-KYLX01-01). Bin Wang thanks the financial support provided by Jinan University and Fundamental Research Funds for Central Universities (23JNQMX26).
Appendix
A. Proof of Lemmas 1 and 2
From the intermediate goods market-clearing condition of sector
 $k$
, we have
 \begin{align*} \frac{P_{k}(t)Q_{k}(t)}{P(t)C(t)} =\frac{P_{k}(t)C_{k}(t)}{P(t)C(t)}+\sum _{j=1}^{N}\frac{P_{k}(t)M_{jk}(t)}{P(t)C(t)} \end{align*}
Substitute the first-order condition of input use of
 $M_{jk}(t)$
 \begin{align*} \frac{P_{k}(t)Q_{k}(t)}{P(t)C(t)} &=\frac{P_{k}(t)C_{k}(t)}{P(t)C(t)}+\sum _{j=1}^{N}\theta _{jk}\frac{P_{j}(t)Q_{j}(t)}{P(t)C(t)} \end{align*}
Define sales share of sector
 $k$
in the final goods
 $v_k(t)=\frac{P_k(t)Q_k(t)}{P(t)C(t)}$
. We can get the equilibrium sales share of sector
 $k$
:
 \begin{align*} v_{k}(t) =\beta _{k}+\sum _{j=1}^{N}\theta _{jk}v_{j}(t)\Longrightarrow \boldsymbol{v}(t)=\boldsymbol{v}=\left [ \boldsymbol{I}-\boldsymbol{\Omega} ^{T}\right ] ^{-1}\boldsymbol{\beta }=\boldsymbol{\Psi}^T\boldsymbol{\beta } \end{align*}
By the labor demand equation of the intermediate producer and labor market-clearing condition, we get get the share of wage income in the economy:
 \begin{align*} \widetilde{\Lambda }_{L}(t)=\frac{W(t)\sum _{k=1}^N L_k(t)}{P(t)C(t)}=\sum _{k=1}^N \tilde{\alpha }_k(t) \frac{P_k(t)Q_k(t)}{P(t)C(t)}=\sum _{k=1}^{N}\tilde{\alpha } _{k}(t) v_{k}. \end{align*}
Then, we can get
 $\gamma _k(t)$
by
 \begin{align*} \gamma _k(t)=\frac{L_k(t)}{L(t)}=\frac{\frac{W(t)L_k(t)}{P(t)C(t)}}{\frac{W(t) L(t)}{P(t)C(t)}}=\frac{\tilde{\alpha }_k(t) v_k}{\vphantom{{}^{\int}}\widetilde{\Lambda } _{L}(t)}. \end{align*}
Proof of Lemma 1 ends here.
We can see that sales share of sector
 $k$
does not change in the business cycle and is a constant no matter how sectoral technologies and income taxes change. Or
 \begin{align*} v_{k}=\sum _{j=1}^{N}\beta _{j}\psi _{jk} \end{align*}
And
 \begin{align*} v_k^1 - v_k^0=0. \end{align*}
Denote
 $\widetilde{\Lambda }_{L}^0,\widetilde{\Lambda }_{L}^1$
are the wage income share in the total economy before and after the tax cut. Substitute the tax and we have
 \begin{align*} \ln \frac{\widetilde{\Lambda }_{L}^0}{\vphantom{{}^{\int}}\widetilde{\Lambda }_{L}^1}=\ln \frac{\sum _{k=1}^{N}\alpha _{k}\frac{v_{k}}{1+\tau _{k}}}{\sum _{k=1}^{N}\alpha _{k}\frac{v_{k}}{1+\tau _{k}}z_k}\lt 0 \end{align*}
Or
 \begin{align*} \widetilde{\Lambda }_{L}^1 -\widetilde{\Lambda }_{L}^0\gt 0. \end{align*}
The proof ends here.
B. Proof of Lemma 3
From the utility function
 $u\left ( C_{t},L_{t}\right ) =\ln C_{t}-\frac{L_{t}^{1+\frac{1}{\kappa }}}{1+\frac{1}{\kappa }}$
, we have the labor supply condition:
 \begin{align*} \frac{L(t)^{\frac{1}{\kappa }}}{1/C(t)}=\frac{W(t)}{P(t)}. \end{align*}
Or
 \begin{align*} L(t)^{1+\frac{1}{\kappa }}=\frac{W(t)L(t)}{P(t)C(t)}=\tilde{\Lambda }_L(t). \end{align*}
So,
 \begin{align*} d \ln L(t)=\frac{\kappa }{1+\kappa } d\ln \tilde{\Lambda }_L(t). \end{align*}
Then the change of labor supply after income reductions is
 \begin{align*} \ln L^1 - \ln L^0 =- \frac{\kappa }{1+\kappa } \ln \frac{\tilde{\Lambda }_L^0}{\tilde{\Lambda }_L^1}. \end{align*}
Relevance to Saez (Reference Saez2001). A general households’ problem following Saez (Reference Saez2001) is
 \begin{align*} \max &\quad u\left ( C_{t},L_{t}\right ), \\[4pt] s.t.\quad C_{t} & =\frac{W_{t}}{P_{t}}L_{t}+\frac{T_{t}}{P_{t}}. \end{align*}
The FOC is
 \begin{equation*} u_{C}\left ( \frac {W_{t}}{P_{t}}L_{t}+\frac {T_{t}}{P_{t}},L_{t}\right ) \frac {W_{t}}{P_{t}}+u_{L}\left ( \frac {W_{t}}{P_{t}}L_{t}+\frac {T_{t}}{P_{t}},L_{t}\right ) =0\Rightarrow L_{t}=L\left ( \frac {W_{t}}{P_{t}},\frac {T_{t}}{P_{t}}\right ). \end{equation*}
The total differential is
 \begin{align*} d\ln L_{t} & =-\frac{\left [ u_{CC}\left ( C_{t},L_{t}\right ) \frac{W_{t}}{P_{t}}\frac{T_{t}}{P_{t}}+u_{CL}\left ( C_{t},L_{t}\right ) \frac{T_{t}}{P_{t}}\right ] }{\left [ u_{LL}\left ( C_{t},L_{t}\right ) +2u_{CL}\left ( C_{t},L_{t}\right ) \frac{W_{t}}{P_{t}}+u_{CC}\left ( C_{t},L_{t}\right ) \left ( \frac{W_{t}}{P_{t}}\right ) ^{2}\right ] L_{t}}d\ln \frac{T_{t}}{P_{t}.}\\[4pt] & -\frac{\left [ u_{C}\left ( C_{t},L_{t}\right ) \frac{W_{t}}{P_{t}}+u_{CC}\left ( C_{t},L_{t}\right ) \left ( \frac{W_{t}}{P_{t}}\right ) ^{2}L_{t}+u_{CL}\left ( C_{t},L_{t}\right ) \frac{W_{t}}{P_{t}}L_{t}\right ] }{\left [ u_{LL}\left ( C_{t},L_{t}\right ) +2u_{CL}\left ( C_{t},L_{t}\right ) \frac{W_{t}}{P_{t}}+u_{CC}\left ( C_{t},L_{t}\right ) \left ( \frac{W_{t}}{P_{t}}\right ) ^{2}\right ] L_{t}}d\ln \frac{W_{t}}{P_{t}}. \end{align*}
In our utility function,
 \begin{equation*} u\left ( C_{t},L_{t}\right ) =\ln C_{t}-\frac {L_{t}^{1+\frac {1}{\kappa }}}{1+\frac {1}{\kappa }}. \end{equation*}
We have
 \begin{align*} d\ln L_{t} & =\frac{\left [ \frac{W_{t}L_{t}}{P_{t}C_{t}}-\left ( \frac{W_{t}L_{t}}{P_{t}C_{t}}\right ) ^{2}\right ] }{\frac{1}{\kappa }L_{t}^{\frac{1}{\kappa }+1}+\left ( \frac{W_{t}L_{t}}{P_{t}C_{t}}\right ) ^{2}}d\ln \frac{W_{t}}{P_{t}}-\frac{\frac{W_{t}L_{t}}{P_{t}C_{t}}\frac{T_{t}}{P_{t}C_{t}}}{\left [ \frac{1}{\kappa }L_{t}^{\frac{1}{\kappa }+1}+\left ( \frac{W_{t}L_{t}}{P_{t}C_{t}}\right ) ^{2}\right ] }d\ln \frac{T_{t}}{P_{t}}\\[4pt] & =\frac{\frac{W_{t}L_{t}}{P_{t}C_{t}}\left [ 1-\left ( \frac{W_{t}L_{t}}{P_{t}C_{t}}\right ) \right ] }{\frac{1}{\kappa }L_{t}^{\frac{1}{\kappa }+1}+\left ( \frac{W_{t}L_{t}}{P_{t}C_{t}}\right ) ^{2}}d\ln \frac{W_{t}}{P_{t}}-\frac{\frac{W_{t}L_{t}}{P_{t}C_{t}}\frac{T_{t}}{P_{t}C_{t}}}{\left [ \frac{1}{\kappa }L_{t}^{\frac{1}{\kappa }+1}+\left ( \frac{W_{t}L_{t}}{P_{t}C_{t}}\right ) ^{2}\right ] }d\ln \frac{T_{t}}{P_{t}}\\[4pt] & =\frac{\frac{W_{t}L_{t}}{P_{t}C_{t}}\frac{T_{t}}{P_{t}C_{t}}}{\frac{1}{\kappa }L_{t}^{\frac{1}{\kappa }+1}+\left ( \frac{W_{t}L_{t}}{P_{t}C_{t}}\right ) ^{2}}\left [ d\ln \frac{W_{t}}{P_{t}}-d\ln \frac{T_{t}}{P_{t}}\right ]. \end{align*}
From the budget constraint
 $C_{t}=\frac{W_{t}}{P_{t}}L_{t}+\frac{T_{t}}{P_{t}}$
, the total differential is
 \begin{align*} d\ln C_{t} & =\frac{\frac{W_{t}}{P_{t}}L_{t}}{C_{t}}d\ln L_{t}+\frac{\frac{W_{t}}{P_{t}}L_{t}}{C_{t}}d\ln \frac{W_{t}}{P_{t}}+\frac{T_{t}}{P_{t}C_{t}}d\ln \frac{T_{t}}{P_{t}}, \\[4pt] & =\frac{\frac{W_{t}}{P_{t}}L_{t}}{C_{t}}d\ln L_{t}+d\ln \frac{W_{t}}{P_{t}}+\frac{T_{t}}{P_{t}C_{t}}\left [ d\ln \frac{T_{t}}{P_{t}}-d\ln \frac{W_{t}}{P_{t}}\right ] \end{align*}
Rearrange
 \begin{equation*} \left [ d\ln \frac {T_{t}}{P_{t}}-d\ln \frac {W_{t}}{P_{t}}\right ] =-\frac {-\frac {T_{t}}{P_{t}C_{t}}d\ln L_{t}+d\ln \frac {W_{t}L_{t}}{P_{t}C_{t}}}{\frac {T_{t}}{P_{t}C_{t}}}=-\frac {1}{\frac {T_{t}}{P_{t}C_{t}}}d\ln \frac {W_{t}L_{t}}{P_{t}C_{t}}+d\ln L_{t} \end{equation*}
Substitute into above
 \begin{align*} d\ln L_{t} & =\frac{\frac{W_{t}L_{t}}{P_{t}C_{t}}\frac{T_{t}}{P_{t}C_{t}}}{\frac{1}{\kappa }L_{t}^{\frac{1}{\kappa }+1}+\left ( \frac{W_{t}L_{t}}{P_{t}C_{t}}\right ) ^{2}}\left [ d\ln \frac{W_{t}}{P_{t}}-d\ln \frac{T_{t}}{P_{t}}\right ] \\[4pt] & =\frac{\frac{W_{t}L_{t}}{P_{t}C_{t}}}{\frac{1}{\kappa }L_{t}^{\frac{1}{\kappa }+1}+\left ( \frac{W_{t}L_{t}}{P_{t}C_{t}}\right ) ^{2}}d\ln \frac{W_{t}L_{t}}{P_{t}C_{t}}-\frac{\frac{W_{t}L_{t}}{P_{t}C_{t}}\frac{T_{t}}{P_{t}C_{t}}}{\frac{1}{\kappa }L_{t}^{\frac{1}{\kappa }+1}+\left ( \frac{W_{t}L_{t}}{P_{t}C_{t}}\right ) ^{2}}d\ln L_{t} \end{align*}
Substitute
 $\frac{W_{t}L_{t}}{P_{t}C_{t}}=L_{t}^{\frac{1}{\kappa }+1}$
of labor supply condition in our specific problem, and we have
 \begin{align*} d\ln L_{t} & =\frac{\frac{W_{t}L_{t}}{P_{t}C_{t}}}{\frac{1}{\kappa }\frac{W_{t}L_{t}}{P_{t}C_{t}}+\left ( \frac{W_{t}L_{t}}{P_{t}C_{t}}\right ) ^{2}}d\ln \frac{W_{t}L_{t}}{P_{t}C_{t}}-\frac{\frac{W_{t}L_{t}}{P_{t}C_{t}}\frac{T_{t}}{P_{t}C_{t}}}{\frac{1}{\kappa }\frac{W_{t}L_{t}}{P_{t}C_{t}}+\left ( \frac{W_{t}L_{t}}{P_{t}C_{t}}\right ) ^{2}}d\ln L_{t}\\[4pt] & =\frac{1}{\frac{1}{\kappa }+\frac{W_{t}L_{t}}{P_{t}C_{t}}}d\ln \frac{W_{t}L_{t}}{P_{t}C_{t}}-\frac{\frac{T_{t}}{P_{t}C_{t}}}{\frac{1}{\kappa }+\frac{W_{t}L_{t}}{P_{t}C_{t}}}d\ln L_{t} \end{align*}
Rearrange
 \begin{align*} \left [ \frac{\frac{T_{t}}{P_{t}C_{t}}}{\frac{1}{\kappa }+\frac{W_{t}L_{t}}{P_{t}C_{t}}}+1\right ] d\ln L_{t} & =\frac{1}{\frac{1}{\kappa }+\frac{W_{t}L_{t}}{P_{t}C_{t}}}d\ln \frac{W_{t}L_{t}}{P_{t}C_{t}}\Rightarrow \\[4pt] \left [ \frac{\frac{T_{t}}{P_{t}C_{t}}+\frac{1}{\kappa }+\frac{W_{t}L_{t}}{P_{t}C_{t}}}{\frac{1}{\kappa }+\frac{W_{t}L_{t}}{P_{t}C_{t}}}\right ] d\ln L_{t} & =\frac{1}{\frac{1}{\kappa }+\frac{W_{t}L_{t}}{P_{t}C_{t}}}d\ln \frac{W_{t}L_{t}}{P_{t}C_{t}}\Rightarrow \\[4pt] \left [ \frac{\frac{1}{\kappa }+1}{\frac{1}{\kappa }+\frac{W_{t}L_{t}}{P_{t}C_{t}}}\right ] d\ln L_{t} & =\frac{1}{\frac{1}{\kappa }+\frac{W_{t}L_{t}}{P_{t}C_{t}}}d\ln \frac{W_{t}L_{t}}{P_{t}C_{t}}\Rightarrow \\[4pt] d\ln L_{t} & =\frac{\kappa }{1+\kappa }d\ln \frac{W_{t}L_{t}}{P_{t}C_{t}} \end{align*}
And we know that
 $\tilde{\Lambda }_L=\frac{W_{t}L_{t}}{P_{t}C_{t}}$
, so
 \begin{align*} d\ln L_{t} & =\frac{\kappa }{1+\kappa }d\ln \tilde{\Lambda }_L \end{align*}
In the scenario of income tax reductions, we have
 \begin{align*} \ln L^1 - \ln L^0 =- \frac{\kappa }{1+\kappa } \ln \frac{\tilde{\Lambda }_L^0}{\tilde{\Lambda }_L^1}. \end{align*}
C. Proof of Proposition 1 and Corollary 1
Substitute the first-order condition of intermediate input
 $M_{kj}(t)$
:
 \begin{align*} M_{kj}(t)&=\theta _{kj}\frac{P_k(t)Q_k(t)}{P_j(t)}=\theta _{kj}\frac{P_k(t)Q_k(t)}{P(t)C(t)} \frac{1}{\frac{P_j(t)Q_j(t)}{P(t)C(t)}}Q_j(t)=\frac{\theta _{kj}v_{k}}{v_{j}}Q_{j}(t). \end{align*}
From the total income share and labor demand equation of the intermediate producer, we have
 \begin{align*} \frac{L_k(t)}{L(t)}=\frac{\alpha _{k}\frac{v_{k}}{1+\tau _{k}(t)}}{\vphantom{{}^{\int}}\widetilde{\Lambda } _{L}(t)}. \end{align*}
Substitute
 $M_{kj}(t)$
and
 $L_k(t)$
to the production function of the intermediate good producer:
 \begin{align*} \ln Q_k(t) = \left [ \sum _{j=1}^{N}\theta _{kj}\ln \frac{v_k Q_{j}(t)}{v_{j}} \right ] + \alpha _k \ln \left (\frac{L(t)\frac{v_{k}}{1+\tau _{k}(t)}}{\vphantom{{}^{\int}}\widetilde{\Lambda } _{L}(t)}\right ). \end{align*}
Or
 \begin{align*} \ln \left [ \frac{Q_{k}(t)}{v_{k}}\right ] =\left [ \sum _{j=1}^{N}\theta _{kj}\ln \frac{Q_{j}(t)}{v_j}\right ] +\alpha _{k}\ln \left ( \frac{L(t)}{\vphantom{{}^{\int}}\widetilde{\Lambda }_{L}(t)}\right ) -\alpha _{k}\ln \left [ 1+\tau _{k}(t)\right ]. \end{align*}
Vectorize the equation, and we have
 \begin{align*} \ln \left [\frac{\boldsymbol{Q}(t)}{\boldsymbol{v}}\right ]=\ln \left ( \frac{L(t) }{\vphantom{{}^{\int}}\widetilde{\Lambda }_{L}(t)}\right )\mathbf{1} - \boldsymbol{\Psi} diag(\boldsymbol{\alpha }) \ln [1+\boldsymbol{\tau }(t)]. \end{align*}
where we apply
 $\boldsymbol{\Psi}\boldsymbol{\alpha }=\boldsymbol{1}$
,
 $\frac{\boldsymbol{Q}(t)}{\boldsymbol{v}}=[\frac{Q_1(t)}{v_1},\cdots,\frac{Q_N(t)}{v_N}]$
, and
 $diag(\boldsymbol{\alpha })$
is the diagonal matrix where the diagonal is the vector of
 $\boldsymbol{\alpha }$
. Or
 \begin{align*} \ln \left [ \frac{Q_{k}(t)}{v_{k}}\right ] =\ln \left ( \frac{L(t) }{\vphantom{{}^{\int}}\widetilde{\Lambda }_{L}(t)}\right ) -\sum _{j=1}^{N}\psi _{kj}\alpha _{j}\ln \left [ 1+\tau _{j}(t)\right ]. \end{align*}
The production of sector
 $k$
before the tax cut is
 \begin{align*} \ln \left [ \frac{Q_{k}^{0}}{v_{k}}\right ]= \ln \left ( \frac{L^0 }{\vphantom{{}^{\int}}\widetilde{\Lambda }_{L}^0}\right ) -\sum _{j=1}^{N}\psi _{kj}\alpha _{j}\ln \left [ 1+\tau _{j}\right ]. \end{align*}
The production after the tax is
 \begin{align*} \ln \left [ \frac{Q_{k}^{1}}{v_{k}}\right ]= \ln \left ( \frac{L^1 }{\vphantom{{}^{\int}}\widetilde{\Lambda }_{L}^1}\right ) -\sum _{j=1}^{N}\psi _{kj}\alpha _{j}\left ({\ln}\, \left [ 1+\tau _{j}\right ] -\ln z_j\right ). \end{align*}
where
 $\widetilde{\Lambda }_{L}^0,\widetilde{\Lambda }_{L}^1$
are the total labor income share in the total economy before and after the tax cut. Substitute the tax, and we have
 \begin{align*} \ln \frac{\widetilde{\Lambda }_{L}^0}{\vphantom{{}^{\int}}\widetilde{\Lambda }_{L}^1}=\ln \frac{\sum _{k=1}^{N}\alpha _{k}\frac{v_{k}}{1+\tau _{k}}}{\sum _{k=1}^{N}\alpha _{k}\frac{v_{k}}{1+\tau _{k}}z_k}\lt 0. \end{align*}
 $L^0$
and
 $L^1$
are the labor supply before and after the tax cut. Then,
 \begin{align*} \Delta _{k} &=\ln \frac{Q_{k}^{1}}{Q_{k}^{0}}=\sum _{j=1}^{N}\psi _{kj}\alpha _{j}\ln z_{j} + \ln \frac{\widetilde{\Lambda }_{L}^{0}}{\vphantom{{}^{\int}}\widetilde{\Lambda }_{L}^{1}}+\ln \frac{L^1}{L^0}. \end{align*}
Or in the matrix form,
 \begin{align*} \boldsymbol{\Delta}&=\ln \boldsymbol{Q}^{1} - \ln \boldsymbol{Q}^{0}=(\boldsymbol{I}-\boldsymbol{\Omega})^{-1} diag(\boldsymbol{\alpha }) \ln \boldsymbol{z}+ \ln \frac{\widetilde{\Lambda }_{L}^{0}}{\vphantom{{}^{\int}}\widetilde{\Lambda }_{L}^{1}}\boldsymbol{1} + \ln \frac{L^1}{L^0}\boldsymbol{1}. \end{align*}
The proof ends here.
Assume the tax reduction in each sector is
 $\ln z$
. From Proposition 1, the positive downstream demand effect is
 \begin{align*} (\boldsymbol{I}-\boldsymbol{\Omega})^{-1} diag(\boldsymbol{\alpha }) \ln \boldsymbol{z}= (\boldsymbol{I}-\boldsymbol{\Omega})^{-1} diag(\boldsymbol{\alpha }) \boldsymbol{1} \ln{z} = (\boldsymbol{I}-\boldsymbol{\Omega})^{-1} \boldsymbol{\alpha } \ln{z} =\boldsymbol{1} \ln{z}. \end{align*}
The last equality applies the condition
 $(\boldsymbol{I}-\boldsymbol{\Omega})^{-1} \boldsymbol{\alpha } =\boldsymbol{1}$
. The negative labor demand effect is
 \begin{align*} \frac{1}{1+\kappa } \ln \frac{\widetilde{\Lambda }_{L}^{0}}{\vphantom{{}^{\int}}\widetilde{\Lambda }_{L}^{1}}\boldsymbol{1} =- \frac{1}{1+\kappa }\boldsymbol{1} \ln{z}. \end{align*}
The two terms combine to
 $\frac{\kappa }{1+\kappa }\boldsymbol{1} \ln{z}$
.
D. Proof of Proposition 2 and 3
From equation (2) and Domar weight definition, we have
 \begin{align*} C_k(t) = \frac{\beta _k}{v_k}Q_k(t), \quad \ln C_k(t) = \ln \frac{\beta _k}{v_k} + \ln Q_k(t). \end{align*}
And final goods is
 $\ln C(t) = \boldsymbol{\beta }^T \ln \left [ \frac{\boldsymbol{Q}(t)}{\boldsymbol{v}}\right ]$
then
 \begin{align*} \ln C(t) = \boldsymbol{v}^T \ln \boldsymbol{A} - \boldsymbol{v}^T diag(\boldsymbol{\alpha })\ln (1+\boldsymbol{\tau }(t)) - \ln \widetilde{\Lambda }_L(t) + \ln L(t). \end{align*}
We know that
 $\ln C(t) = \ln A(t) + \ln L(t)$
. And
 \begin{align*} \ln A(t) = \boldsymbol{v}^T \ln \boldsymbol{A} - \boldsymbol{v}^T diag(\boldsymbol{\alpha })\ln (1+\boldsymbol{\tau }(t)) - \ln \widetilde{\Lambda }_L(t). \end{align*}
Then,
 \begin{align*} \ln C^{1} - \ln C^{0}=\boldsymbol{v}^T diag(\boldsymbol{\alpha }) \ln \boldsymbol{z}+ \frac{1}{1+\kappa } \ln \frac{\widetilde{\Lambda }_{L}^{0}}{\vphantom{{}^{\int}}\widetilde{\Lambda }_{L}^{1}}. \end{align*}
where we use
 $\boldsymbol{\beta }^T(\boldsymbol{I}-\boldsymbol{\Omega})^{-1} = \boldsymbol{v}^T$
and
 $\boldsymbol{\beta }^T\boldsymbol{1}=1$
. Take derevative w.r.t.
 $\ln z_k$
at the point
 $\boldsymbol{z}=\boldsymbol{1}$
,
 \begin{align*} \frac{d({\ln}\, C^{1} - \ln C^{0})}{d \ln z_k} = v_k \alpha _k- \frac{1}{1+\kappa }\frac{\frac{\alpha _k v_k}{1+\tau _k}}{\sum _{k=1}^N \frac{\alpha _k v_k}{1+\tau _k}}. \end{align*}
When
 $\boldsymbol{\tau }=\boldsymbol{0}$
in the efficient economy,
 \begin{align*} \frac{d({\ln}\, C^{1} - \ln C^{0})}{d \ln z_k} =v_k \alpha _k- \frac{1}{1+\kappa }\frac{\alpha _k v_k}{\sum _{k=1}^N \alpha _k v_k}=v_k \alpha _k-\frac{1}{1+\kappa }v_k \alpha _k=\frac{\kappa }{1+\kappa }v_k \alpha _k. \end{align*}
where we use
 $\sum _{k=1}^N \alpha _k v_k=1$
.
E. Proof of Proposition 4
Rearrachange sectoral production, the TFP and the GDP:
-
We know that the change of sectoral production is
Substitute
\begin{align*} \boldsymbol{\Delta}= \boldsymbol{\Psi} diag(\boldsymbol{\alpha }) \ln \boldsymbol{z} + \boldsymbol{1} \frac{1}{1+\kappa } \ln \frac{\widetilde{\Lambda }_{L}^{0}}{\vphantom{{}^{\int}}\widetilde{\Lambda }_{L}^{1}}, \end{align*}
$\boldsymbol{\Psi}\boldsymbol{\alpha }=\boldsymbol{1}$
and
$\boldsymbol{\alpha }=diag(\boldsymbol{\alpha })\boldsymbol{1}$
. We have
\begin{align*} \boldsymbol{\Delta}= \boldsymbol{\Psi} diag(\boldsymbol{\alpha }) \ln \boldsymbol{z} + \boldsymbol{\Psi}diag(\boldsymbol{\alpha })\boldsymbol{1}\frac{1}{1+\kappa } \ln \frac{\widetilde{\Lambda }_{L}^{0}}{\vphantom{{}^{\int}}\widetilde{\Lambda }_{L}^{1}}, \end{align*}
-
We know that the change of the TFP is
Substitute
\begin{align*} \Delta ^A & = \boldsymbol{v}^T diag(\boldsymbol{\alpha }) \ln \boldsymbol{z} + \ln \frac{\widetilde{\Lambda }_{L}^{0}}{\vphantom{{}^{\int}}\widetilde{\Lambda }_{L}^{1}}, \end{align*}
$\boldsymbol{\beta }^T \boldsymbol{\Psi}=\boldsymbol{v}^T$
,
$\boldsymbol{\beta }^T \boldsymbol{1}=1$
,
$\boldsymbol{\Psi}\boldsymbol{\alpha }=\boldsymbol{1}$
, and
$\boldsymbol{\alpha }= diag(\boldsymbol{\alpha })\boldsymbol{1}$
, and we have
\begin{align*} \Delta ^A & = \boldsymbol{\beta }^T \boldsymbol{\Psi} diag(\boldsymbol{\alpha }) \ln \boldsymbol{z} + \boldsymbol{\beta }^T \boldsymbol{\Psi} diag(\boldsymbol{\alpha })\boldsymbol{1} \ln \frac{\widetilde{\Lambda }_{L}^{0}}{\vphantom{{}^{\int}}\widetilde{\Lambda }_{L}^{1}}, \end{align*}
-
We know that the change of the GDP is
Substitute
\begin{align*} \Delta ^C & = \boldsymbol{v}^T diag(\boldsymbol{\alpha }) \ln \boldsymbol{z} + \frac{1}{1+\kappa } \ln \frac{\widetilde{\Lambda }_{L}^{0}}{\vphantom{{}^{\int}}\widetilde{\Lambda }_{L}^{1}}, \end{align*}
$\boldsymbol{\beta }^T \boldsymbol{\Psi}=\boldsymbol{v}^T$
,
$\boldsymbol{\beta }^T \boldsymbol{1}=1$
,
$\boldsymbol{\Psi}\boldsymbol{\alpha }=\boldsymbol{1}$
, and
$\boldsymbol{\alpha }= diag(\boldsymbol{\alpha })\boldsymbol{1}$
, and we have
\begin{align*} \Delta ^C & = \boldsymbol{\beta }^T \boldsymbol{\Psi} diag(\boldsymbol{\alpha }) \ln \boldsymbol{z} + \boldsymbol{\beta }^T \boldsymbol{\Psi} diag(\boldsymbol{\alpha })\boldsymbol{1} \frac{1}{1+\kappa } \ln \frac{\widetilde{\Lambda }_{L}^{0}}{\vphantom{{}^{\int}}\widetilde{\Lambda }_{L}^{1}}, \end{align*}


Decompose the Liontief inverse matrix
 $\boldsymbol{\Psi}$
onto direct term
 $\boldsymbol{I}$
and indirect term
 $\boldsymbol{\Psi}-\boldsymbol{I}$
, and we have the decomposition in Proposition 4:
 \begin{align*} \boldsymbol{\Delta}_d & = \boldsymbol{I}\ diag(\boldsymbol{\alpha }) \ln \boldsymbol{z} + \boldsymbol{I}\ diag(\boldsymbol{\alpha }) \boldsymbol{1} \frac{1}{1+\kappa } \ln \frac{\widetilde{\Lambda }_{L}^{0}}{\vphantom{{}^{\int}}\widetilde{\Lambda }_{L}^{1}},\\[4pt] \boldsymbol{\Delta}_s & = \left (\boldsymbol{\Psi}-\boldsymbol{I}\right ) diag(\boldsymbol{\alpha }) \ln \boldsymbol{z} + \left (\boldsymbol{\Psi}-\boldsymbol{I}\right ) diag(\boldsymbol{\alpha }) \boldsymbol{1} \frac{1}{1+\kappa } \ln \frac{\widetilde{\Lambda }_{L}^{0}}{\vphantom{{}^{\int}}\widetilde{\Lambda }_{L}^{1}}, \\[4pt] \Delta _d^A & = \boldsymbol{\beta }^T \boldsymbol{I}\ diag(\boldsymbol{\alpha }) \ln \boldsymbol{z} + \boldsymbol{\beta }^T \boldsymbol{I}\ diag(\boldsymbol{\alpha }) \boldsymbol{1} \ln \frac{\widetilde{\Lambda }_{L}^{0}}{\vphantom{{}^{\int}}\widetilde{\Lambda }_{L}^{1}}, \\[4pt] \Delta _s^A & = \boldsymbol{\beta }^T \left (\boldsymbol{\Psi}-\boldsymbol{I}\right ) diag(\boldsymbol{\alpha }) \ln \boldsymbol{z} + \boldsymbol{\beta }^T \left (\boldsymbol{\Psi}-\boldsymbol{I}\right ) diag(\boldsymbol{\alpha }) \boldsymbol{1} \ln \frac{\widetilde{\Lambda }_{L}^{0}}{\vphantom{{}^{\int}}\widetilde{\Lambda }_{L}^{1}}, \\[4pt] \Delta _d^C & = \boldsymbol{\beta }^T \boldsymbol{I}\ diag(\boldsymbol{\alpha }) \ln \boldsymbol{z} + \boldsymbol{\beta }^T \boldsymbol{I}\ diag(\boldsymbol{\alpha }) \boldsymbol{1} \frac{1}{1+\kappa } \ln \frac{\widetilde{\Lambda }_{L}^{0}}{\vphantom{{}^{\int}}\widetilde{\Lambda }_{L}^{1}}, \\[4pt] \Delta _s^C & = \boldsymbol{\beta }^T \left (\boldsymbol{\Psi}-\boldsymbol{I}\right ) diag(\boldsymbol{\alpha }) \ln \boldsymbol{z} + \boldsymbol{\beta }^T \left (\boldsymbol{\Psi}-\boldsymbol{I}\right ) diag(\boldsymbol{\alpha }) \boldsymbol{1} \frac{1}{1+\kappa } \ln \frac{\widetilde{\Lambda }_{L}^{0}}{\vphantom{{}^{\int}}\widetilde{\Lambda }_{L}^{1}}. \end{align*}
F. Discussions
F.1. Efficient Economy
Labor Supply. From Corollary 3, we know that the change of total labor income share
 $\widetilde{\Lambda }_L(t)$
is represented by a sufficient statistics
 $\alpha _k v_k$
. And we know that the change of labor supply is just
 $-\frac{\kappa }{1+\kappa } \ln \frac{\widetilde{\Lambda }_L^0}{\vphantom{{}^{\int}}\widetilde{\Lambda }_L^1}$
,
 \begin{align*} \frac{d\ln L^1-d\ln L^0}{d\ln z_k} = \frac{\kappa }{1+\kappa }\alpha _k v_k. \end{align*}
In the efficient economy, the sufficient statistics for the change of labor supply is
 $\frac{\kappa }{1+\kappa }\alpha _k v_k$
.
Sectoral Production. Still, we know that the change of total labor income share
 $\widetilde{\Lambda }_L(t)$
is represented by a sufficient statistics
 $\alpha _k v_k$
. The sufficient statistics for the change of sectoral output
 $k$
after income tax reduction of sector
 $j$
is represented by:
 \begin{align*} \frac{d\ln Q_k^1-d\ln Q_k^0}{d\ln z_j} = \psi _{kj}\alpha _j - \frac{1}{1+\kappa }\alpha _k v_k. \end{align*}
TFP. The sufficient statistics for the change of TFP after income tax reduction of sector
 $k$
is represented by:
 \begin{align*} \frac{d\ln A^1-d\ln A^0}{d\ln z_k} = v_k \alpha _k - \alpha _k v_k=0. \end{align*}
This is given in Corollary 2.
GDP. The sufficient statistics for the change of TFP after income tax reduction of sector
 $k$
is represented by:
 \begin{align*} \frac{d\ln C^1-d\ln C^0}{d\ln z_k} = v_k \alpha _k -\frac{1}{1+\kappa } \alpha _k v_k=\frac{\kappa }{1+\kappa } \alpha _k v_k. \end{align*}
This is given in Proposition 3.
F.2. Homogeneous Income Tax Reductions
Labor Supply. When income tax reductions are homogeneous that
 $\ln z_k = \ln z, \forall k$
, we have
 $\ln \frac{\widetilde{\Lambda }_{L}^{0}}{\vphantom{{}^{\int}}\widetilde{\Lambda }_{L}^{1}}=-\ln z$
, and then
 \begin{align*} \ln \frac{L^1}{L^0}=\frac{\kappa }{1+\kappa }\ln z\gt 0. \end{align*}
Sectoral Production. The change of sectoral production
 $k$
is given by:
 \begin{align*} \Delta _k = \ln \frac{Q_k^1}{Q_k^0}= \left (\sum _{j=1}^N \psi _{kj}\alpha _j - \frac{1}{1+\kappa }\right ) \ln z. \end{align*}
TFP. The change of TFP is given by:
 \begin{align*} \ln A^1 - \ln A^0 = \left (v_k \alpha _k - 1\right ) \ln z. \end{align*}
GDP. The change of GDP or welfare is given by:
 \begin{align*} \ln C^1 - \ln C^0 = \left (v_k \alpha _k - \frac{1}{1+\kappa }\right ) \ln z. \end{align*}
G. Sectors