Introduction
Salinity, one of the main factors limiting plant productivity, affects nearly 20% of the world's cultivated area and half of the world's irrigated lands (Bohnert et al., Reference Bohnert, Nelson and Jensen1995). In Tunisia nearly 1.5 million hectares, corresponding to nearly 10% of the total area of the country and about 30% of cultivated lands, are affected by this stress (Hachicha et al., Reference Hachicha, Job and Mtimet1994; Hachicha, Reference Hachicha2007). Alfalfa (Medicago sativa L.) is the most cultivated forage legume in Tunisia and in the world, being an important fodder plant due to its high nutritive value and growth potential. Its cultivation requires irrigation, which may be provided by salt-laden water (Boughanmi et al., Reference Boughanmi, Michonneau, Daghfous and Fleurat-Lessard2005). However, germination and seedling establishment of this species, which are considered as being the most vulnerable stages of plant development (Rajjou et al., Reference Rajjou, Duval, Gallardo, Catusse, Bally, Job and Job2012), are highly sensitive to salt stress (Peel et al., Reference Peel, Waldron, Jensen, Chatterton, Horton and Dudley2004). The production of high-vigour, salt-tolerant alfalfa seeds is therefore an important agronomic objective. Unfortunately, in alfalfa the most salt-tolerant species might not be the most productive or desirable (Peel et al., Reference Peel, Waldron, Jensen, Chatterton, Horton and Dudley2004), and therefore alternative strategies should be considered. One way to address this question is to develop seed technologies aimed at invigorating low-vigour seedlots; for example, by conditioning of seeds in osmotics. During osmopriming, seeds are exposed to an external water potential that is low enough to prevent germination but allows some pre-germinative physiological and biochemical processes to take place (Heydecker and Coolbear, Reference Heydecker and Coolbear1977; Bradford, Reference Bradford1986; Ashraf and Foolad, Reference Ashraf and Foolad2005). For storage purpose, a drying of the treated seeds following this controlled hydration is permitted because imbibed seeds generally remain desiccation tolerant up to radicle emergence (Boudet et al., Reference Boudet, Buitink, Hoekstra, Rogniaux, Larré, Satour and Leprince2006). In this way, osmoprimed alfalfa seeds were shown to display better performance than untreated seeds under salinity stress (Amooaghaie, Reference Amooaghaie2011; Yacoubi et al., Reference Yacoubi, Job, Belghazi, Chaibi and Job2011).
Despite the wide use of these invigoration treatments, their optimization currently rests on carrying out germination assays, and the mechanisms underlying the improvement in seed vigour are largely unknown. To fill this gap, in recent work we used proteomics to analyse protein patterns from untreated control and osmoprimed alfalfa seeds, both in their respective dry seed state and during germination in optimal conditions. The results unveiled the unexpected finding that osmopriming cannot simply be viewed as an advance of germination-related processes but involves other mechanisms such as the mounting of defence mechanisms, enabling osmoprimed seeds to surmount environmental stresses potentially occurring during germination (Yacoubi et al., Reference Yacoubi, Job, Belghazi, Chaibi and Job2011). In the present work we extend this previous proteomic analysis to characterize the impact of salinity stress on untreated control and osmoprimed alfalfa seed germination. The data disclosed proteomic signatures allowing a better understanding of how osmopriming effectively enabled the invigorated seeds to surmount the deleterious effects of the salinity stress.
Materials and methods
Plant material and germination experiments
Alfalfa seeds (cv. Gabès) were used in all experiments. Osmoprimed seeds were prepared as described (Yacoubi et al., Reference Yacoubi, Job, Belghazi, Chaibi and Job2011) by incubating dry mature seeds in a − 1.0 MPa polyethylene glycol (PEG 8000) solution (290 g l− 1) for 24 h at 25°C under dark conditions. Then seeds were briefly rinsed in distilled water and dried back to their original moisture level (10%) at 20°C. Germination assays were carried out at 25°C, in covered plastic boxes where seeds (100 seeds per box; three replicates for each condition) were placed on three sheets of absorbent paper wetted with 6 ml of NaCl solution (10 g l− 1). A seed was regarded as germinated when the radicle protruded through the seed coat. The Seed Calculator software (Plant Research International B.V., Wageningen, The Netherlands) was used to estimate the germination parameters.
Preparation of protein extracts
Total water-soluble protein extracts (albumins) were prepared as described (Yacoubi et al., Reference Yacoubi, Job, Belghazi, Chaibi and Job2011) from seeds collected by the end of germination sensu stricto, namely at imbibition time T 1 corresponding to achievement of 1% germination with the various seed samples. Following grinding of seeds (100 mg) using a mortar and pestle in liquid nitrogen, albumins were extracted at 4°C in 8.0 ml of water containing the protease inhibitor cocktail ‘complete Mini’ from Roche Diagnostics (Meylan, France), 64 U DNase I (Roche Diagnostics) and 8 U RNase A (Sigma, Lyon, France). After 10 min at 4°C, 20 mM dithiothreitol was added and the protein extracts were stirred for 20 min at 4°C then centrifuged (15,000 g for 15 min at 4°C). Final supernatants corresponded to the soluble albumin extracts. Protein concentrations were measured using bovine serum albumin as a standard (Bradford, Reference Bradford1976).
Two-dimensional polyacrylamide gel electrophoresis, protein staining and gel analyses
Two-dimensional polyacrylamide gel electrophoresis (2D-PAGE) analyses were carried out as described (Yacoubi et al., Reference Yacoubi, Job, Belghazi, Chaibi and Job2011), using protein samples corresponding to about 100 μg of protein. For each condition analysed, 2D gels were made in triplicate and from two independent protein extractions. Following protein staining with silver nitrate, image analysis of the scanned 2D gels was carried out with the Image Master 2D Elite software (Amersham Biosciences, Orsay, France) (Yacoubi et al., Reference Yacoubi, Job, Belghazi, Chaibi and Job2011). Only spots with an average standardized abundance that varied by a minimum of 20% (P≤ 0.05; Student's t-test) were considered as varying spots.
In-gel digestion, mass spectrometry and database searching
Silver-stained protein spots of interest were excised from 2D-PAGE gels, treated with trypsin, and peptide fragments were analysed by tandem mass spectrometry (MSMS) and identified as described previously (Yacoubi et al., Reference Yacoubi, Job, Belghazi, Chaibi and Job2011). MSMS raw data were processed (smooth 3/2 Savitzky Golay and no deisotoping) using the ProteinLynx Global Server 2.05 software (Waters; http://waters.com/waters/nav.htm?cid=10008600&locale=fr_FR) and peak lists were exported in the micromass pkl format. Peak lists of precursor and fragment ions were matched automatically to both proteins in the Medicago truncatula genome assembly MT3 (release 3, www.medicago.org; 53,423 sequences, 12,992,982 residues) and TIGR M. truncatula and M. sativa transcript assemblies (TA) (357,600 sequences; 78,133,384 residues) (ftp://ftp.tigr.org/pub/data/plantta/), using a local Mascot version 2.3 program (Matrix Science, London, http://www.matrixscience.com). If no match was obtained, a final search in the National Center for Biotechnology Information (NCBI) non-redundant protein databank (NCBInr 20101115, taxonomy viridiplantae, 844,562 sequences) was completed. Mascot searches were performed with the following parameters: trypsin specificity, two missed cleavages, variable carbamidomethyl cysteine and oxidation of methionine, 0.2 Da mass tolerance on both precursor and fragment ions, and the possibility to pick the 13C2 peak for precursor ion mass ( ≠ 13C = 2). To validate protein identification, only matches with individual ion scores above 47, 55 and 60 (for the Medicago MT3 database, TIGR TA database and NCBI viridiplantae database, respectively), a threshold value corresponding to P< 0.005 and calculated by the Mascot algorithm with our databases were considered. Moreover, among the positive matches, only protein identifications based on at least three different peptide sequences of more than six amino acids with an individual ion score above 20 were accepted. These additional validation criteria are a good compromise to limit the number of false-positive matches without missing real proteins of interest (Waanders et al., Reference Waanders, Chwalek, Monetti, Kumar, Lammert and Mann2009).
Results
Seed samples
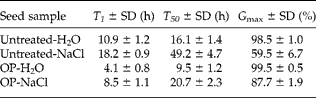
Alfalfa seeds were very sensitive to salinity stress, exhibiting T 1 and T 50 values that correspond, respectively, to the imbibition time at which 1% and 50% of seeds germinated, of 18 h and 49 h, as compared to 11 h and 16 h of the untreated control seeds germinated on water, and a final germination percentage (G max) of only 59% as compared to 98% for the untreated control seeds germinated on water (Table 1). In contrast, osmoprimed seeds submitted to the same salinity stress showed a T 1 of 8 h and a T 50 of 21 h together with a G max of 88%, indicating that osmopriming (see Materials and methods) entailed increased seed vigour (Yacoubi et al., Reference Yacoubi, Job, Belghazi, Chaibi and Job2011) (Table 1).
Germination parameters for the untreated control seeds and the osmoprimed alfalfa seeds imbibed on water or on NaCl. Germination in water of untreated control (Untreated-H2O) and osmoprimed (OP-H2O) alfalfa seeds was conducted as described in Materials and methods at a temperature of 25°C. Germination experiments were also conducted in the presence of NaCl with the untreated control (Untreated-NaCl) and the osmoprimed alfalfa seeds (OP-NaCl). The data correspond to germination experiments conducted in triplicate (3×100 seeds). T 1 and T 50 correspond respectively to the times to reach 1% and 50% of germination following imbibition. G max corresponds to the maximal germination percentage in the different conditions. These parameters were calculated with the Seed Calculator software as indicated in Materials and methods

Proteomics analyses and comparison of seed proteins samples
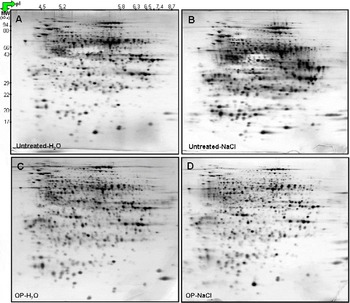
Soluble protein extracts corresponding to the albumin fraction prepared from the untreated control and osmoprimed seeds collected at their respective imbibition time T 1 following germination under salt conditions were analysed by 2D-PAGE (Fig. 1). The results were compared to those previously obtained from untreated control and osmoprimed alfalfa seeds imbibed (T 1) on water (Yacoubi et al., Reference Yacoubi, Job, Belghazi, Chaibi and Job2011; Fig. 1). This comparison should allow us to decipher whether the osmopriming treatment entails modifications in the seed proteome that are correlated with the observed improvement in seed vigour (Table 1).
Influence of seed vigour on the soluble proteome of alfalfa seeds submitted to a salinity stress during imbibition. Silver-stained 2D-gel profiles of water-soluble albumin proteins from untreated control seeds imbibed on water (A) or NaCl (B) and from osmoprimed seeds imbibed on water (C) or NaCl (D). Seed samples were collected at their respective T 1 imbibition time values, T 1 being the time to reach 1% germination (see Table 1). An equal amount (100 μg) of the albumin protein extracts were loaded in each gel. MW, molecular weight (kDa); pI, isoelectric point.

The 2D-gels obtained from the four seed samples, untreated control seeds imbibed in the presence of water, untreated control seeds imbibed in the presence of NaCl, osmoprimed seeds imbibed in the presence of water, and osmoprimed seeds imbibed in the presence of NaCl, disclosed very similar protein patterns. However, statistical image analyses revealed protein spots whose volume varied, considering a variation in spot volume of at least 1.2 (up and down) and P< 0.05. There were 110 and 115 spots fulfilling these two criteria for the imbibed untreated control and osmoprimed seeds in the presence or absence of NaCl, respectively (see Tables S1 and S2, available online). Proteins from varying spots were identified by liquid chromatography coupled to tandem mass spectrometry (LC-MS-MS) analyses (see Tables S1 and S2, available online) and from alfalfa seed proteome reference maps reported previously (Yacoubi et al., Reference Yacoubi, Job, Belghazi, Chaibi and Job2011). This new analysis led to the identification of 44 new proteins from alfalfa seeds (see Tables S1 and S2, available online). For the untreated control seeds (110 spots), two of them contained four proteins, three contained three proteins, 11 contained two proteins and 94 contained a single protein, for a total of 133 proteins (see Table S1, available online). For the osmoprimed seeds (115 spots), two of them contained four proteins, three contained three proteins, 12 contained two proteins and 98 contained a single protein, for a total of 139 proteins (see Table S2, available online). Spots with protein mixtures were excluded since it was not possible to determine which of the proteins were changing in abundance in response to the salinity stress. A further comparative analysis of the 2D-gels showed that 94 varying spots containing a unique protein were common for the imbibed untreated control and osmoprimed seeds in the presence or absence of NaCl (see Tables S1 and S2; Fig. S1, available online).
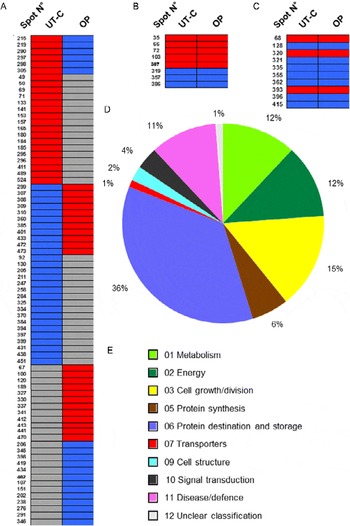
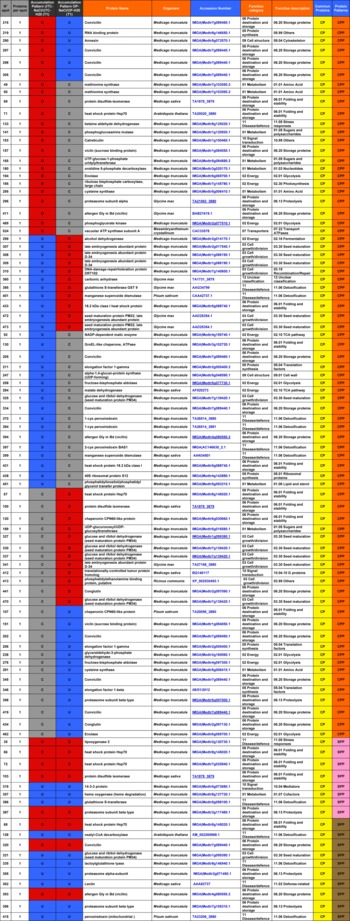
That osmopriming reversed the proteomic changes observed with the untreated control seeds that were imbibed under salinity conditions is further supported by the results in Fig. 2. Thus, among the 94 common varying proteins present in unique spots, a number of them representing 76 proteins (81% of total) showed contrasting accumulation behaviour (e.g. up- versus down-, constant versus up- or constant- versus down-regulation) when comparing the untreated control and osmoprimed seeds (Fig. 2; compare Tables S1 and S2, available online; Table 2). Furthermore, out of the remaining 18 spots (19%) showing similar patterns of accumulation (e.g. up- versus up- or down- versus down-regulation) when comparing the untreated control and osmoprimed seeds imbibed in the presence or absence of NaCl, eight of them (spot nos 35, 66, 72, 103, 319, 357, 386 and 387) showed accumulation ratios differing by a factor of at least 1.5 when comparing the two protein lists (Table 2, Tables S1 and S2, available online). Thus, out of the 94 varying unique spots common to the two protein lists, in total 84 (76+8) spots (89% of total) exhibited contrasting accumulation behaviour when comparing the untreated control and osmoprimed seeds (Table 2, Tables S1 and S2, available online).
Schematic representation of the accumulation patterns of varying proteins during imbibition of untreated control (UT-C) or osmoprimed (OP) alfalfa seeds submitted to a salt stress. Blue, up-regulation; red, down-regulation; grey, constant accumulation. The figure shows 76 unique proteins showing contrasted accumulation patterns (A), eight proteins showing similar patterns of accumulation, yet differing by at least a factor 1.5 (B), and ten proteins showing strictly similar accumulation patterns (C). Pie chart of the 84 (76+8) proteins showing contrasting patterns of accumulation divided into functional categories (D). Functional categories (E). See Table 2 for further details on the function of the proteins. Spot N°, spot number (see Fig. S1 and Tables S1 and S2, available online); UT-C, untreated control seeds imbibed on NaCl or on water; OP, osmoprimed seeds imbibed on NaCl or on water) (a colour version of this figure can be found online at http://www.journals.cambridge.org/ssr).

List of common proteins between the two protein sets presented in Tables S1 and S2 (available online). Protein accumulation patterns are depicted by the colour code used in Fig. 2. Blue, up-accumulated proteins; red, down-accumulated proteins; grey, constant proteins. Legend: N° spot: spot number. Proteins per spot: number of identifications per spot. Protein name; Organism: protein name and organism in which the protein has been identified. Pattern UTC-NaCl/UTC-H20 (T1): protein accumulation patterns from alfalfa untreated control seeds imbibed in the presence of NaCl (UTC-NaCl) compared to alfalfa untreated control seeds imbibed on water (UTC-H20); seeds were collected at their respective T 1 values, corresponding to the time to reach 1% germination; U, up-accumulated proteins; D, down-accumulated proteins; C, constant proteins (see Table S1, available online). Pattern OP-NaCl/OP-H20 (T 1): protein accumulation patterns from alfalfa osmoprimed seeds imbibed in the presence of NaCl (OP-NaCl) compared to alfalfa osmoprimed seeds imbibed on water (OP-H20); seeds were collected at their respective T 1 values, corresponding to the time to reach 1% germination; U, up-accumulated proteins; D, down-accumulated proteins; C, constant proteins (see Table S2, available online). Accession number: accession number from MT3, TIGR TA or NCBI databases. Function category and Function description: functional categories defined according to the ontological classification of Bevan et al. (Reference Bevan, Bancroft, Bent, Love, Goodman, Dean, Bergkamp, Dirkse, Van Staveren and Stiekema1998). Common proteins: proteins from varying single protein spots commonly present in the two protein lists shown in Tables S1 and S2, available online; the volumes of the spots corresponding to these proteins varied upon imbibition of both UTC and OP seeds in NaCl compared to water. Protein accumulation patterns: SPP, similar protein accumulation patterns (brown), including eight proteins (pink; spot nos 35, 66, 72, 103, 319, 357, 386 and 387) showing ratios of normalized volumes differing by a factor of at least 1.5 in the untreated control and osmoprimed seed samples (see Tables S1 and S2, available online); CPP, contrasted accumulation protein patterns (orange) (a colour version of this table can be found online at http://www.journals.cambridge.org/ssr)
 |
Functional classes of evidenced proteins
According to the functional classes of Bevan et al. (Reference Bevan, Bancroft, Bent, Love, Goodman, Dean, Bergkamp, Dirkse, Van Staveren and Stiekema1998), the most represented functional groups for these 84 proteins were ‘Protein destination and storage’ (30 proteins; 36%) such as seed storage proteins (spot nos 297, 298, 305, 334, 345, 411 and 419) and small heat-shock proteins (HSPs) (spot nos 431 and 433); ‘Cell growth/Division’ (13 proteins; 15%) such as late embryogenesis abundant (LEA) proteins (spot nos 307, 308, 309 and 341) and seed maturation proteins (SMPs) (spot nos 472, 473, 321, 325, 327, 330, 337 and 470); ‘Metabolism’ (10 proteins; 12%) such as methionine synthase (spot nos 49 and 50), cysteine synthase (spot nos 291 and 295) and haem oxygenase (spot no. 357); ‘Energy’ (10 proteins; 12%), and ‘Disease and defence’ (9 proteins; 11%) such as glutathione S-transferase (spot no. 385). Also among evidenced proteins, there were proteins related to ‘Cell structure’ such as annexin (spot no. 290) and proteins related to ‘Protein synthesis’ such as RNA binding protein (spot no. 219) (see Tables S1 and S2, available online; Fig. 2).
Discussion
In accordance with previous studies (Amooaghaie, Reference Amooaghaie2011; Yacoubi et al., Reference Yacoubi, Job, Belghazi, Chaibi and Job2011), an osmopriming treatment of alfalfa seeds increased their vigour substantially, especially in salt stress conditions. Moreover, in our previous study, we established proteomic reference maps for the dry mature alfalfa seeds, as well as for the untreated control and osmoprimed seeds during germination on water and harvested at the same stage after sowing, namely at imbibition time T 1, at which 1% of the seeds have germinated and that provides a good estimate of the achievement of germination sensu stricto (Yacoubi et al., Reference Yacoubi, Job, Belghazi, Chaibi and Job2011). Based on these previous findings, the objective of the current work was twofold: (1) characterize the proteome of the untreated control seeds subjected to salt stress during imbibition; and (2) test the hypothesis that the osmopriming treatment could reverse the proteome changes observed with the untreated control seeds during imbibition in salt stress conditions. If this were the case, proteins showing contrasting levels of accumulation with the untreated control and osmoprimed seeds would provide potential markers of germination vigour. To this end, and using the data previously reported for proteins whose accumulation varied during imbibition (T 1) of untreated control and osmoprimed seeds in water (Yacoubi et al., Reference Yacoubi, Job, Belghazi, Chaibi and Job2011), we presently compared the four following germinated (T 1) seed samples: i) the untreated control seeds imbibed on NaCl or on water and ii) the two corresponding osmoprimed seed samples. By this approach, we observed that 94 proteins could characterize the response of both the untreated control and osmoprimed seeds to salt stress (Fig. 2; Table 2). Remarkably, a large number of them (84 proteins, 89%) displayed contrasting levels of accumulation in untreated control and osmoprimed seeds (Fig. 2; Table 2). This indicates that numerous changes observed in the proteome of untreated control seeds imbibed in the presence of salt and presumably accounting for the loss in seed vigour associated with salinity stress, could be substantially reversed in osmoprimed seeds undergoing the same salt stress. Since the osmoprimed seeds displayed higher germination vigour in salinity conditions, it seems reasonable to propose that these proteins showing contrasting accumulations in both types of untreated control and osmoprimed seeds are potential markers of seed vigour in alfalfa, notably under salt stress conditions. Below we discuss the role of some of these proteins in seed vigour.
Several spots assigned to alfalfa seed storage proteins corresponded to proteolytic fragments of the native proteins (spot nos 297, 298, 305, 334, 345, 411 and 419; Table S2, available online). Since seed storage proteins are used as energy and nitrogen resources during seedling growth, the increased accumulation of storage protein fragments in osmoprimed seeds but not in untreated control seeds most presumably reflects an increased initiation of seed storage mobilization during early germination of the osmoprimed seeds under salinity stress. In agreement with this, the initial mobilization of seed storage proteins during early germination is considered as a vigour marker in other species, such as soybean (Alam et al., Reference Alam, Sharmin, Kim, Kim, Lee, Bahk and Lee2011), sugarbeet (Job et al., Reference Job, Kersulec, Ravasio, Chareyre, Pépin and Job1997; Catusse et al., Reference Catusse, Meinhard, Job, Strub, Fischer, Pestsova, Westhoff, Van Dorsselaer and Job2011) and Arabidopsis (Gallardo et al., Reference Gallardo, Job, Groot, Puype, Demol, Vandekerckhove and Job2001).
The small HSPs are molecular chaperones that are abundant in mature dry seeds and disappear during germination (Wehmeyer and Vierling, Reference Wehmeyer and Vierling2000). Here, two small HSPs (spot nos 431 and 433) were evidenced showing increased accumulation behaviour (3 times) during germination of the untreated control seeds under NaCl stress (Table S1, available online). This accumulation suggests a defect in the assembly and correct folding of proteins during this stress. This pattern of accumulation was reversed during imbibition of the osmoprimed seeds under salinity stress (supplementary Table S2). Thus the osmopriming treatment allowed overcoming of the stress defect encountered by the seeds germinated in salinity conditions. Small HSPs are also considered as seed vigour markers in sugarbeet (Catusse et al., Reference Catusse, Meinhard, Job, Strub, Fischer, Pestsova, Westhoff, Van Dorsselaer and Job2011), M. truncatula (Boudet et al., Reference Boudet, Buitink, Hoekstra, Rogniaux, Larré, Satour and Leprince2006) and Arabidopsis (Gallardo et al., Reference Gallardo, Job, Groot, Puype, Demol, Vandekerckhove and Job2001).
Methionine is essential in all organisms as a building block of proteins and as a component of the universal activated methyl donor S-adenosylmethionine (AdoMet). Recycling of the homocysteinyl moiety and regeneration of Met, a set of reactions designated as the activated methyl cycle, accompany utilization of the methyl group of AdoMet in transmethylation reactions (Ravanel et al., Reference Ravanel, Gakière, Job and Douce1998). Furthermore, in plants AdoMet is the precursor for ethylene, polyamine and biotin biosyntheses (Ravanel et al., Reference Ravanel, Gakière, Job and Douce1998). Previous work documented the role of the methyl cycle in Arabidopsis seed germination, as inferred notably by the fact that germination was strongly delayed in the presence of dl-propargylglycine, a specific inhibitor of Met synthesis (Gallardo et al., Reference Gallardo, Job, Groot, Puype, Demol, Vandekerckhove and Job2002). In this context, it is therefore interesting to observe the decreased accumulation of two spots containing Met synthase (spot nos 49 and 50), the enzyme responsible for Met synthesis in plants, during imbibition of the untreated control seeds in the presence of NaCl (Table S1, available online). This decreased accumulation most presumably accounts for the decreased seed vigour observed under salinity conditions, as it would mimic the Met biosyntheis inhibitor dl-propargylglycine. It is noted that this decrease was not observed when comparing the osmoprimed seeds imbibed under salinity or control (water) conditions, which paralleled an increased seed vigour afforded by the osmopriming treatment. Cysteine synthase is also involved in the methyl cycle, as Cys is a precursor for Met biosynthesis (Ravanel et al., Reference Ravanel, Gakière, Job and Douce1998). Cys also serves as a precursor for the synthesis of glutathione, a major antioxidant (Noctor and Foyer, Reference Noctor and Foyer1998). The present study disclosed two Cys synthase containing spots (spot nos 291 and 295), exhibiting similar patterns of accumulation as Met synthase containing spots (spot nos 49 and 50) when comparing the untreated control and osmoprimed alfalfa seeds germinated in salinity conditions (compare Tables S1 and S2, available online; Table 2). Altogether, these observations confirm the importance of the sulphur amino acid biosynthesis pathways in seed vigour, in agreement with results reported for sugarbeet (Catusse et al., Reference Catusse, Meinhard, Job, Strub, Fischer, Pestsova, Westhoff, Van Dorsselaer and Job2011) and Arabidopsis (Rajjou et al., Reference Rajjou, Lovigny, Groot, Belghazi, Job and Job2008, Reference Rajjou, Duval, Gallardo, Catusse, Bally, Job and Job2012).
Several water stress-related proteins were also identified, collectively referred to as late embryogenesis abundant (LEA) proteins. These proteins accumulate late during embryogenesis, coincident with acquisition of desiccation tolerance of the developing seeds, and disappear during germination. They are presumed to be involved in binding or replacement of water, in sequestering ions that will accumulate under dehydration conditions, or in maintaining protein and membrane structure (Dure, Reference Dure1993). Furthermore, expression of the barley HVAI LEA protein gene confers tolerance to salt stress in transgenic rice (Xu et al., Reference Xu, Duan, Wang, Hong, Ho and Wu1996). Four LEA protein spots (spot nos 307, 308, 309 and 341) were strongly accumulated in the untreated control seeds submitted to the salinity stress (Table S1, available online), presumably in response to the dehydration and ionic stresses imposed by NaCl during germination. This increased accumulation was abolished in the osmoprimed seeds challenged by the NaCl stress (Table S2, available online; Table 2), supporting the finding that LEA proteins constitute seed vigour markers in alfalfa, as proposed for soybean (Cheng et al., Reference Cheng, Gao, Li, Shi, Javeed, Jing, Yang and He2010), beech (Kalemba and Pukacka, Reference Kalemba and Pukacka2008) and sugarbeet (Catusse et al., Reference Catusse, Meinhard, Job, Strub, Fischer, Pestsova, Westhoff, Van Dorsselaer and Job2011).
Another group of proteins strongly accumulating during late seed maturation corresponds to the group of seed maturation proteins (SMPs). Some of them would play similar roles as the LEA proteins during seed development (Hundertmark and Hincha, Reference Hundertmark and Hincha2008), but this might not be the case for all SMPs. Two spots containing the PM22 SMP (spot nos 472 and 473) were identified (Tables S1 and S2, available online). This protein exhibits considerable sequence homology with the drought-induced soybean protein desiccation protectant protein LEA14 homologue (Maitra and Cushman, Reference Maitra and Cushman1994). Therefore, it is not surprising to observe that the alfalfa PM22 spots displayed accumulation patterns identical to those for the above-discussed LEA protein spots. Thus these two PM22 spots were up-regulated during imbibition of the untreated control seeds submitted to salinity stress whereas they were down-regulated during imbibition of the osmoprimed seeds submitted to the same stress (compare Tables S1 and S2, available online; Table 2), thereby supporting a role of PM22 in alfalfa seed vigour. Another SMP detected in the present study corresponds to the short-chain dehydrogenase glucose and ribitol dehydrogenase (spot nos 321, 325, 327, 330, 337 and 470), an enzyme that catalyses the oxidation of d-glucose using NAD (nicotinamide adenine dinucleotide) as co-substrate (Jörnvall et al., Reference Jörnvall, von Bahr-Lindström, Jany, Ulmer and Fröschle1984; Alexander et al., Reference Alexander, Alamilla, Salamini and Bartels1994). Most spots containing this enzyme (spot nos 325, 327, 330, 337 and 470) showed contrasting accumulation behaviour when comparing the untreated control and osmoprimed seeds imbibed under salinity conditions (compare Tables S1 and S2, available online; Table 2). Interestingly, barley lines tolerant to saline stress during germination express a higher level of glucose and ribitol dehydrogenase compared to less-tolerant lines (Witzel et al., Reference Witzel, Weidner, Surabhi, Varshney, Kunze, Buck-Sorlin, Börner and Mock2010). Also, this protein was proposed to correspond to a potential seed vigour marker in sugarbeet (Catusse et al., Reference Catusse, Meinhard, Job, Strub, Fischer, Pestsova, Westhoff, Van Dorsselaer and Job2011). Altogether, these observations are in favour of a role of this enzyme in seed vigour.
Annexins are multifunctional proteins characterized by their capacity to bind calcium ions and negatively charged lipids. Transgenic Arabidopsis seeds ectopically expressing a sacred lotus (Nelumbo nucifera) annexin exhibited improved resistance to accelerated ageing treatment used for assessing seed vigour (Chu et al., Reference Chu, Chen, Zhou, Li, Ding, Jiang, Tsang, Wu and Huang2012). Also, the expression of most of the Arabidopsis annexin genes is differentially regulated by exposure to salt, drought, and high- and low-temperature conditions, indicating a likely role for members of this gene family in stress responses (Cantero et al., Reference Cantero, Barthakur, Bushart, Chou, Morgan, Fernandez, Clark and Roux2006; Huh et al., Reference Huh, Noh, Kim, Jeon, Bae, Hu, Kwak and Park2010). In agreement, proteomic analyses revealed differential accumulation of an annexin isoform (AnnAt1) during Arabidopsis germination and early seedling growth in response to salinity stress (Lee et al., Reference Lee, Lee, Yang, Lee, Park, Song and Park2004). Consistent with the finding that annexins could represent a potential seed vigour marker, an annexin was identified in alfalfa seeds in the present study (spot no. 290), which displayed decreased accumulation (2.6-fold) and increased accumulation (1.7-fold) in untreated control and osmoprimed seeds, respectively (compare supplementary Tables S1 and S2; Table 2).
Among the proteins exhibiting contrasting accumulation behaviour when comparing the untreated control and osmoprimed seeds submitted to salinity stress, spot no. 385 was identified as glutathione S-transferase (GST) 9. During imbibition under salt stress the accumulation level of this GST increased by 2.6-fold for the untreated control seeds and decreased by 1.5-fold for the osmoprimed seeds (compare supplementary Tables S1 and S2; Table 2). GSTs have been suggested to be responsible for tolerance to various stresses, such as cold, salt and drought, by detoxification of xenobiotic compounds and reactive oxygen species. Thus manipulation of GST levels in transgenic plants was shown to improve seed germination and seedling growth under salt stress (Roxas et al., Reference Roxas, Lodhi, Garrett, Mahan and Allen2000). Consistent with our observations, GST9 was also identified by proteomics as a potential seed vigour marker in soybean cultivars exhibiting different sensitivities towards salinity stress (X.Y. Xu et al., Reference Xu, Fan, Zheng, Li and Yu2011).
A haem oxygenase (spot no. 357) was identified in the present study, whose accumulation level increased sharply (5.7-fold) for the untreated control seeds imbibed in the presence of NaCl, while its accumulation level increased much more weakly (1.4-fold) for the osmoprimed seeds imbibed under same stress conditions (compare Tables S1 and S2, available online). Haem oxygenase catalyses the oxidative conversion of haem to biliverdin with a concomitant release of carbon monoxide (CO) and free iron (Fe2+) (Otterbein et al., Reference Otterbein, Soares, Yamashita and Bach2003). Recent results revealed that CO plays an important role in a number of physiological processes, such as growth and developmental regulation, stomatal closure and adaptation responses to environmental stresses (Liu et al., Reference Liu, Xu, Ling, Xu and Shen2010). In addition, CO behaves as an important positive regulator of seed germination, since the application of haematin as an exogenous haem oxygenase inducer and a CO aqueous solution alleviated the inhibition of rice seed germination and seedling growth encountered under salt stress, both of which were partially due to the induction of antioxidant metabolism as well as the degradation of storage reserve (Liu et al., Reference Liu, Xu, Xuan, Ling, Cao, Huang, Sun, Fang, Liu, Zhao and Shen2007). Similarly, pre-soaking with haemin, another haem oxygenase-1 inducer, proved to improve salinity tolerance during wheat seed germination (S. Xu et al., Reference Xu, Lou, Zhao, Gao, Dong, Jiang, Shen, Huang and Wang2011). Therefore the observed increase in haem oxygenase in the present study, with the untreated control seeds imbibed in the presence of NaCl (Table S1, available online), can be viewed as a defence response of the alfalfa seeds to counteract the negative effects of the salinity stress (Table 1). In turn, the much lower increase in this enzyme level observed with the osmoprimed seeds imbibed in the presence of NaCl (Table S2, available online) is an indication of the increased seed vigour afforded by the osmopriming treatment (Table 1).
A protein called RNA binding protein (spot no. 219) was also detected in the current study whose level of accumulation strongly increased (tenfold) in osmoprimed seeds during imbibition in salt stress conditions, and severely decreased (2.3-fold) during imbibition of the untreated control seed subjected to the same stress (compare Tables S1 and S2, available online; Table 2). RNA-binding proteins appear to govern many aspects of RNA metabolism, including pre-mRNA processing, transport, stability/decay and translation, and are emerging as a novel class of proteins involved in a wide range of post-transcriptional regulatory events that are important in providing plants with the ability to respond rapidly to changes in environmental conditions (Lorkovic, Reference Lorkovic2009; Ambrosone et al., Reference Ambrosone, Costa, Leone and Grillo2012). Our present results are in good agreement with this finding.
Conclusion
In conclusion, seed priming has long been known to enable seeds to overcome biotic and abiotic stresses (Soeda et al., Reference Soeda, Konings, Vorst, van Houwelingen, Stoopen, Maliepaard, Kodde, Bino, Groot and van der Geest2005). The present proteomic study contributes to the understanding of osmopriming physiology, and its association with post-priming salinity stress tolerance during germination. Some of the presently identified proteins had previously been shown to play a role in salt stress tolerance in several plant species, a finding that underlines the robustness of such protein markers and the usefulness of proteomics to unravelling them. This concerned small HSPs, water stress-related proteins such as the LEA proteins or the detoxification enzyme glutathione S-transferase. Besides, the present approach also revealed new proteins associated with salinity stress in alfalfa (e.g. a haem oxygenase or an RNA binding protein). Future studies will be directed toward the function of the identified proteins in the salt response.
Supplementary material
To view supplementary material for this article, please visit http://dx.doi.org/10.1017/S0960258513000093
Acknowledgements
We are grateful to Françoise Corbineau and Christophe Bailly (University Pierre & Marie Curie, Paris, France) for helpful discussions.