

1. Introduction
Just when it seemed that momentum was gathering in favour of the view that exchange rate regimes in recent years have been gravitating towards the fixed or floating ‘corner’ solutions (e.g. Fischer Reference Fischer2001), critics began to question the so-called bipolar view. Calvo and Reinhart (Reference Calvo and Reinhart2002) brought attention to the ‘fear of floating’ phenomenon by suggesting that the rhetoric of the pure float does not match the reality of exchange rate regime choices. They find that many countries actively manage their exchange rates. Therefore, countries which announce their intention to adopt a floating exchange rate do not actually abstain altogether from intervening in foreign exchange markets because they fear the economic consequences of large currency swings. Levy-Yeyati and Sturzenegger (Reference Levy-Yeyati and Sturzenegger2007) suggest that Calvo and Reinhart's explanation really amounts to a fear of depreciations. Exchange rate depreciations are thought to be associated with negative economic consequences stemming from exchange rate pass-through effects, as well as an increase in the likelihood that a financial crisis can erupt as a consequence. Instead, policymakers are prompted to intervene in foreign exchange markets because they worry that an appreciation of the currency damages the export sector and, as a result, reduces economic growth.
Canada, which arguably has the longest track record in the world for adhering to a floating exchange rate regime, may perhaps best be characterized as an early example of a country that experienced a ‘fear of appreciation’ during the 1951–7 period investigated in this study. Hence, rather than the pure float that has usually been used to describe exchange rate policy in Canada during the 1950s (e.g. see Powell Reference Powell1999), the Bank of Canada actually operated a managed float. The episode in question took place during the tumultuous decade of the 1950s when Canada began to rely on an interest rate instrument, weathered a severe crisis in monetary policy over inflation and how best to control it (Siklos Reference Siklos2008), only to re-enter the Bretton Woods arrangement it helped create in the early 1960s (Muirhead Reference Muirhead1999), following another exchange rate crisis, and the resignation of the governor of the Bank of Canada.
In spite of criticisms levelled at the Canadian government's decision to float the dollar in 1950 (see Helleiner Reference Helleiner2006, p. 83), a remarkable feature of exchange rate behaviour during the 1951–7 period is the relative stability of the nominal exchange rate. This turn of events is all the more notable in view of the seemingly large shocks that hit the Canadian economy from the Korean War and a series of recessions, among other significant economic events that mark this era in Canadian economic history. Bordo, Dib and Schembri (Reference Bordo, Dib and Schembri2007), to my knowledge, is the only recent econometric study of Canada's experience with the float during the 1950s. The authors point out that the exchange rate remained perhaps ‘too stable’. Bordo et al. examine the macroeconomic response to various fiscal and monetary shocks, but they assume that the float was of the pure variety. Archival evidence, to be described below, suggests that the Bank of Canada intervened in foreign exchange markets, at least during the 1951–7 period. Moreover, it is empirically demonstrated that interventions were effective not only in preventing further appreciations in the Canadian currency but also served to limit the volatility of the exchange rate vis-à-vis the US dollar. Previously, studies of Canada's experience with the float during the 1950s relied on official foreign exchange reserves holdings. To my knowledge, this article is the first to also use actual intervention data in the spot market to revisit behaviour of the Canadian dollar during the 1950s.
The rest of the article is organized as follows. In the following section I provide a brief historical background of macroeconomic policies during the 1950–62 era and a summary of the thinking inside the Bank of Canada about the implications of a float. A brief literature review of retrospective studies of the 1950s flexible exchange rate period published mainly during the late 1960s and early 1970s is considered in Section 3. Section 4 describes the available data, including the foreign exchange intervention series, and provides some econometric evidence supportive of the managed floating hypothesis. Section 5 concludes.
2. The 1950s: a tumultuous decade
The dozen or so years beginning with the 1950s were eventful to say the least. The decade began with the Korean War in 1950, which effectively lasted until the middle of 1953. The beginning of the 1950s also brought about a boom in the resource sector that was described by Smith and Slater (Reference Smith and Slater1961) as ‘extraordinary’ and which lasted until 1957. ‘[A]bnormally large capital inflow(s)’ (Smith and Slater Reference Smith and Slater1961, p. 2) ensued, with consequences for imports, which rose, while exports remained sluggish. The loan conversion programme of 1958 wherein short-term Victory Loan bonds, used to finance of expenditures associated with World War II, were exchanged for longer-term government bonds (Bank of Canada 1959) is also a significant event. In addition, there were two recessions between 1952 and 1959. Lastly, the period covered in this study also consists of the last few years of Graham Towers’ term as the first governor of the Bank of Canada, while the years 1955–61 are notable as James Coyne was governor of the Bank until he resigned in 1961.Footnote 1
Turning to the exchange rate, shortly after the end of World War II, in July 1946, the Canadian dollar was revalued to parity against the US dollar, ostensibly to reduce inflationary pressures (Wonnacott Reference Wonnacott1960). This situation was not sustainable as, almost immediately, foreign exchange reserves began to fall rapidly. By 1949, the Canadian dollar was devalued to its wartime value of around 1.08 CAD to the US dollar (or 0.92 US cents to the Canadian dollar).Footnote 2 Until 14 December 1951, when exchange controls were lifted, the Foreign Exchange Control Board (FECB) was the institution charged with maintaining exchange rate stability. The Bank of Canada was heavily involved in the day-to-day operations of the FECB. Gibbons (Reference Gibbons1953) provides an extensive description of the operations of the FECB. Paralleling the FECB was an ‘unofficial’ market for Canadian dollars in New York, where non-residents could also trade in the currency (also see Avison Reference Avison1940).
The decision to float in 1950 was announced as a temporary or transitional measure, both to reassure the public and because several key policymakers, including Graham Towers, governor of the Bank of Canada at the time, and Louis Rasminsky, who would also eventually head the central bank during the 1960s, were advocates of the Bretton Woods international monetary order (e.g. see Helleiner Reference Helleiner2006, chapter 3). Helleiner (Reference Helleiner2006, pp. 75–91) provides a convincing account of the politics of the move to a float. He argues that the float was part of an attempt to ‘depoliticize’ the exchange rate (Helleiner Reference Helleiner2006, p. 84), while senior officials, including Rasminsky, felt it was both politically as well as administratively impractical to maintain foreign exchange or capital controls.Footnote 3 This stands in sharp contrast with the situation in Europe at the time where capital controls were still in place. As stated in the original press release, dated 30 September 1950, announcing the float:
Fluctuations in the basic rate will no doubt occur from time to time in accordance with changing conditions of supply and demand. After a short transitional period it is expected that reasonably stable conditions will develop in the exchange market. (Rasminsky Reference Rasminsky1952–5)Footnote 4
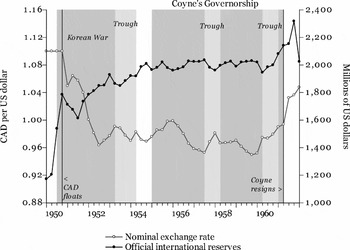
Figure 1 helps set the stage for the analysis to follow. The left-hand-side scale plots the nominal exchange rate, defined here as CAD cents per US dollar, from the first quarter of 1949 until the second quarter of 1962, while the right-hand-side scale shows the available data for the level of official international reserves. The available data suggest a negative relationship between movements in the nominal exchange rate and levels in international reserves. This apparent correlation is more consistent with a managed float rather than a pure float. Intervention data are discussed later.
Nominal exchange rates and international reserves, 1950–62

In a letter to then governor, Graham Towers, dated 2 October 1950, the minister of finance, D. C. Abbott, authorized intervention to bring the ‘premium’ down to at least 3 per cent. In advising the governor, the minister wrote: ‘you must use your judgment as to the timing and extent of such sales’ (Abbott Reference Abbott1950).Footnote 5 Bank officials clearly recognized that, in the absence of capital controls and a floating exchange, US and Canadian interest rates would be linked via current and expected exchange rate changes.Footnote 6
The period after 1957 marks a dramatic change in the Bank of Canada's monetary policy. The Bank begins to tighten monetary policy even in what, in retrospect, appears to be a recession. This leads to an appreciation of the dollar, followed by a depreciation, as monetary policy eventually begins to loosen. The result also shows up as a sharp depreciation of the dollar until Canada goes back to the pegged exchange rate at 1.08 CAD to the US dollar (or 92.5 US cents to the Canadian dollar) in May 1962 (not shown in Figure 1). ‘There seems to be general agreement that removal of the premium on the Canadian dollar would be desirable . . .’ (Coyne Reference Coyne1961, JEC 94–7, vol. 1, p. 1). This suggests that, beginning around 1958, market forces were generating an exchange rate that was deemed more acceptable in the opinion of the Bank (and the government). Indeed, it is only by early 1962 that ‘the decision was made to support the Canadian dollar . . .’ (ibid., p. 253) According to the available archival evidence, the Bank of Canada does not appear to actively intervene in the foreign exchange market after 1957 until shortly before Canada returns to the Bretton Woods fold. This is also confirmed by a confidential memo, dated 2 June 1961 and, presumably, written by Coyne that suggests government inaction on several fronts, including exchange rate policy.Footnote 7 Indeed, the period 1958–61 is one of intense controversy with accusations, in both the academic literature and in the press, of Bank of Canada incompetence, inappropriate government meddling in the affairs of monetary policy, or both. Siklos (Reference Siklos2008, also see references therein), Bordo et al. (Reference Bordo, Dib and Schembri2007) and Helleiner (Reference Helleiner2006) revisit this era in Canadian economic history and there is some consensus that the years 1958–62 are significantly different from the years that preceded this period.Footnote 8
What is unclear is the extent to which the Bank understood the distinction between sterilized and non-sterilized interventions. Cornell (Reference Cornell1951–5, pp. 3–4), for example, suggests potential difficulties in achieving complete sterilization even though the Bank resorted to changes in the primary reserve requirement for the banking system, as well as introducing a secondary reserve requirement forcing the banks to hold short-term Treasury bills. There is no explicit discussion of the sterilization question in any archival documents examined, nor in any of the Bank of Canada's Annual Reports.
3. Exchange rate policy and foreign exchange market intervention in Canada
3.1. The Bank of Canada's view
How did the Bank of Canada interpret exchange rate policy and, in particular, the concept of a floating exchange rate? As early as 1949 the Bank was contemplating life without exchange controls and a floating exchange rate.Footnote 9 Indeed, Coyne (Reference Coyne1949, LR 76–115-13–1), then deputy-governor, wrote a secret memo outlining how a flexible exchange rate might insulate the Canadian economy from the impact of, say, a US recession.Footnote 10 He goes on to point out that, unlike a fixed exchange rate system, a devaluation is announced by policymakers. Setting aside the political dimension of such a decision, an aspect considered by Coyne but not explored in any detail, he also adds that: ‘It will be very difficult, however, for the authorities in charge of a fixed rate to recognize the appropriate time for such a move’ (Coyne Reference Coyne1949, LR 76–115-13–1). Coyne envisages an exchange rate system whereby it ‘would be undesirable for the authorities to take any great degree of responsibility for the movement of the exchange rate’ (Coyne Reference Coyne1949, LR 76–115-13–4). However, neither Coyne nor other Bank officials interpreted a floating exchange rate as tantamount to complete laissez-faire in foreign exchange markets. He adds: ‘Bank of Canada action could be determined solely by the view taken of the desirable level of reserves which should be maintained’ (Coyne Reference Coyne1949, LR 76–115-13–4). Several archival documents, written especially through the mid 1950s, allude to the necessity of permitting the exchange rate to freely fluctuate so long as it is constrained to vary within a band or within some tolerance limits (e.g. Rasminsky Reference Rasminsky1946–51).Footnote 11 It seems clear that the exchange rate system as envisaged by Coyne broadly resembles what would eventually be called the target zone exchange rate system proposed by Krugman (Reference Krugman1991).
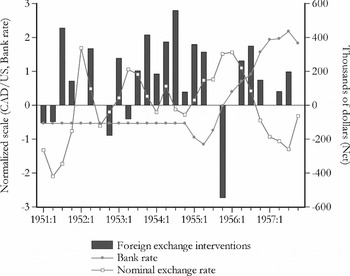
Figure 2 plots the nominal exchange rate, the bank rate, and Bank of Canada interventions in the spot market for the 1951–7 period when the central bank actively bought and sold US dollars.Footnote 12 Foreign exchange interventions, measured in thousands of US dollars, are persistent and are, more often than not, positive, which means that the Bank was typically a net buyer of US dollars. Hence, on the whole, pressure on the Canadian dollar was in the direction of appreciation which intervention was seeking to offset through an increase in the supply of Canadian dollars, a clear sign of ‘leaning against the wind’.
Foreign exchange intervention, 1951–7

3.2. Previous interpretations of Bank of Canada exchange rate policy in the 1950s
The relevant literature can be divided into two parts: studies that are primarily interested in the macroeconomic effects (i.e. on output, the unemployment rate, the balance of payments, etc.) of a floating exchange rate system while a separate literature essentially focuses on the role of intervention versus speculation in foreign exchange markets as an explanation for the low level of volatility in the Canadian dollar under the float. In what follows, the focus will be on the second strand of the literature. Canada's experience during the 1950s may well have been the inspiration for advocates of the float, and their belief in its stabilizing effects on the nominal exchange rate (Friedman Reference Friedman and Friedman1953; Johnson Reference Johnson1970). Consequently, there is an extensive literature on the subject and what follows represents only a highly selective survey.
Bordo et al. (Reference Bordo, Dib and Schembri2007) dismiss foreign exchange intervention during this period as being inconsequential. They also claim that the literature ‘has concluded that official intervention did not play a significant role in stabilizing the nominal exchange rate’. They justify their conclusion in part on the grounds that intervention amounts were relatively small. The effectiveness of foreign exchange intervention, however, is not only a function of its size but also stems from its ability to influence expectations or in prompting agents to engage in portfolio reallocation. This explains, in part, the continued reliance to this day on intervention in foreign exchange markets even though capital mobility is high, transactions costs are low, and purchases or sales of foreign exchange by central banks are likely proportionately even smaller in size relative to the volume of transactions in foreign exchange markets (see Sarno and Taylor Reference Sarno and Taylor2001) than in the 1950s. Bordo et al. (Reference Bordo, Dib and Schembri2007) also contend that the floating exchange rate helped induce stability in key macro variables and that policymakers did not understand how monetary policy performs under a floating exchange rate with a high degree of capital mobility. They reach this conclusion based on a series of counterfactuals based on a New Keynesian type model. Their model is entirely forward-looking, a feature that is neither discussed nor defended. While there is little doubt that monetary policy was, to a limited extent, forward-looking, it could not have been entirely far-sighted. Moreover, their interpretation about the level of understanding of the implications of a monetary policy under a float is questionable, although policy mistakes were clearly made.Footnote 13
Earlier studies of Canadian exchange rate policy in the 1950s consider whether speculation could explain the stability of the exchange rate. Other than perhaps McLeod (Reference McLeod1965),Footnote 14 the literature finds that speculators either did contribute to stabilizing the exchange rate, or that it is difficult to find evidence that speculation had the potential to destabilize the currency. Studies in this vein include Ingram (Reference Ingram1960), Powrie (Reference Powrie1964), Poole (Reference Poole1967) and Arndt (Reference Arndt1968).
Turning to studies that explore the impact of intervention by the Bank of Canada in foreign exchange markets, the practice has usually been to rely on data on official foreign exchange reserves data, either at the monthly or quarterly frequencies. Importance was also attached to the ‘psychological’ role of the exchange rate at parity with the US dollar. Indeed, the usual reference to the ‘premium’ or ‘discount’ of the Canadian dollar vis-à-vis its US counterpart is symbolic of the importance that markets and policymakers apparently placed on a par value with the US currency (e.g. also see Wonnacott Reference Wonnacott1960, p. 95). As a result, several authors made a distinction between interventions meant to ensure that the exchange rate wandered around some ‘normal’ rateFootnote 15 as opposed to interventions whose objective was to limit exchange rate volatility. While there was a lively debate about whether the government or the Bank of Canada could influence ‘trends’ in the nominal exchange rate (e.g. see Eastman and Stykolt Reference Eastman and Stykolt1956), there seems to be more of a consensus that foreign exchange intervention could contribute to reducing the volatility in the nominal exchange rate (e.g. Pippenger Reference Pippenger1967; Mellish and Hawkins Reference Mellish and Hawkins1968; Pippenger and Phillips Reference Pippenger and Phillips1973).Footnote 16
To summarize, there is no universal agreement on the impact of foreign exchange intervention during the 1950s. Yeager (Reference Yeager1976) and Wonnacott (Reference Wonnacott1965), for example, conclude that intervention was ineffective only in the sense of not permanently influencing exchange rate levels. There is, instead, greater agreement that intervention accomplished its principal aim of limiting exchange rate variability. What is particularly striking, however, is that the existing literature does not resort to any intervention data, relying instead on proxies or indirect evidence of its impact on the exchange rate. The next section presents evidence which overcomes this deficiency.
4. Foreign exchange intervention in Canada, 1951–7: data and empirical results
4.1. Data and stylized facts about intervention
Data used in the empirical analysis below are sampled at the daily, weekly and quarterly frequencies. Daily exchange rate data, defined as the Canadian dollar price of one US dollar were obtained from the Bank of Canada. Interest rate data in the form of the yield on 90-day Treasury bills are available at the weekly frequency beginning on 29 January 1953.Footnote 17 The bank rate, which represents the penalty rate charged on loans made to so-called chartered banks, is also available at the weekly frequency.
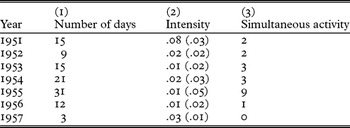
Although there are suggestions that select foreign exchange reserve data are also available at a sampling frequency higher than the monthly frequency, I could find no such time series.Footnote 18 Therefore, a weekly time series is also constructed by simply assuming that the average level of reserves is constant within the month.Footnote 19 Intervention data were obtained from the Bank of Canada Archives.Footnote 20 Readers are asked to consult, for example, Wonnacott (Reference Wonnacott1965) for detailed explanations concerning the operations of the Exchange Fund Account managed by the Bank of Canada acting on behalf of the government to implement foreign exchange interventions. Table 1 provides summary statistics about the frequency and intensity of interventions. Column (1) reveals that interventions occurred infrequently while the intensity of interventions, proxied here as the ratio of interventions to the stock of reserves, was small. However, this figure understates somewhat the effective size of interventions since, as shown in column (3), there were several days when the Bank of Canada simultaneously purchased and sold US dollars in the foreign exchange market. Recall that the purpose of the intervention regime was to ensure that the premium or discount vis-à-vis the US dollar remained within some (unspecified) range.
The frequency and intensity of foreign exchange intervention: summary statistics

Note: Column (1) indicates the total number of days in a particular year the Bank of Canada intervened in the foreign exchange market. Column (2) is the average size of interventions (in US dollars) during the calendar year, as a percentage of the stock of foreign exchange reserves (also in US dollars). The standard deviation is in parenthesis. Figures are rounded up to the nearest decimal. Column (3) shows the total number of days in a particular year where the Bank of Canada both purchased and sold US dollars in the foreign exchange market on the same day.
Although a market for forward exchange existed at the time, I was unable to construct a consistent time series.Footnote 21 Forward transactions were usually arranged between chartered banks and their customers. Instead, I rely on the US–Canada interest rate differential since capital was highly mobile between the two countries. The short-term interest rate in Canada begins to exceed the comparable US rate around the end of 1953 until essentially the end of the sample period considered. Similarly, the discount rates in both countries show, with few exceptions, Canadian rates as having exceeded the US rate throughout the period (not shown).Footnote 22 There is no apparent correlation between changes in official reserves and the Canada–US interest rate differential. In contrast, intervention reached its most intense level the wider the gap between US and Canadian interest rates.
4.2. Empirical evidence on intervention and the exchange rate
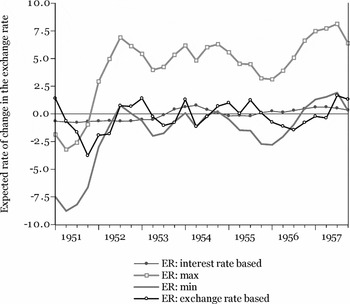
Figure 3 assumes that the Bank of Canada adopted a target zone policy to limit exchange rate movements. Relying on the simple method suggested by Svensson (Reference Svensson1992), we can estimate an expected rate of appreciation assuming interest rate parity holds. Under this scenario, the expected rate of appreciation is determined by the interest rate differential between the two countries’ nominal interest rates. Alternatively, since an expected exchange rate series is not available, we can instead use the actual exchange rate one quarter ahead to obtain an estimate of the expected rate of appreciation. The resulting estimates are then compared to estimates that arbitrarily assume a ±3% fluctuation band at the quarterly frequency. This assumption seems reasonable based on the archival documents previously cited. The plot is striking for the data suggest not only that exchange rate appreciations were, for the most part, close to the hypothesized lower bound but that the regime was also largely a credible one. This represents a little bit of evidence that may help to explain the relative stability of the exchange rate in the 1951–7 period.
Expected rates of depreciation

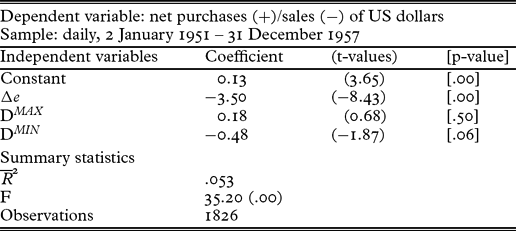
This apparent asymmetry in the intervention practices of the Bank of Canada, that is, the tendency to lean against an appreciation of the Canadian dollar, is also apparent from Table 2 which estimates, for daily data, a version of a simple intervention model that links intervention to exchange rate movements and a decision rule used by the central bank to limit the size of appreciations or depreciations in the exchange rate (e.g. also see Murray et al. Reference Murray, Zelmer and McManus1997). The basic specification is written

where INTt represents either net purchases (+) or sales of US dollars (−), Δe is the rate of change in the exchange rate, and D MAX and D MIN are two dummy variables equal to one when changes in the nominal exchange rate exceed some unannounced intervention threshold of +¼% on a daily basis.Footnote 23 The constant term is positive, and statistically significant, an indication that, on average, the Bank of Canada was purchasing US dollars, and this is consistent with the summary statistics in Table 1, and the evidence presented in Figure 2. The slope coefficient estimates for β1 reveal that, on average, an appreciating dollar (i.e., Δe t < 0) led to net purchases of US dollars. Note, however, that this effect is enhanced when nominal exchanges rate changes exceed the lower (hypothetical) intervention limit (i.e.  is statistically significant while
 is not) thereby providing some empirical evidence of the asymmetric intervention phenomenon described earlier. The evidence, so far, points to a fear of appreciation on the part of policymakers and, hence, to a managed float as opposed to a pure float.Footnote 24
Intervention model
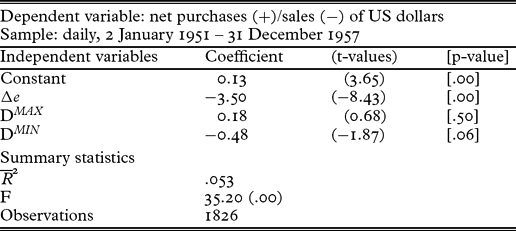
Note: Intervention data in millions of US dollars, Δe is 100 times the log first difference of the nominal exchange rate (CAD per US dollar). DMAX and DMIN are the intervention ranges referred to in the text (see n. 14). The equation was estimated via least squares.
4.3. Intervention and exchange rate volatility
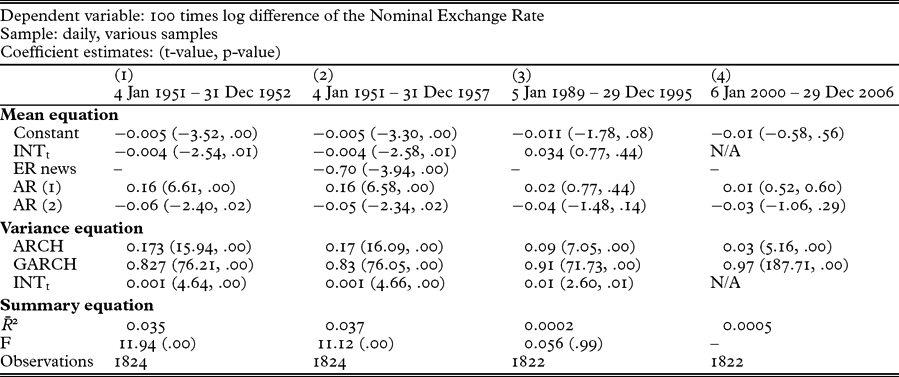
Intervention is intended not only to possibly influence exchange rate levels but, perhaps equally important, may contribute to moderating exchange rate volatility. Therefore, Table 3 presents estimates of various conditional volatility models, again at the daily frequency. As several preliminary estimates of the workhorse GARCH (1, 1) model for all the samples considered yielded estimates of the ARCH and GARCH terms that were not statistically different from one, all the estimates shown are based on an IGARCH (1, 1) model.Footnote 25 The mean portion of the equation yields, after some experimentation, an AR(2) model. Hence, an AR(2) – IGARCH(1, 1) model appears to best describe the 1950s data. Column (1) adds the intervention series (in absolute value) in both the mean and variance equations thereby permitting intervention to influence both moments.
AR(2) – IGARCH (1, 1) Estimates for three exchange rate regimes
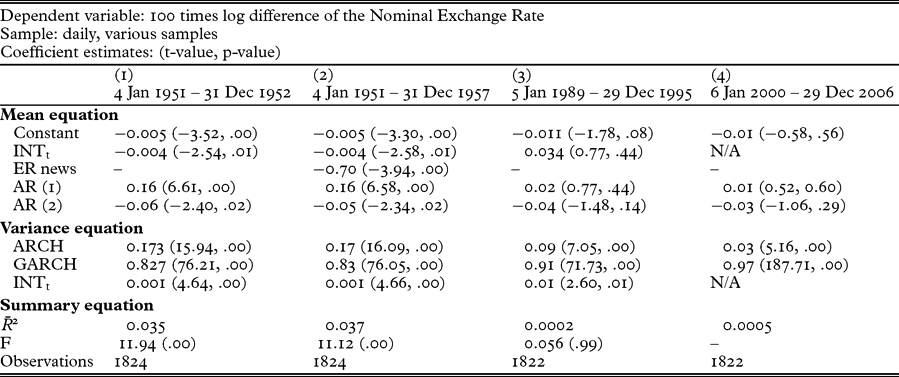
Note: Estimated via maximum likelihood assuming student's t-distribution.
Column (2) is the same specification as in column (1) except that I now add a news variable. Since the nominal exchange rate might also react to verbal announcements, and not simply to actual interventions in the foreign exchange market, I compiled a series of news dummy variables. Two sets of dummies were constructed from a search of the Globe and Mail newspaper from 1951 until the end of 1961.Footnote 26 Using the keywords ‘exchange rate’ or ‘monetary policy’, both the front-page headlines and the op ed pages were searched for relevant articles that commented either on the state of the exchange rate or the perceived stance of monetary policy. For example, a headline on the front page of the 13 March 1952 Globe and Mail announces ‘Canadian dollar highest since ’30s’, while an op ed column on 22 February 1954, entitled ‘The problem is economic’, argues that economic problems faced in Canada are not due to the relatively high value of the Canadian dollar but to other factors (e.g. taxes and duties). The ‘exchange rate’ and ‘monetary policy’ dummies were further disaggregated according to whether the news appeared on the front page or in the op ed sections of the Globe and Mail. A total of 52 exchange rate and monetary policy announcements were identified. The variable that enters here consists of news items about the exchange rate (ER news) covered on the front page of the Globe and Mail. Other news effects variables previously described proved not to be significant when included in both the mean and variance equations (results not shown) while the ER news variable did not significantly influence conditional volatilities. The results indicate a moderate amount of persistence in exchange rate changes (viz. as seen from the AR (1) and AR (2) coefficients) while the sign of Δe indicates, as noted earlier, a tendency for the pressure on the exchange rate to appreciate. As before, interventions in both the mean and variance equations are statistically significant. However, it is noteworthy that intervention contributes to raising volatility and this may partly explain the decision to effectively cease intervention in foreign exchange markets until the early 1960s in anticipation of the return to Bretton Woods. Indeed, if we consider two other notable episodes in Canadian monetary history, namely the intervention era of the early 1990s (see Murray et al. Reference Murray, Zelmer and McManus1997), and the ‘pure’ float since just before the adoption of inflation targets (in 2001), we see some striking parallels as well as differences. Columns (3) and (4) of Table 3 estimate AR(2)-IGARCH(1, 1) models for the 1989–95 and 2000–6 periods. The former sample includes an intervention variableFootnote 27 in both the mean and variance equations while no such variable is relevant for the 2000–6 sample.Footnote 28 Consistent with the views of the Bank of Canada, intervention was not only meant to temper appreciations in the currency but it also influenced its volatility. Instead, intervention actually increased exchange rate volatility and this feature of the dataFootnote 29 may partly explain the decision to abandon foreign exchange intervention, except in extreme situations. Nevertheless, it is also the case that exchange rate changes behave as a random walk in both samples considered,Footnote 30 unlike the 1950s era. Presumably, the growing sophistication and global nature of foreign exchange trading is partly responsible for this outcome. Nevertheless, the fact that the exchange rate does not behave as a martingale during the 1950s is consistent with the notion that exchange rate movements contain some structure, and this can only be yet another indication of a form of ‘leaning against the wind’.Footnote 31
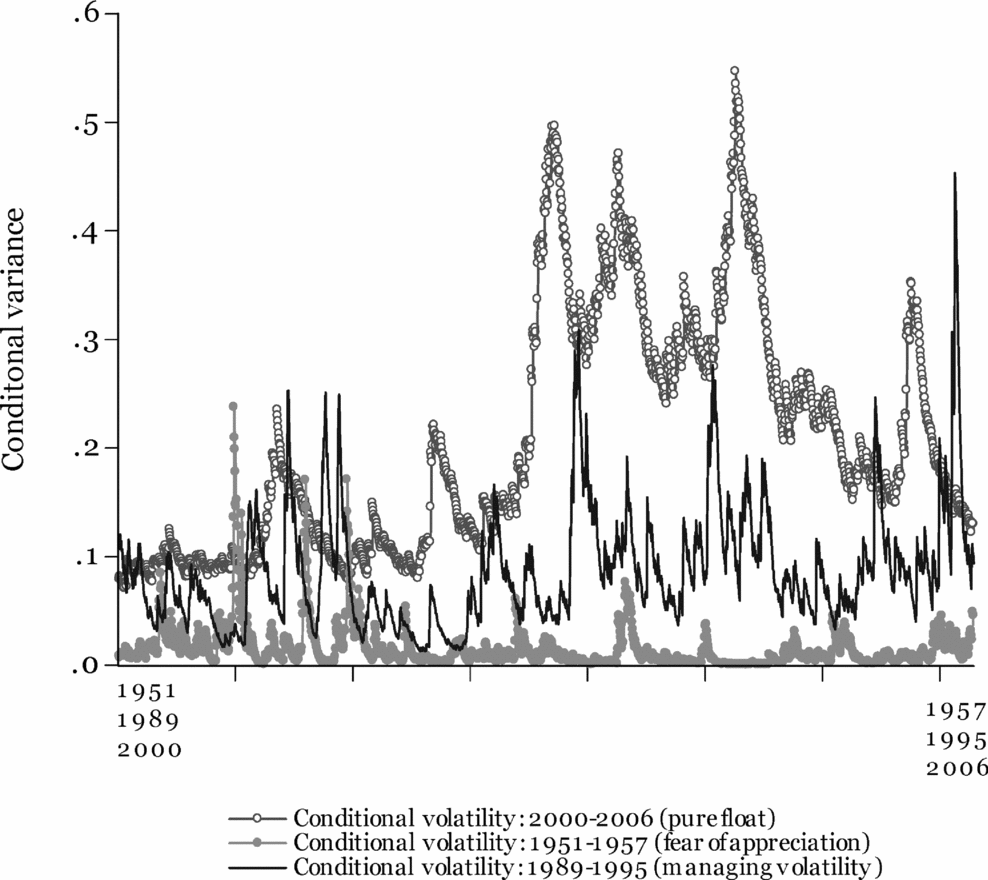
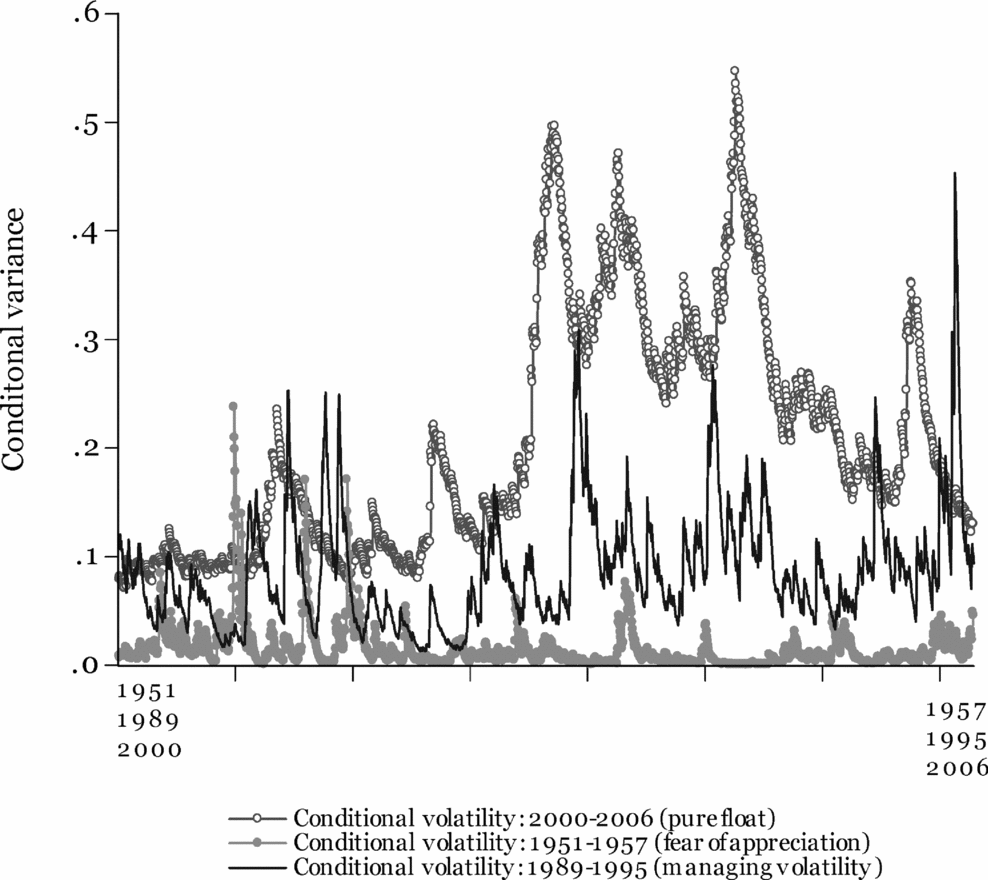
Finally, Figure 4 plots, on a normalized scale, the conditional volatilities of the three samples considered. It is clear that the era of the ‘pure’ float yields by far the highest volatility estimates while the two eras of foreign exchange intervention yield conditional volatilities that are more alike. Nevertheless, the conditional volatilities for the 1950s remain relatively low. Therefore, the managed float induced a more stable exchange rate than either a pure float or a policy meant to mitigate exchange rate volatility alone.
Conditional volatility estimates under three different foreign exchange regimes
4.4. A counterfactual experiment
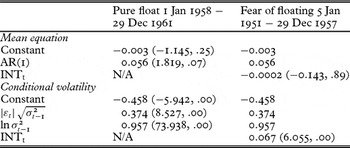
Since the economy of the 1980s and the 2000s are clearly different from the environment facing policymakers during the 1950s, an alternative approach consists in devising a counterfactual experiment that asks what the behavior of the exchange rate in the 1951–7 period would look like if there had been a pure float. We know that, between 1958 and 1961, the Bank of Canada and the Ministry of Finance took a ‘hands off’ approach in the foreign exchange market. Indeed, the run-up in the exchange rate after 1958 is clearly visible in Figure 1. We can, therefore, presume that this period was indeed consistent with the textbook floating exchange rate regime. Table 4 reports estimates of an AR(1)-EGARCH(1,1) model which appears to best describe the mean and conditional volatility of the exchange rate during the 1958–61 period.Footnote 32 Column (1) shows that the exchange rate was considerably less persistent during this period than in the 1951–7 fear of floating period discussed above. This, by itself, is suggestive of evidence of a more managed float in the earlier sample. The asymmetry term (the second coefficient in the variance equation) is highly significant which reflects the impact of the sharp downward movement in the exchange rate level during this period (see Figure 1). The counterfactual experiment consists in asking what the impact of foreign exchange intervention would have been if the model and coefficients estimated for the 1958–61 sample also describe the evolution of the exchange rate, and its volatility, in the period of interest, that is, for the 1951–7 period. As shown in column (2) of Table 4 we find that intervention would have not affected the mean equation while conditional volatility would have increased precisely, as one would expect if intervention is unexpected as is the case under a pure float. Hence, we have still more evidence that the 1951–7 period is not of the pure float variety but comes closest to a managed floating exchange rate regime.
Counterfactual experiment: What if the Canadian dollar floated in 1951–7?

Note: Also, see notes to Table 3. The model here is an AR(1)-EGARCH(1,1). In the fear of floating sample the mean and conditional variance coefficients, except for INT, were constrained to be the same as in the pure float sample. This is why there are no standard errors next to the conditional variance terms in the second column, with the exception of the INT variable whose impact, of course, must be estimated.
5. Conclusions
The bulk of the evidence suggests that foreign exchange intervention during the 1950s had a significant influence on both the mean and conditional variance of exchange rate changes. Comparisons with later episodes of intervention and a ‘pure’ float also suggest that intervention during the 1950s was a significant factor in the relative stability of exchange rates during the 1950s. Unlike earlier studies of the era that rely on official foreign exchange reserves data, this article employs heretofore unused intervention data in the spot market during the 1951–7 period, to make the case that Canada operated under a managed float. A counterfactual experiment also reinforces the main contention of this study. This is not to say that intervention was the only ‘story’ of 1950s monetary policy. Nevertheless, it is clear, unlike the earlier literature which has tended to describe the 1950s in Canada as a floating exchange rate regime of the pure textbook variety, that a significant amount of ‘fear of appreciation’ contributed to explaining movements and the volatility of the Canadian dollar during the 1951–7 period.
In reflecting on the exchange rate policy of the government and the Bank of Canada during the 1950s, it is interesting to note that, just as the decision to float in 1950 was partly influenced by the favourable experience with a flexible exchange rate before World War II, the decision to adopt a managed float once again in 1970 was also prompted by the experience of the 1950s. Between 1970 and 1995, foreign exchange intervention occurred frequently, prompted by pressure on the exchange rate, and triggered once the Canadian dollar exceeded a narrow intervention band. However, as was the case in the 1950s, the timing of interventions, as well as the width of the non-intervention band, was kept secret from financial markets and the public (see Murray et al. Reference Murray, Zelmer and McManus1997). Since that time the Bank of Canada has moved to a regime with more transparency and flexibility when, following the adoption of inflation targets in 1991, the Bank retained the right to intervene in foreign exchange markets but refrained from doing so, except on one occasion (Rogers and Siklos Reference Rogers and Siklos2003).Footnote 33 A future return to a more actively managed exchange rate system, while unlikely, is not, however, out of the question.
Acknowledgements
I am grateful to Jane Boyko of the Bank of Canada Archives for her assistance in providing documents from the Towers, Coyne, and Rasminsky eras, and to Larry Schembri for his help in providing some of the data used in this article. Comments on a previous draft by Marc Flandreau, Barry Eichengreen, Thorvaldur Gylfason, Eric Helleiner, Larry Neal, two anonymous referees and participants at the PPP3 conference in Genoa, Italy, 26–28 March 2008, are also greatly appreciated. Figures not shown in the main body of the article are available in a separate appendix. The data used in the article will also be made available at www.wlu.ca/sbe/psiklos