I. INTRODUCTION
Metal plates are traditionally formed by force and mechanical loads on metals. For example, deep drawing forming is performed using hydrostatic pressure. Reference Walczak, Ramos-Grez, Celentano and Lima1 Metal plate forming by laser includes induced thermal operations Reference Ding, Zhang and Kovacevic2 without hard molds Reference Wang, Li, Shen, Sha, Gao, Li, Sun, Ma and Liu3 or external forces. Reference Cheng and Yao4 This technique is used in various industries, such as aerospace, automotive, microelectronics, shipbuilding, Reference Ding, Zhang and Kovacevic2,Reference D’Souza, Palani, Naikwad, Padmanabhan, Shanmugam and Natu5 and micro-electro-mechanical systems. Reference Wang, Li, Shen, Sha, Gao, Li, Sun, Ma and Liu3 Although, the cost of laser forming of large sheets is greater than other methods, but the defocused laser beam is widely used as a secondary method for forming large sheet materials. Reference Edwardson, Edwards, Carey, Dearden and Watkins6
Forming by laser has many advantages compared with the traditional metal forming technology. Reference Prashanth, Scudino, Chaubey, Löber, Wang, Attar, Schimansky, Pyczak and Eckert7 The former method is characterized by high accuracy and significantly reduced the cost of forming Reference Hu, Luo and Yao8 because no external force or tool is used. Reference Wang, Zhang, Shen, Li, Qian and Liu9 Moreover, forming by laser can be applied to a wide variety of components of metal plates and small products. Heat is used in forming metals to create a controlled deformation, resulting in energy efficiency. Additionally, this method can be used to form soft and brittle materials with appropriate coefficient of expansion. Reference Chakraborty, Maji, Racherla and Nath10 The fatigue behavior of a formed alloy is improved by laser because of the created compressive stresses on the surface. However, forming by laser also has limitations such as the amount of deformation and low production rate. Reference Chakraborty, Maji, Racherla and Nath10
Metal forming processes using laser, such as laser shock peening, Reference Lavender, Hong, Smith, Johnson and Lahrman11 is generally performed in three mechanisms, Reference Chakraborty, Maji, Racherla and Nath10,Reference Bartkowiak, Borowski, Dearden, Watkins, Vollertsen and Seefeld12,Reference Safari and Mostaan13 namely, temperature gradient mechanism (TGM), Reference Siqueira, Carvalho, Kam, Riva and Lima14,Reference Maji, Pratihar and Nath15 upsetting mechanism (UM), and buckling mechanism (BM). Reference Safari and Mostaan13 The plate under TGM relies on a steep temperature gradient bent toward the laser beam. In the absence of an external stress, under BM, bending occurs from the area where laser hits the plate and the uniform temperature distribution is created across the thickness, so the cold materials around the lasing zone constrain the expansion and finally the deformation occurs. UM is associated with contraction in the plate and expansion of thickness in the heated region. Under UM, due to the plate geometry, buckling does not occur; therefore, the sample will be thicker at the irradiated zone. Reference Chakraborty, Maji, Racherla and Nath10
To find the dominant mechanism of laser forming, Fourier number (F) can be used. The Fourier number is a dimensionless time-dependent parameter representing the thermal gradient at the plate section. This parameter is expressed as the square of the heat diffusion length to the plate thickness ratio.
Reference Chakraborty, Maji, Racherla and Nath10
Chakraborty et al.
Reference Chakraborty, Maji, Racherla and Nath10
showed that the heat diffusion length of stainless steel is calculated using
 $\sqrt \kappa \tau$
, where κ is the heat diffusivity in the stainless steel plate and τ is the time of contact between the laser and the plate. The contact time of beam with the proportionality beam diameter (d) with the scan rate (υ) is calculated as τ = d/υ. Therefore, the F parameter of a plate with a thickness of h is obtained using F = κd/h
2υ.
Reference Chakraborty, Maji, Racherla and Nath10,Reference Chakraborty, More, Racherla and Nath16
If F is smaller than 1, TGM will prevail. Otherwise, the two other mechanisms will be dominant.
Reference Chakraborty, Maji, Racherla and Nath10
BM will be dominant when the laser beam diameter is more than 10 times the plate thickness, therefore the thickness of plate is less than that needed to resist against buckling.
Reference Chakraborty, Maji, Racherla and Nath10
TGM was used in this study. TGM is related to the creation of a high thermal gradient within the sheet. To establish the conditions for thermal mechanism, the diameter of the laser beam should be equal to or less than the thickness of the plate sheet. Under TGM, surface thermal expansion will be induced by creating elastic strain and due to the thermal gradient during the lasing, the negative curvature will be caused in sample. The bending is equal to the surface stress released in the heated area. Thermal expansion will become a plastic compressive strain as temperature increases. These strains are stored until the surface begins to melt or heating is terminated. After stopping heating, cooling occurs, leading to the contraction of the piece. This contraction leads to the deformation and bending of the plate,
Reference Edwardson, Griffiths, Dearden and Watkins17
which is affected by different parameters. For example, bending angle increases with laser power but decreases with increase in the spot diameter, scan rate, and plate thickness.
The laser beam affects the properties of the formed alloy. Alloys containing chromium of more than 12%, such as 316 stainless steel, are protected against corrosion by forming chromic oxide layer. Reference Krivilyov, Kharanzhevskiy, Reshetnikov and Beyers18,Reference Liu, Yin, Dai, He, Fang, Chen and Dong19 Therefore, laser irradiation can have a significant role on the mechanical and corrosion properties of an alloy because of the increased temperature resulting in various phenomena, such as recrystallization, thermal gradient, and dissolution of chromium carbide. Reference Zhang and Liu20
Despite these advantages, further investigations on forming using lasers should be performed for this process to become a practical technology. In this study, 316 stainless steel was irradiated by laser to obtain a better understanding of the impacts of controlled forced cooling on the properties of the alloy. Reliable empirical numerical results provided more insights of the cooling effects on the microstructure and other mechanical properties. These results will help to predict the effects of laser irradiation on the microstructure, and mechanical and corrosion properties of a stainless steel alloy.
II. METHODS AND MATERIALS
A. Equipments
Neodymium YAG-pulsed laser device with maximum power of 700 W and nitrogen shielding gas was used in the forming experiments. A table that can move along the three main axes (x, y, z) was used to move samples. Moreover, the cold rolled 316 stainless steel plates with composition in wt% 0.05C, 0.42Si, 1.17Mn, 0.04P, 0.007S, 17.35Cr, 2.53Mo, 12.21Ni, 0.11Al, 0.19Co, 0.4Cu, 0.02Nb, 0.01Ti, 0.06V, 0.05W and the balance Fe with dimensions of 100 × 100 × 1 mm3 were used based on the design of experiments for experimental tests.
All sample surfaces were cleaned by a wire brush and degreased by ultrasonic devices in an ethanol environment to enhance the absorption of the energy of the laser beam and increase the efficiency. Finally, the samples were dried by nitrogen gas. A total of eight samples, without any coating, were tested. Lasing was performed on four samples under natural cooling, that is, without forced cooling. The bottom surface had a temperature of 25 °C for the first lasing pass, and this temperature was incrementally increased by the number of passes. The other four samples were laser irradiated under forced cooling conditions in which the bottom surface temperature was 0 °C. Lasing was conducted for 1, 5, 10, and 15 passes along the perpendicular to the rolling direction. Laser beam with an energy of 300 W, a spot diameter of 7 mm, and a frequency of 20 Hz was used. Laser beam scan rate on every pass was 5 mm/s. According to Eq. (1), Reference Chakraborty, Maji, Racherla and Nath10 initial temperature (T 0) of the sample at the start of each pass of lasing increases with the number of lasing passes, reducing the temperature difference between plates (ΔT). Thus, the rate of deformation is reversed with the number of laser passes,
 $$\Delta T = {{2H\sqrt {\kappa d/v} } \over {K\sqrt \pi }}\quad ,$$
where ΔT = T max – T 0, T max is the maximum surface temperature (K), H is the absorbed laser power intensity, κ is the thermal diffusivity (m2/s), d and v are the laser spot diameter (m) and scan velocity vector (m/s), respectively, and K is the thermal conductivity (W/m K).
B. Creation of forced cooling
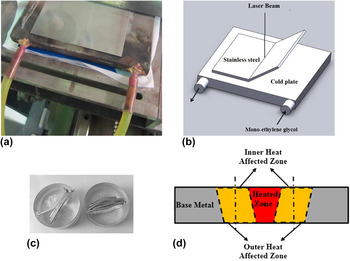
To apply forced cooling, a vapor compression refrigerator (chiller) was designed and built according to the conditions of the required tests and with maximum power of 2 tons. The forced cooling system consisted of two main parts. The first part included the compressor, evaporator, condenser, expansion valve, and a reservoir for storing monoethylene glycol solution as a cooling fluid. The second part included a tank for fluid to flow through the pump, which was connected to the fluid storage tank and other devices through flexible interfaces. The second tank was placed at the bottom of the samples, through which sensors were embedded in the device. The temperature of the circulating fluid was kept constant at 0 °C. Figures 1(a) and 1(b) show the cooling plate and stainless steel plate before exposure and illustration of the cooling plate with cooling fluid path, respectively.
Equipment used for cooling the bottom surface of the 316 stainless steel plate. (a) Cooling plate and stainless steel plate before exposure, (b) schematic illustration of the cooling plate and cooling fluid path, (c) mounting of deformed samples, and (d) schematic illustration of the different areas affected by the laser beam.

C. Analysis of results
To determine the bending angle after completion of each exposure pass, the cross section was photographed, and bending angle was calculated using ImageJ software (National Institutes of Health, Bethesda, Maryland). The microstructure of the deformed specimens was investigated by cutting the samples from the cross section of the laser-irradiated zone and mounting these samples by epoxy resin according to Fig. 1(c). Three zones, heated zone (irradiated zone), inner heat affected zone, and outer heat affected zone, were investigated [Fig. 1(d)]. Due to heat transfer from the heated zone to the outer heat affected zone, the temperature reduction occurred. As a result, there will be different properties between the inner and outer heat affected zones. The samples were etched in 2% nital solution. Finally, the microstructures of all samples were studied by a light microscope at 100× magnification, and grains were photographed.
The grain sizes in the irradiated area and the inner and outer areas of the heat-affected zone were determined in accordance with the standard ASTM E112-13. 21 The decisive line method was used, five regions in each photograph of sample were evaluated, and the grain size was calculated using Eq. (2) as follows:
 $$D = {L \mathord{\left/ {\vphantom {L n}} \right. \kern-\nulldelimiterspace} n}\quad ,$$
where D is the grain size, L is the length of the line, and n is the number of grains cut per line on the image at 100× magnification.
The hardness of the samples was measured using Vickers microhardness test under force of 300 gf with a load time of 10 s. The size of the indent was evaluated by a microscope with 550× magnification.
For the investigation of chromium carbides depletion zones, the Streicher etching method was used in 10 wt% oxalic acid according to the ASTM A262 standard.
Potentiodynamic test was performed using a potentiostat (EG & G model 273, Princeton Applied Research, Oak Ridge, Tennessee) to evaluate the pitting corrosion resistance of the deformed samples. HCl (1 M) was used as the test solution, and the counter electrode was a platinum rod with a diameter of 2 mm and a length of 40 cm. Saturated calomel electrode (SCE) was used to measure the potential. The samples were tested after 1 h of immersion in the solution in the potential range from −0.6 V to 0 V relative to the saturated calomel electrode and a scan rate of 2.5 mV/s.
D. Statistical analysis
The grain size and microhardness experiments were repeated five times (n = 5) to better evaluate and determine the reproducibility of the results. The results were analyzed by SPSS software (SPSS Inc., Chicago, Illinois), ANOVA, and Tukey’s post-hoc test. The average grain size and microhardness of the laser-irradiated area and heat-affected zone were determined with a significance level of 5%.
III. RESULTS AND DISCUSSION
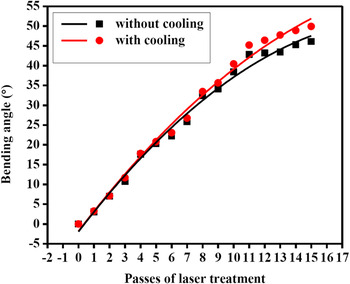
Bending angles were measured by imaging the samples after each lasing pass on the surface of the stainless steel plate. The test was repeated several times in some instances. The averaged resulting bending angles of the stainless steel are shown in Fig. 2. The slope of the bending angle curve versus number of lasing passes for samples under natural and forced cooling conditions is reduced as the number of lasing pass increases. The temperature gradient between top and bottom surfaces is reduced with the increase in lasing pass, thereby reducing the rate of the bending angle.
Diagram of bending angle of the sample under natural and forced cooling.

By contrast, deformation occurs at a lower rate with increasing plate deformation because of the compressive stresses on the laser-irradiated surface, inducing tensile stress in the underside of the plate. In this experiment, the underside of the sample remained cool, resulting in a more severe thermal gradient and more changes in the angle as the number of lasing passes increases. The difference between the angles of forcedly cooled and naturally cooled samples increases with the number of lasing passes. Increasing the number of lasing passes increases the temperature of the samples without the cooling equipment. Thus, the temperature difference between the upper and lower surfaces is reduced with increasing the number of lasing passes. Consequently, the bending angle is reduced with the thermal gradients. If the time between repetitions of each lasing pass is increased, then the sample has enough time to cool to room temperature, Consequently, the deformation rate will become higher. Another way to increase the forming rate is cooling the sample; therefore more lasing passes can be performed in lesser time.
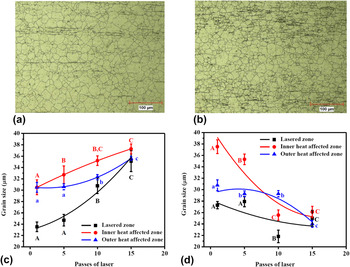
Optical microscope images from the laser-irradiated zone of the 316 stainless steel after 15 lasing passes under natural and forced cooling are shown in Fig. 3. Figures 3(c) and 3(d) show the evaluated grain size for samples under two cooling conditions at the laser-irradiated area and the inner and outer layers of the heat-affected zone.
Optical microscope image of the upper surface of stainless steels after 15 passes of lasing under (a) natural and (b) forced cooling; changes in the grain size of stainless steel according to the number of lasing passes under (c) natural and (d) forced cooling. The grain size of the as-received material was 30 ± 0.6 μm. The bars show the mean (n = 5) ± SD. Different letters on the bars represent significant differences at 5% level of probability.

The results show that under one lasing pass and without forced cooling, the grain size of the laser-irradiated region is approximately 24 μm, which is smaller than that (approximately 31 μm) at the heat-affected zone. Atoms diffuse upon irradiation because of the increased temperature. Reference Kiahosseini, Afshar, Larijani and Yousefpour22 Therefore, recrystallization occurs, and new fine grains form because of the tension caused by the production process in the plate. However, lesser recrystallization occurs at the zones around the laser-irradiated region because of the lower temperature in these zones. Thus, the grain sizes at the inner and outer layers of the heat-affected zone are almost equal. Increasing the number of exposures to 15 passes will result in the grain growth in the different regions of the plate, but grain growth will occur more quickly in the laser-irradiated region, with grain size similar to those of other regions.
Contrary results are observed in the grain size of samples irradiated under forced cooling. Finer grain is visible with one lasing pass because of the recrystallization in the area, but forced cooling leads to a lower recrystallization rate compared with natural cooling. Thus, the grains are coarser in the former cooling mode. Increasing the number of lasing passes results in a lower increase of the temperature because of the thermal gradient, and reduction in the temperature occurs more quickly after the beam passes from each region. Thus, recrystallization plays a dominant role in grain growth, and the stress caused by deformation in consecutive passes under forced cooling reduces the grain size in the three regions compared with natural cooling.
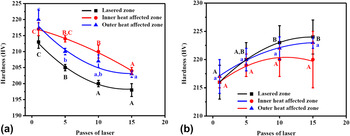
Figure 4 shows a plot of the changes in the hardness for the laser-irradiated and inner and outer layers of the heat-affected regions versus the number of lasing passes. The hardness of the laser-irradiated region for naturally cooled samples is lower than those in the other areas (Figs. 4(a)). In this case, heat dissipation is slow, resulting in sufficient time for grain growth and stress relief. Reference Kiahosseini, Afshar, Larijani and Yousefpourd23 Therefore, although according to the Hall–Patch equation (3) Reference Du, Fu, Li, Jing, Wang, Ren and Yang24 the laser-irradiated region is expected to exhibit more hardness than other areas because of recrystallization and finer grains, the hardness in the former is lower than other areas because of the stress relief phenomenon. This behavior is justified by Herring. Reference Herring25 In the recrystallization region, the hardness of the material shows a downward trend despite the fine grain size. Increasing the number of lasing passes provided conditions for grain growth in all three regions because the temperature inside the steel slowly dissipated. Therefore, the Hall––Petch equation is dominant, and the hardness of the material shows a decreasing trend. Moreover, no significant difference was found between the internal and external hardness in the heat-affected zone,
 $$\sigma = {\sigma _0} + {k \over {\sqrt d }}\quad ,$$
where σ is the strength, σ0 is the frictional stress, k is a constant, and d is the grain size.
Graph of hardness of laser-irradiated samples under (a) natural and (b) forced cooling according to the number of lasing passes. The hardness of the as-received material was 218 ± 3 HV. The bars show mean (n = 5) ± SD. Different letters on the bars represent significant differences at 5% level of probability.

The rapid heat transfer in samples treated with one lasing pass under forced cooling mode [Fig. 4(b)] led to insufficient time for stress relief and recrystallization. Therefore, the three regions exhibit hardness in the range of 215–220 HV. Under forced cooling condition, residual stress is created in the crystalline structure and phase transformation occurs, resulting in the structural change from austenite to high-stress phases, such as martensite and bainite. Reference Fenggang Liu, Song, Yang, Song, Guo and Huang26,Reference Zheng, Ye, Jiang, Wang, Liu and Wang27 Moreover, compressive stress is created in three areas because of the higher deformation. Thus, increasing the number of radiation passes leads to increased hardness of the zones up to approximately 222 HV.
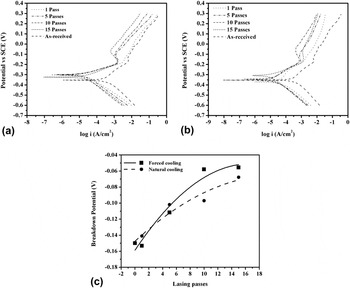
Potentiodynamic polarization behavior of the laser-irradiated samples in 1 M HCl solution under both cooling modes is shown in Fig. 5. The as-received sample shows more corrosion current density than lasing samples. Passive behavior is clearly observed in all cases. The graph shifts upward (more positive potential) in samples irradiated in the cold plate as the number of lasing passes increases. This behavior represents metal oxide coating with fewer defects on the metal with increase in the number of lasing passes. This result shows that the electrochemical reaction occurs during polarization on the surface of the oxide layer, and the corrosive solution has less penetration on the surface of the base metal. Therefore, the use of refrigerant during forming by laser can have an important role in improving the corrosion behavior.
Potentiodynamic polarization curve of the laser-irradiated samples under (a) natural and (b) forced cooling in 1 M HCl; (c) breakdown potential in 1 M HCl related to the laser-formed sample under natural and forced cooling.

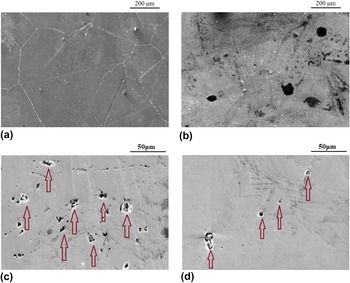
The breakdown potentials of the samples are shown in Fig. 5(c). The breakdown potential increases with the number of lasing passes in both cooling modes. The protection factor of 316 stainless steel is the formation of a protective coating of chromium oxide, such as Cr2O3, on the alloy surface. Reference Tao, Hassan, Song and Han28–Reference Guergova, Stoyanova, Stoychev, Avramova and Stefanov30 If the temperature of the austenitic stainless steel reaches the range of 400–800 °C, chromium content reaches below 12% because of the deposition of chromium carbide (M23C6, M7C3) at the grain boundaries and high energy places. Reference Liu, Yin, Dai, He, Fang, Chen and Dong19,Reference Joham, Sharma, Mondal and Shekhar31–Reference Leiva-García, Fernandes, Muñoz-Portero and García-Antón33 Consequently, chromium oxide layer created on the alloy surface does not possess proper protection capability and is simply destroyed in corrosive environments Reference Jinlong, Tongxiang, Limin and Chen34 because of the creation of chromium-depleted zones. Reference Zheng, Ye, Jiang, Wang, Liu and Wang27,Reference Srinivasan, Kain, Birbilis, Krishna, Shekhawat and Samajdar35 For this purpose, the destroyed grain boundaries after Streicher test are shown in Figs. 6(a)–6(b). It can be seen that the chromium-depleted zones are reduced by the lasing passes increment.
Scanning electron micrograph after Streicher test in 10 wt% oxalic acid: (a) as-received 316 stainless steel and (b) heat-affected zone after 15 passes of lasing; after polarization test in 1 M HCl: (c) as-received 316 stainless steel and (d) heat-affected zone after 15 passes of lasing (some of the pits are marked with arrows).

In this study, an increase in the temperature of the alloy results in the solid-state dissolution, and chromium carbide is decomposed because of laser irradiation. Moreover, a higher percentage of chromium forms the protective oxide layer. The breakdown potential also increases with the number of lasing passes. The slow heat transfer under natural cooling mode results in the deposition of a percentage of soluble chromium in the alloy as chromium carbide at the grain boundaries during the transition from the sensitization temperature (approximately 700 °C). Thus, increasing the number of lasing passes leads to lesser potential breakdown of naturally cooled sample compared with the force-cooled sample. As a comparison, the SEM photograph of the as-received and 15 passes lasing after polarization in Figs. 6(c) and 6(d) shows that the dimension and number of pits on the surface is decreased by lasing.
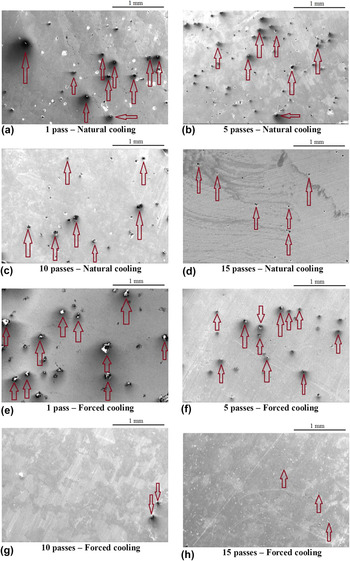
Scanning electron micrographs of laser-irradiated samples under natural and forced cooling are shown in Fig. 7. The results of the potentiodynamic polarization analysis in the initial lasing passes show more severely destroyed coating because of the weak oxide coating protection. Moreover, pits are visible under both cooling conditions. Increasing the number of lasing passes leads to decreased number and size of cavities, indicating increased protection capabilities of oxide coating with the number of lasing passes.
Scanning electron micrographs of the surface of heated zone of the laser forming operations in various passes after potentiodynamic polarization test in 1 M HCl. (a–d) Natural cooling and (e–h) forced cooling (some of the pits are marked with arrows).

IV. CONCLUSION
In this study, the effects of the thermal gradient caused by the laser beam on the deformation of 316 stainless steel under natural and forced cooling modes were investigated. The following conclusions could be drawn from the results of the microstructure, microhardness tests, and potentiodynamic polarization survey:
-
(1) Force cooling during bending of metals by laser leads to a temperature gradient, which increases the bending angle compared with that under natural cooling mode.
-
(2) One lasing pass results in the smaller grain size in the laser-irradiated zone than in the heat-affected zone. This result indicates recrystallization on the metal.
-
(3) Increasing the number of lasing passes provides conditions for grain growth because of the slow heat transfer under natural cooling mode, increasing the grain size with the number of lasing passes. However, under forced cooling mode, the resulting energy on the metal surface leads to stress relief and recrystallization phenomena because of the higher thermal gradient and faster cooling rate. Thus, grain size is finer with increasing number of lasing passes.
-
(4) Under natural cooling, the hardness of 316 stainless steel decreases with increasing number of lasing passes and grain growth. However, under forced cooling, hardness is increased with the number of lasing passes because of the smaller grain size and compressive residual stress caused by the higher cooling rate.
-
(5) The results of potentiodynamic polarization in 1 M HCl show that the breakdown potential increases with the number of lasing passes. This behavior is due to the dissolution of chromium carbide and increased chromium content in the alloy. Thus, the protective layer of oxide shows a greater resistance to pitting corrosion.