

INTRODUCTION
Nematodirus battus Crofton and Thomas, Reference Croffon and Thomas1951 is a parasite of the small intestine of ruminants. It has a simple direct life-cycle, and as a member of the subfamily Nematodirinae (Nematoda: Trichostrongyloidea) the infective third-stage larva develops within the egg. Especially after the first UK nematodirosis battus outbreaks in the 1940's and 1950's the parasite was particularly feared by sheep farmers. In the 21st century, its synchronized hatching of large numbers of larvae in spring still kills an estimated few thousand lambs annually in the UK alone. In affected flocks morbidity and mortality often run at high rates (typically 50–100%, and 5–20%, respectively; Kingsbury, Reference Kingsbury1953; Thomas and Stevens, Reference Thomas and Stevens1956) with substantial impact on animal welfare and farm economics. Viewed over the past 30 years the number of outbreaks diagnosed by the veterinary laboratories agency in the UK has remained fairly stable. However, since the late 1990s a sustained increase in diagnoses has been observed (van Dijk et al. unpublished data) while, over the same time frame, the size of the national sheep flock has slowly but steadily declined. This suggests that the parasite is far from under control.
In a large phylogenetic study Hoberg (Reference Hoberg2005) was able to show that the Nematodirinae originated in the Holarctic with primary distributions determined across Beringia. Some of the species of the genus Nematodirus Ransom, 1907, have since been introduced all over the world. The free-living stages are well adapted to extreme environments, being relatively resistant to low temperatures and desiccation (Hoberg, Reference Hoberg2005), and the genus has become established in a wide variety of climates. Nematodirus battus has so far mostly been confined to the temperate regions of the northern hemisphere. The species was first discovered in Great Britain only in 1951 (Crofton and Thomas, Reference Croffon and Thomas1951) and has since been recorded in Norway (Helle, Reference Helle1969), the Netherlands (Borgsteede et al. Reference Borgsteede, Hendriks and van den Burg1978), Canada (Lichtenfels et al. Reference Lichtenfels, Hoberg and Zarlenga1997), the USA (Hoberg et al. Reference Hoberg, Zimmerman and Lichtenfels1986), Germany (Bauer, Reference Bauer1989), Denmark (Thamsborg et al. Reference Thamsborg, Githigia, Larsen, Nansen and Henriksen1996), Poland (Fudalewicz-Niemczyk et al. Reference Fudalewicz-Niemczyk, Nowosad and Skalska1996), and Sweden (Lindqvist et al. Reference Lindqvist, Ljungstrom, Nilsson and Waller2001). The mass emergence of third-stage larvae (L3) from embryonated eggs in spring is thought to occur only when a period of prolonged exposure to low temperatures (close to zero Celsius) is followed by a rise in temperature to above 10°C (Thomas and Stevens, Reference Thomas and Stevens1960; Christie, Reference Christie1962; Parkin, Reference Parkin1972) and such conditions occur in all of these countries. However, N. battus has also been shown to persist in sheep in Mexico (Sanchez and Quiroz Romero, Reference Sanchez and Quiroz Romero1993) and was recently described as a ‘dominating species’ on Sicily, Italy (Torina et al. Reference Torina, Dara, Marino, Sparagano, Vitale, Reale and Caracappa2004), even though the mean minimum winter temperature rarely drops below 11°C on this Mediterranean island. This raises the question of how far south this economically important parasite could extend its transmission range, and also what climatic conditions are needed for it to become economically damaging. The study of arctic parasites that have moved to warmer regions may in itself provide us with models for future adaptation to global climate change. The ecology of arctic parasites has been shown to be very sensitive to climatic changes (Kutz et al. Reference Kutz, Hoberg, Polley and Jenkins2005; Jenkins et al. Reference Jenkins, Veitch, Kutz, Hoberg and Polley2006b). Of animal species present at higher latitudes, parasites are likely to be among the first to be affected by global warming, due to their strong reliance on temperature for development.
The sparse amount of research conducted on the free-living stages of N. battus is in sharp contrast to its great importance as a disease of livestock. Following its discovery some laboratory and field studies were carried out (e.g. Christie, Reference Christie1962; Gibson and Everett, Reference Gibson and Everett1981), but the behaviour of the parasite at pasture remained insufficiently understood. For example, the existence of a second, autumn peak in larval emergence was described (e.g. Rickard et al. Reference Rickard, Hoberg, Zimmerman and Erno1987) but it is not clear what drives the hatching of these eggs. Here we describe laboratory experiments to determine the vital rates and thresholds that underpin the hatching behaviour of N. battus, with a view to (i) be able to parameterize mathematical models of the field ecology of the parasite, which can assist with the development of control strategies; (ii) determine the potential for an extension of the current global transmission range to warmer climates; and (iii) predict how this originally subarctic parasite will respond to climate change in the regions where it is currently established.
MATERIALS AND METHODS
Egg recovery and larval development
Fresh dung from sheep naturally infected with N. battus was collected at a farm near Bristol, UK and mixed with at least 10 parts of tap water to 1 part of dung in a mechanical blender. The slurry was passed across a coarse sieve of 2·0 mm aperture and then a sieve of 35 μm aperture. In order to remove more roughage, the egg-containing residue on the fine screen was first submitted to 60% sucrose and then 16% NaCl flotation. Remaining roughage was removed by pouring the watery suspension over a flat glass dish and leaving it to stand for 5 min, after which the eggs stuck to the bottom while the roughage could be decanted off. The eggs were collected in filtered tap water and kept in Petri dishes for the development experiments. Faeces were collected from lambs during spring, when trichostrongylid nematodes are present at very low levels, and N. battus eggs – which are readily distinguished from those of other species – comprised the vast majority of those collected.
Three replica Petri dishes, each containing approximately 4000 eggs, were placed in cooled incubators (Sanyo-Gallenkamp, UK) at 11, 11·5, 13, 15, 20, 25 and 30°C, and at 14–20°C (12-hourly fluctuation). Temperature was recorded at 10-min intervals using TinytagPlus® data loggers (Gemini Data Loggers, UK). Each week 200 eggs from each Petri dish were examined in a 1 ml nematode counting slide (Chalex Corporation, USA), under 100× magnification. The proportion of eggs showing development and the proportion of eggs containing larvae were recorded separately, after which the eggs were discarded. If larvae were present in the eggs, approximately 100 larvae were freed from the eggs by crushing them between 2 microscope slides. A drop of Lugol's iodine solution was added and the proportion of larvae that had developed to the larger, sheathed L3 stage was recorded. After the first L3 were found, eggs were examined every 3 days. Each time eggs were examined the Petri dishes were screened for the presence of hatched larvae under a stereomicroscope.
All data were analysed using SPSS statistical software, release 12.0 (SPSS Inc., USA). Correlations between development rates and temperature were assessed by Pearson correlation and linear regression. The developmental threshold temperature was calculated by extrapolating the regression line of daily developmental rate against temperature to the point at which no development was predicted to occur. The number of ‘Degree Days’ required for 50% of the population to develop to L3 DD50 was calculated by deducting the predicted minimum development threshold from the measured temperatures and multiplying by the number of days taken to reach 50% development. These simple techniques are commonly used in entomology (e.g. Williams and Richardson, Reference Williams and Richardson1984; Wall et al. Reference Wall, French and Morgan1992; Ames and Turner, Reference Ames and Turner2003) and have been successfully applied to nematodes (e.g. Samson and Holmes, Reference Samson and Holmes1985; Kutz et al. Reference Kutz, Hoberg and Polley2001). Levene's test was used to test for homogeneity of variance between treatments. The regression model for time to 50% development (D50) as a function of temperature was used to predict the D50 of the 12-hourly fluctuating 14·5–20°C treatment. The distribution of the D50 found in the experiments was assumed to differ significantly from this predicted value if the means were more than 1·96 Standard Deviations apart. The observed time between the discovery of the first L3 and the point at which all eggs that were to produce L3 had done so (tmin–max) at each temperature, and the arcsine transformed percentages of eggs completing development at each temperature, were analysed using one-way Analysis of Variance (ANOVA) and Tukey's pairwise comparison.
Egg survival at higher temperatures
Unembryonated eggs were kept at 30°C for 4 weeks, then placed at 15°C and their development followed as above. The survival of embryonated eggs at higher temperatures was examined by allowing L3 to develop to the pre-hatch stage at 25°C, then comparing the proportion of L3 emerging from eggs immediately subjected to temperatures suitable for hatching, with those kept at 25°C for a further 4 weeks. In each case hatching was stimulated by 5 weeks of chilling at 4°C followed by an increase in temperature to 13°C. Treatments were compared using t-tests on time taken for all eggs to develop, and on arcsine-transformed proportions of eggs hatching.
Hatching
The influence of periods of chilling on the magnitude and timing of the hatch at 15°C
Fresh eggs were kept in a watery suspension at 20°C for 7 weeks, at which time all developing eggs had progressed to the L3 stage. After mixing, the suspension was split into 2 aliquots, one half remaining at 20°C and the other half chilled at a constant 4°C. At 2, 3, 4, 6 and 12 weeks, 3 replicates of approximately 500 eggs were pipetted into 96-well microtitre plates for each treatment, with 2–10 eggs per well in 120 μl of water. The number of viable eggs and the number of larvae, if present, were counted under a stereomicroscope. The plates were sealed with Parafilm® (Pechiney Plastic Packaging, USA) to prevent desiccation and placed at a hatching temperature of 15°C. The number of larvae present in the wells was again counted on Day 1 and from then onwards every other day. The plates were followed until no further hatching was observed in 3 consecutive counts. At each count the plates were screened and wells topped up with filtered water as necessary. In order to assess whether eggs not hatching in the non-chill treatment were actually still viable, and whether they would indeed only hatch after a period of chilling, the eggs of the 4, 6 and 12-week non-chill treatment were, after the initial hatch had finished, placed at 4°C for 4, 6 and 12 weeks, respectively, then put back at 15°C and followed as before. The arcsine-transformed proportion of eggs hatching and the time taken for 50% of the eggs to hatch (t50), were analysed by one-way and two-way analyses of variance (ANOVA) and Tukey's pairwise comparison.
Temperature thresholds for hatching
Eggs were developed to the L3 stage and split into chilled and non-chilled aliquots as above. Three replicate plates of chilled and non-chilled eggs were then placed at hatching temperatures of 6, 9, 11, 13, 15, 17 and 20°C. The number of larvae present in the wells was counted on days 7, 10, 13, 15, 20 and then every 10 days, until no further hatching was observed for 2 consecutive counts. In order to assess the effect of temperatures fluctuating beyond the hatching range, 1 batch of eggs containing L3 was placed at 4°C for 3 months, then pipetted into wells as above and 9 replicates were placed at a hatching temperature of 15°C. On day 10, at which time hatching had commenced, 3 replicates were placed at 6°C and 3 replicates were placed at 20°C. On day 16 these were put back with the other plates, at 15°C. Data were analysed as above.
Larval survival
Larvae that had hatched at 13°C from chilled eggs were divided into Petri dishes and placed at temperatures of −5, 6, 11, 13, 15, 17, 20, 25 and 30°C as well as 12-hourly 14–20°C fluctuation and 6°C with 1 weekly 15-hour ‘night-frost’ of −5°C. To determine whether chilling of eggs affects larval survival, larvae that had hatched at 13°C from eggs that had not undergone any chilling treatment were put at 11, 13, 15, 17 and 12-hourly 14–20°C fluctuations. Two replicates were used for each treatment. Every 10 days, up to day 140 (approximately the length of one summer or winter), 200 larvae from each dish were examined in a 1 ml nematode slide and the number of L3 alive counted. Larvae were assumed to be dead when immobile and in a characteristic stretched out position, and were discarded after counting. Mortality rate was estimated as the slope of the linear regression of log10-transformed proportion of larvae alive against time. Differences between treatments were considered significant when the 95% confidence intervals of the slope parameter did not overlap. The time to 50% survival (L50) and the predicted proportion of larvae alive at 100 days (P100) were calculated from the regression equations. The 100-day survival indicator was chosen because during relatively warm arctic summers the temperature stays above 10°C for approximately 100 days (Kutz et al. Reference Kutz, Hoberg, Nishi and Polley2002).
Egg development and hatching at pasture
After adding a small amount of water, dung from naturally infected sheep was thoroughly mixed in a mechanical blender. The number of eggs per g in the mixture was assessed by performing McMaster egg counts on 15 random samples of 3 g. On 7 July 2005, four heaps of 140 g of mixture, each containing 35 700 eggs (bootstrap 95% CI 33 416–37 984) were placed in the centre of pasture plots 1×1 metre in size. Eggs were also freed from dung as described above and incubated in water at 20°C. On 30 September 2005, after 7 weeks of incubation, these non-chilled embryonated eggs were divided into 4 aliquots of 20 000 (bootstrap 95% CI 18 968–21 032) in 20 ml of water and evenly spread out over the central 50×50 cm of 1×1 metre plots. Soil temperature in the upper 1·5 cm of soil, between the grass roots, and rainfall were recorded by a Skye MiniMet weather station (Skye Instruments Ltd, UK). From 8 September 2005 onwards, once a month, grass on all 8 plots was cut with scissors at a height of 1·5 cm and removed (i.e. sampled without replacement). The number of N. battus larvae present on the herbage was assessed by the method described by Eysker and Kooyman (Reference Eysker and Kooyman1993). Sampling continued until June 2006. During January and February 2006 grass growth was too limited to sample the plots.
RESULTS
Larval development
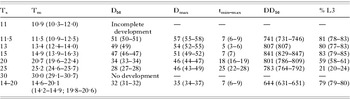
Results of egg development at various temperatures are shown in Table 1. Below 11·5°C eggs did not reach the L3 stage and at 30°C no development occurred at all. Linear extrapolation from the proportion of eggs developing at 15, 20 and 25°C predicted the upper development temperature to be 28°C. However, at higher temperatures faster development was offset by a reduction in the number of eggs developing such that towards the upper end of the temperature range the proportion of eggs reaching the L3 stage was greatly reduced. Differences in the proportion of eggs developing to L3 at different temperatures proved significant (F 5,17=167·8, P<0·001). There was no difference between the 11, 13, 15 and 14–20°C treatments (Tukey's P⩾0·297), but at the 20°C treatment significantly fewer eggs developed (P<0·001) while at 25°C fewer eggs developed than at 20°C (P<0·001). The optimum temperature for development was therefore estimated to be close to 15°C.
Egg development at various temperatures
(Ts=temperature setting; Tm=mean measured temperature; D50=average day 50% of the eggs had completed their development; Dmax=average day development of all eggs was completed; tmin–max=time between the detection of the first L3 and the completion of development (in days); DD50=average number of Degree Days to 50% development; % L3=percentage of the eggs present at the start of the experiment completing development. Presented percentages and days are all rounded up to the nearest integer. The ranges are given in parentheses.)

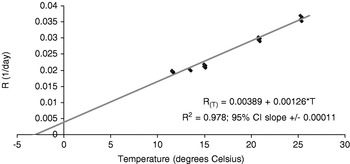
The daily development rate to 50% egg development increased significantly with temperature (Pearson r p=0·98, P<0·001) and is given in Fig. 1A. Extrapolation of the regression line predicted the minimum development threshold to be −3·01°C.
Regression of daily development rate (R) on temperature. Please note that not all 15 data points are visible as the result of overlap.

The number of days to 50% development (D50) decreased significantly with increasing temperature (r p=−0·99, P<0·001) and the regression line is described by D50=72·4−1·80*T (R 2=0·986, 95% CI slope +/−0·128). This model predicts the D50 of the fluctuating 14·5–20°C treatment to be 41·3 days. The measured D50 of all treatments listed in Table 1 showed homogeneity of variance (L=0·20, P=0·956) and the maximum within-treatment standard deviation was 0·57. Using the criterion that a separation of more than 1·96 times the standard deviation indicates a significant difference, development rate was increased by fluctuation in temperature.
The time taken between the onset and completion of development (tmin–max) differed significantly between treatments (F 5,17=56·14, P<0·001). There was no significant difference in tmin–max at 11, 13, 15 and 14–20°C (P⩾0·775), but at 20°C more time was taken to complete the development of all eggs (P<0·001). At 25°C, tmin–max was again significantly longer than at 20°C (P=0·006).
Egg survival at higher temperatures
The time taken for development of L3 was not influenced by storage at 30°C (t 2=0·71, P=0·518). However, the proportion of eggs that successfully hatched was reduced to 65% (from 83% at 15°C without exposure to higher temperatures; t 2=9·4, P=0·003). The proportion of live L3 hatching was not significantly reduced by storage of embryonated eggs at 25°C (t 2=0·99, P=0·38).
Hatching
The influence of periods of chilling on the magnitude and timing of the hatch at 15°C
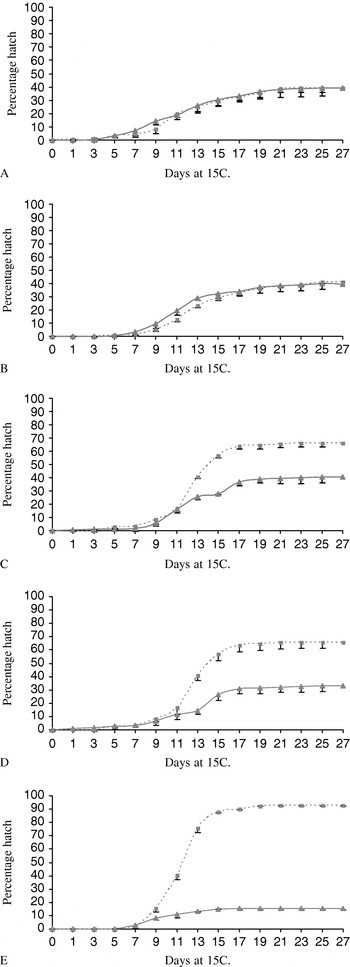
Hatching profiles of the chilled and non-chilled eggs are shown in Fig. 2. Overall the percentage of eggs hatching was significantly higher after chilling (F 1,29=432·9, P<0·001) and also increased significantly with the duration of chilling (F 4,29=26·1, P<0·001; interaction term F 4,29=110·3, P<0·001). In relation to individual treatments there was no significant difference between the 2- and 3-week chill and the controls (P=0·98), but chilling for 4 or more weeks increased the proportion of eggs hatching (P<0·001). Within the range of treatments where chilling had an effect there was no difference between 4 and 6 weeks of chilling (P=1·00), but significantly more eggs hatched after 12 weeks of chilling (P<0·001). In the non-chilled treatments the proportion of eggs hatching decreased after storage at 20°C (F5,17=56,7, P<0·001). However, this decrease was only significant in the 12-week treatments (P=0·002) and not in the 4- and 6-week treatments (P=0·070). A large proportion of these eggs that did not initially hatch were stimulated to hatch after subsequent chilling. In the 4- and 6-week treatments, the total proportion of eggs hatching in this 2-phased hatch was not significantly different to that hatching after chilling alone (t 2=2·6, P=0·059 and t 2=2·7, P=0·074), suggesting that embryonated eggs can survive at least 6 weeks at 20°C without significant larval death. Although the proportion hatching after 12 weeks at 20°C followed by 12 weeks at 4°C was significantly reduced relative to chill alone (t 2=7·8, P=0·016), live L3 were still recovered from 81% (range 80–82) of the eggs, compared with 92% (range 92–93) after chilling.
The influence of 2 (A), 3 (B), 4 (C), 6 (D) and 12 (E) weeks of chilling on the hatching of eggs at 15°C. Eggs were chilled for the specified time at 4°C (dotted lines), or kept at a control temperature of 20°C (solid lines), before each treatment was placed at 15°C for hatching. Horizontal axis=the number of days spent at hatching temperature; vertical axis=cumulative percentage of eggs hatching. Error bars represent standard deviations.

All 10 treatments completed 50% of hatching between the start of Day 11 and the end of Day 13. Although the variance of the t 50 of the total of 30 replicates was very small (0·49), the 6-week treatments (both chill and non-chill) took significantly longer (P=0·011) to hatch than the 2- and 12-week treatments (F 4,29=5·4, P=0·004). However, there was no significant difference in t 50 between chill and non-chill treatments (F 1,29=2·8, P=0·111; interaction term between weeks of treatment and chilling F 4,29=0·83, P=0·52).
Temperature thresholds for hatching
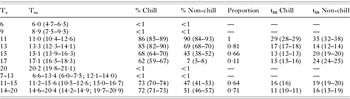
The proportion of eggs hatching in each treatment group, and their respective t 50, are given in Table 2. In the treatments where hatching occurred, both lower temperatures and chill treatment significantly increased the percentage of eggs hatching (F 5, 35=203·7, P<0·001 and F 1,35 =152·3, P<0·001, respectively; interaction term F 5,35=24·3, P<0·001). Among the chill treatments hatching at steady temperatures, there was no difference in the proportion of eggs hatching at 11 or 13°C, or at 15 or 17°C, (P⩾0·89). However, significantly more eggs hatched at 11 and 13°C than at 15 and 17°C (P⩽0·001). In the non-chill treatments hatching at steady temperatures significantly fewer eggs hatched each time the temperature was raised by 2°C (P<0·001). Similarly, the eggs hatching without chill, expressed as a proportion of the egg population hatching after chill treatment, decreased with temperature (F 5,17=136·3, P<0·001), a smaller proportion of the egg population hatching without chilling at each 2°C increase (P⩽0·04). The magnitude of the hatch of both the chilled and non-chilled 11–15°C and 14–20°C fluctuating treatments did not differ from that at a constant 15°C (P⩾0·80).
Hatching of eggs at various temperatures
(Ts=temperature setting; Tm=mean measured temperature; % chill and % non chill=mean percentage hatching in the chilling and non-chill treatments, respectively; Proportion=average of eggs hatching without chilling as a proportion of the average of eggs hatching after chilling; t50 Chill and t50 Non-chill=mean time (in days) to 50% hatch in the chill treatments and non-chill treatments, respectively. All measurements are rounded up to the nearest integer. Ranges are given in parentheses.)

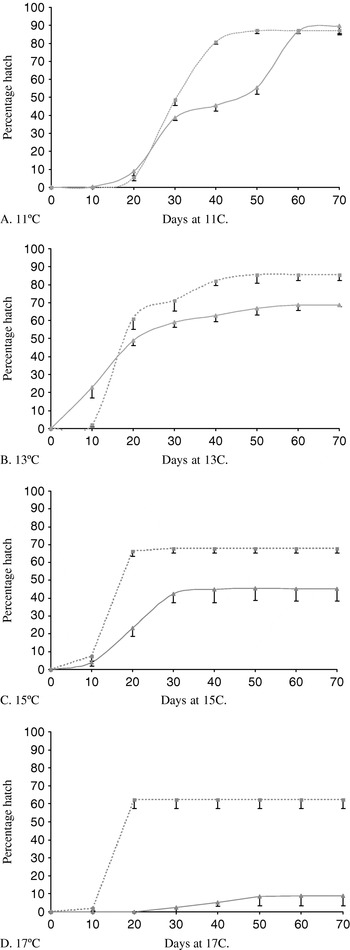
Differences in t 50 were highly significant between temperature treatments (F 5,35=203·7, P<0·001) and between chill and non-chill treatments (F 1,35=152·3, P<0·001; interaction term F 5,35=24·3, P<0·001). The timing of the chilled hatch was different from that of the non-chilled hatch at all temperatures (P⩽0·01) except the 11–15°C fluctuating treatment (P=0. 06). It was found that 13°C was the only setting at which the t 50 of the chill treatments was higher than that of the non-chill treatment. As shown in Fig. 3, hatching behaviour at 11°C without chilling was different from those at all other constant temperatures. The final proportion of eggs hatching at 11°C was higher than at other temperatures. However, 11°C initially proved a relatively weak stimulus for the hatching of chilled eggs, the maximum hatch only being reached after approximately 40 days. Hatching of non-chilled eggs at 11°C reached a plateau around day 30, after which little hatching occurred over the following 20 days, while the peak hatch was reached on day 60. Comparison of the shapes of these hatching patterns strongly suggests that a large proportion of the non-chilled eggs completed a chilling process at 11°C before proceeding onto hatching.
Hatching of non-chilled (solid lines) and chilled (dotted lines) eggs at varying temperatures. On the horizontal axis the number of days at the given hatching temperature is given, on the vertical axis the cumulative percentages of eggs hatching. Error bars represent standard deviations.

Interrupted hatching
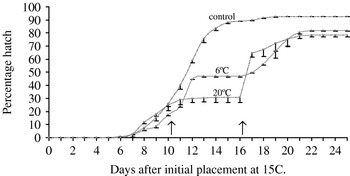
The effect of fluctuations outside the temperature range for hatching is shown in Fig. 4. When hatching eggs were placed at 20°C the hatching process halted abruptly and resumed equally abruptly when the eggs were placed back at 15°C. Similarly, eggs put at 6°C halted their hatching process but it took a day or two longer for this to take effect.
The influence of temperatures outside the hatching range on the hatching process; The horizontal axis represents the number of days at hatching temperature, the vertical axis represents the percentage of embryonated eggs hatching. The control was kept at 15°C continuously but treatments 6°C and 20°C were placed at these temperatures on Day 10 of the hatching process (first arrow) and back at 15°C on Day 16 (second arrow); Error bars represent standard deviations.

Larval survival
Chilled larvae
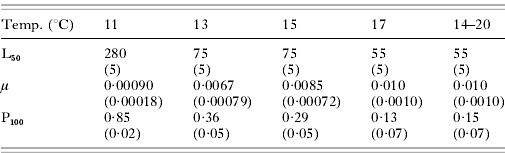
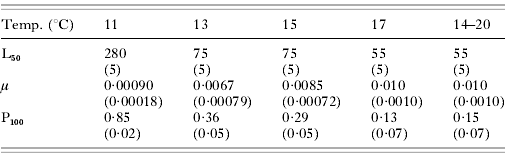
Log10 of surviving L3 was highly significantly correlated with time for all treatments (P⩽0·002). Survival characteristics are given in Table 3. At −5°C and at 6°C+ frost, survival was significantly better than at 6°C. Mortality rate did not differ at 6, 11, 13 and 15°C. At 17°C, however, larval survival decreased. At fluctuating 14–20°C larvae appeared hyperactive and died significantly quicker than at a constant 17°C. Using the criterion of non-overlapping confidence intervals of the regression slope, mortality rate increased significantly at each 5°C increment above 17°C.
Survival of chilled larvae
(L50=time (in days) to 50% survival (rounded up in 5 day intervals); μ=the slope of the log linear regression line and equals the instantaneous daily mortality rate; P100=the predicted proportion of larvae surviving for 100 days at a given temperature; 95% confidence intervals (plus or minus) are given in parentheses.)

Non-chilled larvae
Log10 of surviving L3 was significantly correlated with time for all treatments (P<0·001). Survival parameters can be found in Table 4. At 13, 15 and 17°C, death rates were higher than in chilled larvae kept at the same temperatures. Also, between the non-chilled treatments, with each 2°C increase survival rates decreased significantly. No differences in mortality rate were found between constant 17°C and fluctuating 14–20°C treatments.
Survival of non-chilled larvae
(L50=time (in days) to 50% survival (rounded up in 5 day intervals); μ=the slope of the log linear regression line and equals the instantaneous daily mortality rate; P100=the predicted proportion of a larva surviving for 100 days at a given temperature; 95% confidence intervals (plus or minus) are given in parentheses.)
Egg development and hatching at pasture
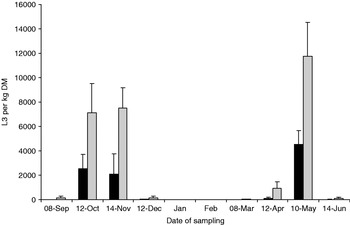
From 30 September 2005 to 3 November 2005 the minimum and maximum temperatures both remained between 10 and 17°C, for a total of 35 days. In the following spring similar temperatures were experienced for 13 days, between 15 April 2006 and 27 April 2006. As Fig. 4 shows, both these periods were followed by peaks of larval emergence, both at the plots where eggs had been placed in the embryonated development stage and at plots where un-embryonated eggs in dung had been placed out. The model for daily development described above predicted that the latter eggs should have completed larvation by 12 August 2005. However, in comparison to the plots seeded with embryonated eggs, fewer larvae than expected were recovered, even if the percentages of non-developing eggs found in the laboratory experiments were deducted. The weeks after the dung was placed at pasture were very dry and the desiccated heaps disintegrated very slowly. On 10 October 2005 samples of dung remaining at pasture were examined and only perished and non-developing eggs were detected. It appears from Fig. 5 that in autumn, either hatching took place over a longer period of time or larvae were longer lived than in spring.
The hatching of non-embryonated eggs put out at pasture on 7 July 2005 (black bars) as measured between 8 September 2005 and 14 June 2006, and of embryonated eggs put out on 29 September 2005 (grey bars) measured between 12 October 2005 and 14 June 2005. On the vertical axis the average number of larvae recovered, expressed as L3 per kg dry matter of herbage, is given. The error bars represent the standard deviations (n=4).

DISCUSSION
This paper describes, for the first time, the vital rates and thresholds of the free-living stages of the parasite Nematodirus battus. In addition, other characteristics of epidemiological importance came to light during the laboratory and field experiments:
Although consistently higher proportions of chilled than non-chilled eggs hatched, a substantial proportion of larvae was able to hatch without any prior chilling treatment. At a hatching temperature of 13°C, for example, 81% of the embryonated egg population hatched regardless of chilling experience while the remainder hatched only after chilling processes had been completed. This hatching of proportions of the population as non-chilled larvae in the laboratory, that was subsequently demonstrated at pasture, was also observed first by Gibson and Everett (Reference Gibson and Everett1981) and later by Rickard et al. (Reference Rickard, Hoberg, Zimmerman and Erno1987, Reference Rickard, Hoberg, Bishop and Zimmerman1989).
There is not only a lower temperature threshold for hatching but also an upper threshold. To our knowledge this is the first published evidence for the existence of such a threshold in trichostrongyloids. Also, in contrast to previously published work indicating that hatching of chilled eggs only occurs when the temperature rises above a threshold of 10°C (e.g. Thomas and Stevens, Reference Thomas and Stevens1960; Christie, Reference Christie1962; Dunn, Reference Dunn and Dunn1978; Ash and Atkinson, Reference Ash and Atkinson1986) it is not a rising temperature per se that is the stimulus for hatching but a certain temperature range. The range of constant temperatures at which hatching is possible, approximating 11–17°C, is very narrow and close to the temperature range for optimum egg development. When the temperature moves out of this hatching range, hatching is halted abruptly but continues again as soon as hatching range temperatures are restored. Hatching appears to be a function of cumulative within-threshold temperature experience.
When chilled egg populations experience temperatures within the hatching range, fewer eggs hatch towards the higher end of the hatching range. For those non-chilled eggs that hatch, this decrease is much more pronounced. Also, the timing of the hatch varies with the hatching temperature. The optimum temperature, maximizing both hatch magnitudes and hatching rates, is 13°C. The peculiar hatching behaviour of the parasite seems targeted towards maximizing the survival of hatched larvae. Survival times of chilled larvae were shorter above the hatching threshold. Death rates of non-chilled larvae were significantly higher than those of chilled larvae kept at the same temperatures, while they also increased with each 2°C increment within the hatching range. The difference in longevity of chilled and non-chilled larvae may be explained by the quality of their respective energy reserves. In parallel with many species of insect (Morrissey and Baust, Reference Morrissey and Baust1976), N. battus larvae transform their lipid reserves into carbohydrates (trehalose) during the chilling process (Ash and Atkinson, Reference Ash and Atkinson1983, Reference Ash and Atkinson1986). Higher carbohydrate content has been linked with increased nematode longevity (Patel et al. Reference Patel, Stolinski and Wright1997; Patel and Wright, Reference Patel and Wright1997).
Regarding the influence of fluctuating day and night temperatures on the hatching behaviour of N. battus, hatching did not take place when temperatures fluctuated between temperatures below and within the hatching range, while fluctuations within the range did not alter the expected hatching patterns. However, given the results of the hatching experiments at continuous temperatures, hatching in response to fluctuations around the upper threshold gave unexpected results, significant hatching taking place. One explanation could be that, at fluctuating temperatures, hatching continues as long as the average temperature lies within the hatching range. It is also possible that hatching is induced by certain fluctuations around the upper threshold per se, for example as the result of increased activity of larvae as the result of these fluctuations. Hyperactivity of larvae in the eggs has been linked with hatching (Parkin, Reference Parkin1972) and in our experiments hatched larvae, at fluctuating 14–20°C, were observed to be more active than in any of the other treatments, while the larvae emerging from chilled eggs were significantly shorter lived than those kept at the mean of 17°C. Hatching as the result of these fluctuations could explain the presence of small numbers of larvae at pasture throughout the grazing season, as recorded by several workers (e.g. Graham et al. Reference Graham, Harris and Ollerenshaw1984; Thomas, Reference Thomas1991). However, in the incubator the fluctuations, taking place over 20 min, are unnaturally abrupt and the existence and importance of this type of hatching would have to be verified at pasture.
None of the temperature-dependent death rates can explain the typical recovery rates of L3 from herbage, which are typically reduced to approximately 20% of the peak recovery within the first month post-hatching and then gradually to zero over the following 2 months (Thomas, Reference Thomas1959; Gibson, Reference Gibson1963; Boag and Thomas, Reference Boag and Thomas1975; Graham et al. Reference Graham, Harris and Ollerenshaw1984). N. battus L3 have been shown to be extremely resistant to desiccation (Parkin, Reference Parkin1972) and therefore factors other than temperature and rainfall must contribute to larval death in temperate regions.
From the magnitude and the pattern of the hatch of non-chilled eggs at 11°C, and survival rates of non-chilled larvae at 11°C, which were the only ones not to differ from the rates of their chilled counterparts, it appears that 11°C is the upper threshold temperature for ‘chilling’ experience. In a minimum of 4 weeks the biochemical processes taking place during chilling can be completed.
Apart from the hatching temperature, the hatching ‘motivation’ of the eggs is also influenced by the time that embryonated eggs spend in conditions adverse to hatching. For example, although the minimum time in which the chilling processes can be completed is 4 weeks, prolonged chilling can further increase the percentage of the egg population hatching. Extended spells at 20°C, however, decreased the percentage hatching, even though the eggs were shown to be viable as they hatched after chilling.
Not only hatching but also egg development took place in a highly synchronized manner. At lower, and at fluctuating, temperatures, all eggs completed their development approximately within the same week. Development time of egg populations is therefore very well characterized by D50.
Survival rates of both embryonated and non-embryonated eggs, during long spells of continuous high temperatures, were much higher than those of hatched L3 larvae. However, although this shows that the parasite population will be able to survive high temperatures at pasture, it thrives at lower temperatures. This was demonstrated by the fact that, at temperatures in the lower part of the development range, higher proportions of eggs developed in a more synchronized manner.
The standard techniques in use for determining the minimum development threshold (T0) predicted development to cease at the highly unlikely value of −3°C. It is widely recognized that such linear extrapolation techniques do not necessarily represent the true T0 (Ames and Turner, Reference Ames and Turner2003). However, the predicted T0 normally over-estimates the true figure but under-estimated it by 11·5°C for N. battus. Although predicted T0 has proven to be reliable for certain subarctic parasites (Jenkins et al. Reference Jenkins, Kutz, Hoberg and Polley2006a), extrapolated T0 values should always be verified in the laboratory.
In line with the work of Salih and Grainger (Reference Salih and Grainger1982) and Saunders et al. (Reference Saunders, Tompkins and Hudson2002) temperature fluctuations were shown to significantly increase development rates. At fluctuations quite accurately reflecting UK day and night soil temperatures during the spring and early summer, development was completed in approximately two-thirds of the expected time. These fluctuations did not affect the synchronization of egg development.
At pasture, development and hatching appeared to take place in line with the findings of the laboratory experiments. N. battus eggs cannot develop in dung. This also emerged from work by Gibson and Everett (Reference Gibson and Everett1981). Faecal breakdown rates, which are strongly influenced by local weather, may therefore play an important role in the epidemiology of this parasite.
The epidemiology of N. battus on farms in temperate regions can be better understood by taking into account these results. As was also shown by Thomas and Stevens (Reference Thomas and Stevens1960) and Gibson and Everett (Reference Gibson and Everett1981), eggs resulting from spring infections will invariably be fully developed by the end of the summer. A proportion of these will hatch at the first opportunity, in autumn, when minimum and maximum temperatures are within the hatching range for prolonged periods of time. The remaining eggs undergo chilling at pasture during the winter and hatch the following spring. As the minimum temperature for development lies within the hatching range, and temperatures fall in autumn, eggs deposited at pasture as the result of autumn infections will not be fully developed by the time the next window of opportunity for hatching arises in spring. Some of the autumn-deposited eggs will therefore hatch the following autumn, having not experienced chilling at the embryonated stage, and the remainder a year and a half after deposition, in the following spring. Thus, in general, a spring peak arises from eggs deposited the previous spring and the autumn before that, while an autumn peak results from eggs deposited during the spring of the same year and the autumn of the previous year. However, as it takes approximately 8 days for the first larvae to emerge and another 8–10 days for the hatching process to be completed, in some years, the temperature may rise above the upper hatching threshold or fall below the lower threshold before all eggs complete hatching. In this case a proportion of the eggs may carry over to the next window of opportunity. This may be the next spring or autumn but could also be a cold spell during the summer. Although the effects of long-term survival of eggs at pasture on the ability of larvae to infect the host have not been established, and larval emergence does not have to equal transmission (Rickard et al. Reference Rickard, Hoberg, Bishop and Zimmerman1989), the above appears to explain the large between-year variations of not only the magnitude of spring and autumn peaks but also of the number of reported cases of nematodirosis (van Dijk et al. unpublished data). It also suggests that viewing nematode population dynamics in varying environments in terms of limited windows of opportunity for transmission, rather than more gradual flows through development stages driven by undulating mean temperatures, might be helpful in characterizing and predicting epidemiological patterns (Morgan et al. Reference Morgan, Milner-Gulland, Torgerson and Medley2004).
The minimum egg development threshold value of 11·5°C is approximately twice as high as that of Teladorsagia circumcincta (Young et al. Reference Young, Anderson, Overend, Tweedie, Malafant and Preston1980), also an arctic-adapted Trichostrongyloid, and perhaps even higher than that of Haemonchus contortus (Gibson and Everett, Reference Gibson and Everett1976; Besier and Dunsmore, Reference Besier and Dunsmore1993), a species of tropical origin. The patterns of within-threshold egg development rates, the hatching thresholds and rates themselves, and the larval survival characteristics also do not seem to fit a parasite experiencing summers with maximum temperatures of 20–30°C and winters with minimum temperatures just below zero. The supercooling point of embryonated eggs before chilling has been shown to be as low as minus 34°C (Ash and Atkinson, Reference Ash and Atkinson1986) and thus the mechanism of lowering the supercooling point further by accumulating trehalose during chilling seems irrelevant to over winter survival in the temperate regions. However, the minimum development temperature fits that of other parasites of subarctic origin needing similar numbers of degree-days for the completion of their non-parasitic development phase (Schjetlein and Skorping, Reference Schjetlein and Skorping1995; Kutz et al. Reference Kutz, Hoberg and Polley2001). Schjetlein and Skorping (Reference Schjetlein and Skorping1995) showed that there is likely to be adaptation of subarctic parasites towards these higher minimum temperature thresholds as they may prevent nematodes from entering the winter at developmental stages most sensitive to very low temperatures. Following this hypothesis, a fall below 11·5°C would mark the end of the arctic summer and the point at which development would certainly not be completed before the start of the period of permanent frost. During the arctic autumn, soil temperatures remain between 10 and 0°C for approximately 1 month, before dipping far below zero, according to our findings, leaving enough time to complete the processes leading to increased cold hardiness (Ash and Atkinson, Reference Ash and Atkinson1986) of embryonated eggs. For most of the arctic summer, during which day-night temperature fluctuations are very small, temperatures normally stay within the 10–15°C range and rise above 20°C only during exceptionally warm summers (Kutz et al. Reference Kutz, Hoberg, Nishi and Polley2002). At these temperatures all the responses to temperature described in this paper fall into place. Our work therefore supports the hypothesis that N. battus has an Arctic origin. In the temperate regions, the high temperature threshold for development, the inability to apply thermal energy at higher temperatures, and the narrow hatching range are unlikely to be beneficial to the parasite. Thirty-five years ago, Parkin (Reference Parkin1972) also described that at 20 and 25°C “the majority of the eggs did not reach the third stage”. It would appear that the adaptation of nematode enzyme temperature thresholds to new environments either falls beyond the scope of genetic plasticity or are slow to occur. The detailed studies by Troell et al. (Reference Troell, Mattsson, Alderborn and Hoglund2003, Reference Troell, Waller and Hoglund2005, Reference Troell, Tingstedt and Hoglund2006), addressing possible adaptations of H. contortus to colder environments, found evidence for such adaptations neither at phenotypic nor at genotypic level. These findings may have important implications for the adaptability of parasites to future climate change.
Rose and Jacobs (Reference Rose and Jacobs1990), working in subarctic Greenland, showed that the epidemiology of Nematodirus spathiger, N. abnormalis and N. helvetianus in these regions is characterized by low numbers of larvae spread out over large areas, leading only to trickle-type infections. In such environments with low host densities larval survival is likely to be crucial to the persistence of parasite populations and there is unlikely to be selection for the hatching of non-chilled eggs, whose larvae survive less well than those hatching from chilled eggs. The synchronized hatch of larvae has, in the temperate regions, been interpreted as a synchronization of maximum larval availability with the presence of susceptible hosts, i.e. a strategy targeted at mass invasion of the host. However, it may originally have been targeted at maximizing the probability of being ingested at all, by ensuring that larvae were present as soon as the herbage started to grow, and throughout the grazing season. The mass invasion of hosts, sometimes leading to their death, may just be an artefact of this behaviour in situations of unnaturally high host density. As host densities are determinants of parasite abundance (Arneberg et al. Reference Arneberg, Skorping, Grenfell and Read1998), very low-level abundance in free roaming non-domesticated animals could explain why the origins of N. battus have remained enigmatic (Jansen, Reference Jansen1973). Increased host density, in combination with increased predictability of host grazing behaviour, and different climatic conditions impacting on larval survival, are likely to have made a hatching strategy that maximizes larval survival redundant. Instead, the common practice on UK farms of avoiding grazing of young lambs on pasture used by lambs the previous spring, in an attempt to evade infection with N. battus larvae emerging from the previous year's egg deposition, may have made transmission at other times of the year a necessity for the persistence of the species. Increased between-year fluctuation in spring hatching conditions in temperate areas compared with the Arctic would, at the same time, cause greater uncertainty in hatching conditions. If all eggs required chilling before hatching, and spring temperature rose above the upper threshold before hatching was completed, larval emergence would be delayed by at least a full year. By ensuring that a proportion of eggs hatch without chilling, larvae will be available to infect hosts in autumn and secure one worm generation per year, improving the chances of persistence and population growth. Bet-hedging strategies have been linked with increased environmental uncertainty in many systems (e.g. Philippi and Seger, Reference Philipi and Seger1989; Fenton and Hudson, Reference Fenton and Hudson2002; Meyers and Bull, Reference Meyers and Bull2002), and phenotypic plasticity in N. battus hatching requirements may be an example of such a strategy. Mass invasion of young hosts by larvae in the spring peak leads either to rapid worm expulsion within 3 weeks of the initial infection in the majority of hosts (Gibson and Everett, Reference Gibson and Everett1963; Taylor and Thomas, Reference Taylor and Thomas1986) or to host death before eggs are produced. Lower level, trickle-type, infections have been shown to enhance total egg production in other gastrointestinal nematodes (Grenfell et al. Reference Grenfell, Smith and Anderson1987; Barger and Le Jambre, Reference Barger and Le Jambre1988; Christensen et al. Reference Christensen, Barnes and Nansen1997), and these eggs mitigate the risk of extinction of N. battus populations that otherwise rely on a single mass infection event each year. There are, on the other hand, clear advantages to a mass hatch. By infecting hosts in spring before other gastrointestinal parasite species, N. battus could avoid competition and cross-immunity. On many farms where N. battus was introduced N. spathiger and especially N. filicollis were already established and successful but quickly gave way to N. battus, which became the dominating species (Helle, Reference Helle1969). Mass invasion at sublethal levels could also promote maturation of a large number of worms and production of eggs before the time-lagged host immune response becomes effective. Retention of mass hatching, alongside the release of a smaller proportion of larvae outside the main transmission window, might represent the best chance of parasite persistence in an unpredictable environment.
If N. battus is indeed bet-hedging, differences in selective pressure between regions in the UK, or even differences in the management of neigbouring farms, might result in differences in hatching behaviour between field isolates. Most of the earlier work on the parasite did not describe significant hatching without chilling or larval appearance on pasture in autumn (Thomas, Reference Thomas1959; Thomas and Stevens, Reference Thomas and Stevens1960; Gibson, Reference Gibson1963; Boag and Thomas, Reference Boag and Thomas1975). Other workers (Parkin, Reference Parkin1972; Ash and Atkinson, Reference Ash and Atkinson1986) detected a significant hatch in the non-chilled treatments but did not comment on this. Gibson and Everett (Reference Gibson and Everett1981) described significant autumn hatching at pasture for the first time. A few years after this publication, increased larval availability in autumn leading to deaths in lambs was signaled in the veterinary press (McKellar et al. Reference McKellar, Bairden, Duncan and Armour1983; Rodger, Reference Rodger1983). Thomas (Reference Thomas1991) researched the hatching patterns of 2 isolates, 1 lowland and 1 hillside, on both lowland and upland farms, and remarked on the distinct differences in hatching patterns. Thomas proposed that differences in hatching patterns might be heritable and plastic.
From a more global perspective, bet-hedging has two distinct advantages for N. battus. Firstly, the ability to hatch without chilling means that the parasite is not dependent for its survival on climatic regions where the temperature drops to or below 11°C for at least 1 month each winter. This potentially enables a massive expansion of global habitats. N. battus, whose eggs are also able to survive temperatures as low as minus 50°C (Ash and Atkinson, Reference Ash and Atkinson1986), could in principle become established and persist in any region where temperatures stay below 25°C for at least 6–7 weeks per year and hatching temperatures stay within the 11–17°C range for 2–3 weeks per year. Prolonged periods of temperatures of 25–30°C pose little threat to the eggs. High temperatures will increase death rates of infective larvae but at high host densities this is not necessarily followed by extinction of the parasite population. The establishment of N. battus on Sicily (Torina et al. Reference Torina, Dara, Marino, Sparagano, Vitale, Reale and Caracappa2004) and Mexico (Sanchez and Quiroz Romero, Reference Sanchez and Quiroz Romero1993) most likely demonstrates expansion outside the area in which chilling of eggs takes place. Adaptation to the temperate regions may therefore have been a stepping stone to further southward expansion. Secondly, in the face of climate change this parasite, originally thriving in the cold, has a much higher chance of persistence in temperate areas as a result of its ability to hatch without chilling. Increases in maximum temperatures, and day-night fluctuations over a greater temperature range, will quite likely lead to a decreased number of days on which hatching is possible. In this new environment with increased hatching uncertainty the bet-hedging parasite will be more likely to complete its hatch and enhance prospects for host infection and persistence.
JvD gratefully acknowledges the support of BBSRC (UK) through a Veterinary Research Fellowship Studentship. The authors are indebted to the Amos family of Lower Failand Farm, nr. Bristol, for free access to the farm, for regular help with the collection of samples, and for making pasture plots available.