INTRODUCTION
The fatty acid composition of Brassica oil determines its physical and chemical properties. The seed oil of standard Ethiopian mustard (Brassica carinata A. Braun) is characterized by a high proportion of erucic (C22:1), linoleic (C18:2) and linolenic (C18:3) acids, which together account for about 0·75 of the total oil fatty acids. The remaining 0·25 corresponds to the fatty acids palmitic (C16:0), stearic (C18:0), oleic (C18:1) and eicosenoic (C20:0) acids (Getinet et al. Reference Getinet, Rakow, Raney and Downey1997).
The use of mutagenesis permitted the development of Ethiopian mustard lines with specific fatty acid profiles, such as lines with a high C18:1 content (L-482 with >200 g/kg; Velasco et al. Reference Velasco, Fernández-Martínez and De Haro1997), with a low C18:1 content (L-1806 with <110 g/kg; Velasco et al. Reference Velasco, Fernández-Martínez and De Haro1997), and lines with low and high C22:1 contents whose genetics have been reported in previous studies (Del Río et al. Reference Del Río, De Haro and Fernández-Martínez2003) (L-2890 and L-1630 with about 100 and >500 g/kg, respectively; Velasco et al. Reference Velasco, Fernández-Martínez and De Haro1997, Reference Velasco, Fernández-Martínez and De Haro1998; De Haro et al. Reference De Haro, Del Río, Velasco, Dominguez and Fernández-Martínez2001). These oils with specific fatty acid profiles are in demand because of their improved nutritional and/or technological properties (Kinney Reference Kinney1994).
Vegetable oils with a high content of C18:1 are of interest for nutritional and industrial purposes. The reduction of the levels of polyunsaturated fatty acids and their substitution for the monounsaturated C18:1 is an important goal for the development of higher quality mustard oil (Scarth & McVetty Reference Scarth, McVetty, Wratten and Salisbury1999). The high C18:1 oil can be heated to a higher temperature without smoking, so that the cooking time is reduced and food absorbs less oil (Miller et al. Reference Miller, Zimmerman and Vick1987). A diet containing a high content of C18:1 can reduce the content of the undesirable low-density lipoprotein cholesterol in blood plasma (Grundy Reference Grundy1986) and monounsaturated fatty acids more effectively prevent arteriosclerosis than polyunsaturated fatty acids (Chang & Huang Reference Chang and Huang1998). Therefore, efforts have been made to develop high C18:1 and zero C22:1 genotypes of B. carinata using different strategies (interspecific crossing, mutagenesis, etc.).
Nevertheless, their usefulness for commercial exploitation will depend on the adequate integration of the genes controlling the altered biosynthetic pathway into inbred lines with a high potential to develop agronomically acceptable hybrids. This requires prior knowledge on how both traits (C18:1 and C22:1) are inherited (Takagi & Rahman Reference Takagi and Rahman1996).
Different segregation patterns were found in Brassica napus depending on the populations used for the genetic study of the C18:1. These genetic studies indicated that the high C18:1 trait was controlled by one locus (Rücker & Röbbelen Reference Rücker and Röbbelen1997; Schierholt et al. Reference Schierholt, Rücker and Becker2001), two loci (Schierholt et al. Reference Schierholt, Rücker and Becker2001) and four loci (Chen & Beversdorf Reference Chen and Beversdorf1990). Chen & Beversdorf (Reference Chen and Beversdorf1990) reported the inheritance of C18:1 and C22:1 in three homozygous microspore-derived populations of spring rapeseed (B. napus L.); in the study, accumulations of C22:1 and C18:1 were influenced by the same two loci, which control the chain elongation steps leading from C18:1 to C22:1. C18:1 was further influenced by at least two additional segregating loci involved in control of desaturation of C18:1 to form C18:2.
Limited genetic studies have been conducted to date on the inheritance of the C18:1 content in the seed oil of Ethiopian mustard. Velasco et al. (Reference Velasco, Fernández-Martínez and De Haro2003a, Reference Velasco, Nabloussi, De Haro and Fernández-Martínezb) reported mono and digenic control for C18:1 content but the relationships and interaction between the C18:1 and C22:1 pathways was not investigated in those studies.
In B. carinata, Del Río et al. (Reference Del Río, De Haro and Fernández-Martínez2003) and Del Río-Celestino et al. (Reference Del Río-Celestino, Font, Fernández-Martínez and De Haro-Bailón2005) reported digenic control of C22:1 content in the low-C22:1 mutant L-2890, the high-C22:1 mutant L-1630 and the line zero-C22:1 L-25X-1. The C22:1 content in L-2890 is controlled by partially recessive alleles (m 1 and m 2) at two loci M1 and M2, in L-1630 is controlled by alleles (E 1 and E 2) with additive effects at the loci E1 and E2, while line L-25X-1 was controlled by alleles (e 1 and e 2) acting in an additive and equal manner at two loci E1 and E2.
Molecular and biochemical studies in rapeseed, a relative of Ethiopian mustard, have shown that the zero C22:1 concentration is associated with an absence of β-ketoacyl-CoA (KCS) activity (Roscoe et al. Reference Roscoe, Lessire, Puyaubert, Renard and Delseny2001). KCS, the enzyme that catalyses the elongation pathway of C18:1 to C22:1, is encoded by FAE1 genes, which have been shown to be closely linked to the E1 and E2 loci controlling C22:1 content in rapeseed (Barret et al. Reference Barret, Delourme, Renard, Domergue, Lessire, Delseny and Roscoe1998; Fourmann et al. Reference Fourmann, Barret, Renard, Pelletier, Delourme and Brunel1998). Recent surveys have shown that quantitative trait loci (QTL) for C22:1 content lie in regions of the B. napus genome aligned with the long arm of Arabidopsis thaliana chromosome 4. This alignment is consistent with a Brassica FAE1 homologue as a candidate gene for the control of C22:1 biosynthesis (Qiu et al. Reference Qiu, Morgan, Shi, Long, Liu, Li, Zhuang, Wang, Tan, Dietrich, Weihmann, Everett, Vanstraelen, Beckett, Fraser, Trick, Barnes, Wilmer, Schmidt, Li, Li, Meng and Bancroft2006).
The objective of the present study was to determine the genetic control of C18:1 content and its genetic relationships with C22:1 content in mutant lines (L-482, L-1806, L-1630 and L-2890) and the L-25X-1 line of Ethiopian mustard.
MATERIALS AND METHODS
Plant material
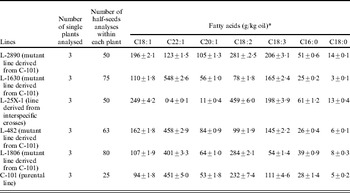
The lines used in the present study were the zero-C22:1 line L-25X-1, obtained from interspecific crosses of B. carinata line C-101 and zero C22:1 Brassica juncea and B. napus (Fernández-Martínez et al. Reference Fernández-Martínez, Del Río, Garcés Velasco, Domínguez and De Haro2001) and the resulting mutants, all obtained after treatment of the line C-101 (with low-C18:1 and standard C22:1 content) with ethylmethane sulphonate (Velasco et al. Reference Velasco, Fernández-Martínez and De Haro1995, Reference Velasco, Fernández-Martínez and De Haro1997, Reference Velasco, Fernández-Martínez and De Haro1998): the high-C18:1 mutant L-482 and the low-C18:1 mutant L-1806, both with standard C22:1 concentration; the high-C18:1 and low-C22:1 mutant L-2890 and the low-C18:1 and high-C22:1 mutant L-1630. The fatty acid composition of these lines is presented in Table 1.
Mean±s.e. of fatty acid composition of seed oil of Ethiopian mustard (B. carinata) lines L-2890, L-1630, L-25X-1, L-482, L-1806 and C-101

* Not including minor fatty acids: myristic, arachidic, palmitoleic, eicosadienoic and nervonic acids.
Genetic study
Reciprocal crosses were made between: (i) mutant L-2890 and the lines C-101, L-1630 and L-482 to study the genetic control of high-C18:1, both in low and high C22:1 backgrounds, (ii) between L-25X-1 and L-1630, to study the genetic control of high-C18:1 both in zero and very high C22:1 backgrounds, and (iii) between L-482 and L-1806 to clarify the relationship between the high and low C18:1, both in high C22:1 background.
The seeds of lines L-482, L-1806, L-2890, L-1630, L-25X-1 and C-101 were analysed for fatty acid composition by the half-seed technique (Thies Reference Thies1971), germinated in a growth chamber and transplanted into pots at the four true leaf stage. The plants were grown in the glasshouse at 22/18°C (day/night) with an 18 h day length, in Córdoba, Spain (37°51′42″N, 04°48′00″W; 220 m asl). Crossing was achieved through the emasculation of immature flower buds of the female parent followed by immediate pollination of its stigmas with fresh pollen from the male parent. Selfing was achieved by pollinating immature flower buds with pollen from open flowers of the same plant. Crosses as well as selfed buds were covered with paper bags to prevent any contamination with external pollen. The fatty acid composition of F1 half-seeds from each cross was analysed by gas–liquid chromatography (GLC). The parents and F1 half-seed from each reciprocal cross were grown in the glasshouse in winter 1995 (crosses L-25X-1×L-1630, L-1630×L-2890, L-482×L-2890 and L-482×L-1806) and in winter 1996 the cross L-2890×C-101. F1 plants were self-pollinated to produce F2 seed and reciprocally backcrossed to both parents to obtain BC1F1 seed. Reciprocal crosses between the two parents were repeated to obtain F1 seeds in the same environment as F2 and BC1F1 seeds. An evaluation of the fatty acid composition at the F1 plant level was made by averaging the GLC analyses of the F2 seeds from each individual F1 plant. Fatty acid composition was determined from a total of 317 individual F2 seeds and a total of 180 BC1F1 seeds from the backcrosses to both parents of the cross L-2890×C-101, 578 F2 seeds of the cross L-482×L-2890, 580 F2 seeds and 855 BC1F1 seeds of the cross L-2890×L-1630, 749 F2 seeds and 605 BC1F1 seeds of the cross L-25X-1×L-1630 and 562 F2 seeds and 838 BC1F1 seeds of the cross L-482×L-1806.
Statistical analyses
Means of the C18:1 content were calculated in the parental and F1 generations and compared using the Student's t-test. Since the results did not reveal any maternal effects for the C18:1 content, the fatty acid composition of segregating generations was analysed on single seeds. The C18:1 content of BC1F1, F2 seeds was assigned to phenotypic classes on the basis of the appearance of discontinuities in the scatter plot and the values found in the parents grown under the same environmental conditions. The proportion of seeds observed in each phenotype class was compared to those expected on the basis of appropriate genetic hypotheses. The goodness of fit to tested ratios was measured by the chi-square (χ2 ) test. Heterogeneity χ2 for families within a cross was not significant (P>0·05); therefore, data for families for the same cross were pooled for analysis.
Fatty acid analyses
Fatty acid methyl esters were obtained as described by Garcés & Mancha (Reference Garcés and Mancha1993) and analysed on a Perkin-Elmer Autosystem gas–liquid chromatograph (Perkin-Elmer Corporation, Norwalk, CT, USA) equipped with a flame ionization detector (FID) and a 2 m column containing 3% SP-2310 and 2% SP-2300 on a 100/120 mesh chromasorb WAW support (Supelco Incorporated, Bellefonte, USA). The oven, injector and FID were held at 195, 275 and 250°C, respectively.
Results
Genetic control of high-C18:1, in both low and high C22:1 backgrounds
Cross between L-2890 and C-101
The fatty acid composition of the seed oil of mutant line L-2890, standard line C-101, and their reciprocal F1s, all grown in the same environment, is presented in Table 1. The inheritance of low C22:1 content in the mutant L-2890 was reported in a previous study and it was concluded that this trait was controlled by two loci (M1 and M2) with partially recessive alleles m 1 and m 2 (Del Río et al. Reference Del Río, De Haro and Fernández-Martínez2003; Del Río-Celestino et al. Reference Del Río-Celestino, Font, Fernández-Martínez and De Haro-Bailón2005).
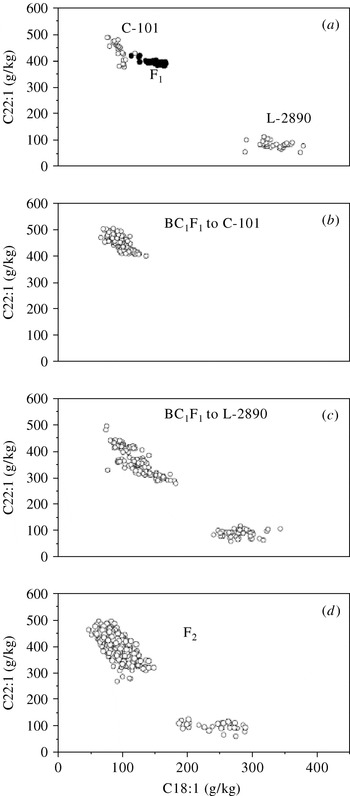
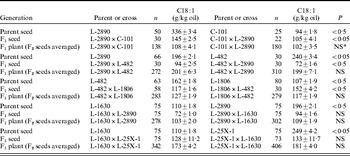
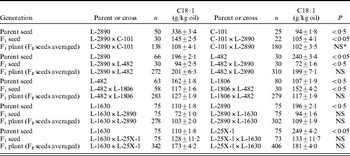
F1 half-seed crosses between L-2890 and C-101 showed a C18:1 mean value of 125 g/kg (Table 2). This C18:1 value was lower than that of the mid-parent (215 g/kg) and different from both parents, indicating a partial dominance of low over high C18:1 levels. The reciprocal F1 seeds differed significantly for the C18:1 content (Table 2), indicating the existence of a slight maternal effect. Since no significant cytoplasmic effects could be detected on the C18:1 content in any of the crosses, the data from reciprocal F1, F2 and BC1F1 seeds were combined in Fig. 1.
(a) Scatter plots of C18:1 v. C22:1 concentration (g/kg) in the Ethiopian mustard lines L-2890 (P1), C-101 (P2) and their F1, (b) BC to C-101, (c) BC to L-2890 and (d) F2 seeds.

Mean±s.e. of oleic acid content of the parents L-2890, L-1630, L-482, L-1806, L-25X-1 and C-101 and of reciprocal F1 at the seed and plant level from their crosses
* NS=not significant.
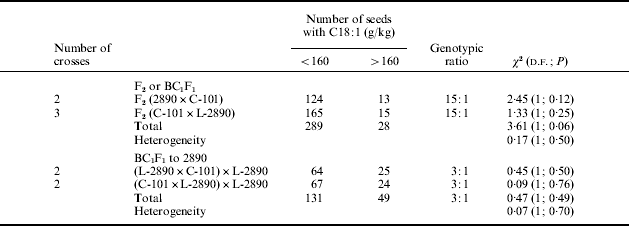
A bimodal distribution pattern was apparent when the C18:1 data of the F2 generation from crosses between L-2890 and C-101 were plotted in scatter plots (Fig. 1d). The first class was assigned to the ‘low+intermediate’ category (C18:1<160 g/kg), corresponding to the range observed for C-101 and reciprocal F1 seeds, and the second class was assigned to the category ‘high’ (C18:1 content>160 g/kg) corresponding to the range observed for L-2890. The number of seeds in each class (Fig. 1d) fitted satisfactorily to 15:1 ratios (low+intermediate:high) in the five F2 populations analysed (Table 3) (χ2=3·6, P=0·06). This segregation can be explained as two independent loci, controlling the high C18:1 trait.
Number of seeds in oleic acid content classes in the analysis of F2 and BC1F1 populations from the crosses between 2890 and C-101
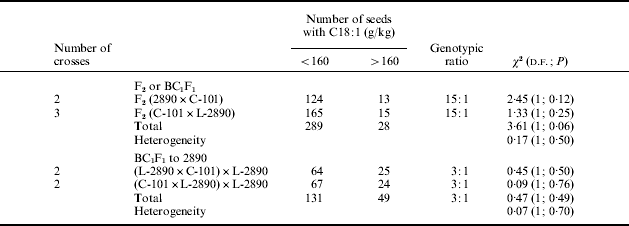
The C18:1 distribution in the BC1F1 backcrosses to standard line C-101 ranged from 56 to 136 g/kg (Fig. 1b). The distribution was continuous and it was not possible to separate low and intermediate C18:1 classes; therefore classes were not fitted at any ratio. The C18:1 content in the backcrosses to the mutant line L-2890 (high C18:1) ranged from 74 to 344 g/kg (Fig. 1c). The distribution was separated into two clear-cut classes, which consisted of seeds with <200 g/kg and >200 g/kg C18:1. A theoretical genetic ratio of 3:1 (χ2=0·47, P=0·49) for these classes was expected according to an F2 proportion of 15:1. These data indicate that the C18:1 content in the mutant line L-2890 is controlled by recessive alleles at two loci.
Correlations among specific acid content indicated, in the F2 populations analysed, that C18:1 was positively correlated with C18:2 content (r=0·81, P<0·001). Within the F2 population having C22:1 content of less than 250 g/kg, C18:1 was positively correlated with C18:2 (r=0·41, P<0·001), but there was no correlation (r=−0·09, P=0·18) in the population having a C22:1 content over 250 g/kg. The contents of C18:1 and C18:2 were negatively correlated with C22:1 content in the F2 population (r=−0·93, P<0·001 and r=−0·94, P<0·001, respectively).
Crosses between L-482 and L-2890
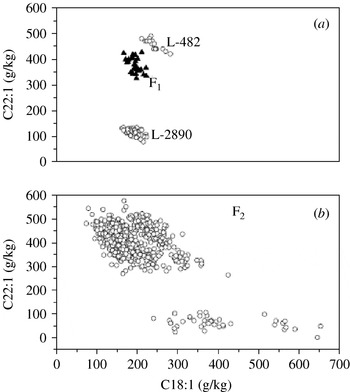
Figure 2 shows the C18:1 content of L-482, L-2890 and F1 and F2 populations. The analysis of F1 half-seeds from reciprocal crosses between the mutant lines L-482 and L-2890 confirmed the partial maternal effect in the expression of the C18:1 content and the partial dominance of low over increased C18:1 levels, as concluded from the crosses between L-2890×C-101. The analysis of F2 seeds indicated that the C18:1 and C22:1 contents ranged from 74 to 653 g/kg in the first case and from 23 to 577 g/kg in the second case. The transgressive segregation found for the C18:1 and C22:1 contents in the F2 generations indicates that different alleles at different loci control C18:1 and C22:1 contents in lines L-482 and L-2890.
(a) Scatter plots of C18:1 v. C22:1 concentration (g/kg) in the Ethiopian mustard lines L-2890 (P1), L-482 (P2) and their F1 and (b) F2 seeds.

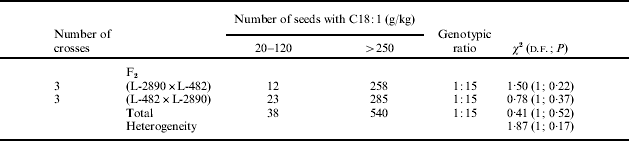
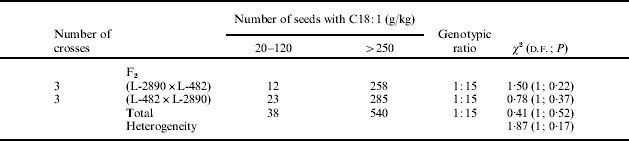
The C22:1 content of individual half-seeds from the F2 population showed a bimodal distribution (Fig. 2b): the low C22:1 class (23–120 g/kg) and the intermediate-high class (250–577 g/kg). In the six F2 populations analysed, three from each reciprocal cross, the distribution of C22:1 content fitted a ratio of 1:15 (χ2=0·41, P=0·52) for the low:intermediate-high classes, respectively (Table 4). This segregation suggests the presence of two independent loci, which is in agreement with the model proposed (M1 and M2 loci) for the inheritance of C22:1 in the mutant L-2890 (Del Río et al. Reference Del Río, De Haro and Fernández-Martínez2003).
Number of seeds in erucic acid content classes in the analysis of F2 populations from the crosses between L-482 and L-2890
The C18:1 content of the F2 seeds showed a continuous and asymmetric distribution with the phenotypic classes not as evident as in the F2 generation from the cross between L-2890 and C-101. Therefore, the phenotypic classes were defined on the basis of the C18:1 and C22:1 contents of the parents grown in the same environment. When C22:1 and C18:1 fatty acids were evaluated simultaneously in the F2 seeds, ten individuals with very high-C18:1/very low-C22:1 class were recovered. The proportions of ten individuals in 582 F2 seeds were as expected for both traits segregating independently (1/4 very high-C18:1×1/16 very low-C22:1; χ2=0·09; P=0·76). Therefore, the results suggest the existence of alleles at three loci controlling the C18:1 content.
Within the F2 population having levels of C22:1 lower than 120 g/kg, C18:1 and C18:2 were negatively correlated (r=−0·91, P<0·001) and in the population having a C22:1 content over 120 g/kg, C18:1 and C18:2 were also negatively correlated (r=−0·55, P=0·07). C18:1 and C18:2 contents were negatively correlated with C22:1 content in the F2 population (r=−0·78, P<0·001 and r=−0·48, P<0·001, respectively).
Crosses between L-2890 and L-1630
Seeds of L-2890 had an increased C18:1 content of 196 g/kg and a low C22:1 content of 123 g/kg (Tables 1 and 2). Seeds of L-1630 had a low C18:1 content of 110 g/kg and a very high C22:1 content of 548·2 g/kg. The inheritance of C22:1 in zero C22:1 line L-25X-1 was controlled by alleles with additive effects e 1 and e 2 in E1 and E2 loci (Del Río et al. Reference Del Río, De Haro and Fernández-Martínez2003). Oleic acid concentration averaged 94 g/kg in F1 seeds from the cross L-2890×L-1630, compared to 72 g/kg in the reciprocal cross, which indicated a partial maternal effect on this trait (Table 2). The average C18:1 content of the F1 generation was 83 g/kg, significantly lower than the mid-parent value (153 g/kg), indicating partial dominance of low over increased C18:1 content.
The average C18:1 content of F2 seeds was 109 g/kg in the cross L-2890×L-1630, which was not significantly different from the average C18:1 content of 103 g/kg in the reciprocal cross. The data revealed the absence of cytoplasmic effects for C18:1 content.
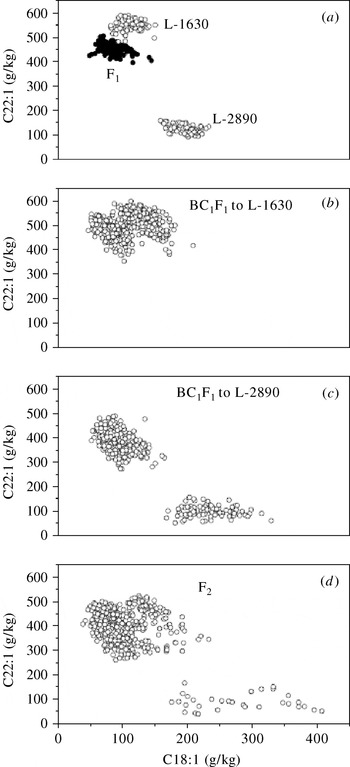
A strong transgressive segregation was also observed in the segregating generations F2 and backcrosses to the parent L-2890 (Fig. 3c, d). F2 segregants for C18:1 clearly surpassed the upper limit of the parent L-2890.
(a) Scatter plots of C18:1 v. C22:1 concentration (g/kg) in the Ethiopian mustard lines L-2890 (P1), L-1630 (P2), and their F1, (b) BC to L-1630, (c) BC to L-2890 and (d) F2 seeds.

A first evaluation of the distribution of the fatty acid composition in the F2 seeds was performed by grouping separately the segregations of the C22:1 and C18:1 traits. In the five F2 populations analysed, the C22:1 content followed a bimodal distribution (Fig. 3d). The two C22:1 classes identified with a low-C22:1 (<160 g/kg) and an intermediate-high-C22:1 (from 160 to 522·8 g/kg) fitted satisfactorily a 1:15 ratio (χ2=0·36, P=0·55), which is in agreement with the two-loci model (M1 and M2 loci) proposed for the inheritance of C22:1 in the mutant L-2890 (Del Río et al. Reference Del Río, De Haro and Fernández-Martínez2003). The C18:1 content of the F2 seeds followed a continuous distribution (Fig. 3d). Within the F2 population with low C22:1 content (<160 mg/kg), two classes were apparent (Fig. 3d). The C18:1 of the first class ranged from 168 to 337 mg/kg and included individuals with values similar to line L-2890 and the range of the BC1F1 to L-2890. The second class included individuals with very high C18:1 values ranging from 350 to 408 g/kg. According to the size of the analysed population (580 F2 seeds), 9·1 seeds for the very high C18:1/low C22:1 class (>350 g C18:1/kg and <160 g C22:1/kg) were expected for both traits segregating independently (1/4 high-C18:1/low-C22:1×1/16 low-C22:1). The proportion of the eight individuals identified in the very high C18:1/low C22:1 class fitted satisfactorily a 1:64 ratio (χ2=0·01; P=0·91). Therefore, the results suggest the existence of alleles at three loci controlling the C18:1 content, as concluded from the cross between L-482 and L-2890.
Four backcrosses to the parent line L-1630 and four backcrosses to the parent line L-2890 were analysed (Fig. 3b, c). The C18:1 content of the backcrosses to the line L-1630 seeds showed a continuous distribution (Fig. 3b) and no further division into subclasses was possible.
The results observed in the F2 generation were confirmed in the backcrosses to the line L-2890 (Fig. 3c), in which seeds with a high C18:1 and a low-C22:1 level (<160 g/kg) were present. According to the population size (360 BC1F1 seeds), more than 90 seeds with this phenotype were expected (P=0·05). In this generation, the observed data fit satisfactorily with a low C18:1/high C22:1 to high C18:1/low C22:1 ratio of 3:1 (χ2=0·40; P=0·52), supporting the three-loci model proposed to explain the segregation observed in the F2 generation of crosses between L-1630 and L-2890.
Within the F2 population having C22:1 levels lower than 160 g/kg, C18:1 and C18:2 were negatively correlated (r=−0·77, P<0·001). In the F2 population having a C22:1 content over 200 g/kg, C18:1 and C18:2 were also negatively correlated (r=−0·41, P<0·001). C18:1 and C18:2 contents were negatively correlated with C22:1 content in the F2 population (r=−0·66, P<0·001 and r=−0·64, P<0·001, respectively).
Genetic control of high C18:1 both in zero and very high C22:1 backgrounds
Crosses between L-1630 and L-25X-1
Seeds of L-1630 had a C18:1 content of 110 g/kg and a high C22:1 content of 548 g/kg (Tables 1 and 2). The inheritance of C22:1 in high C22:1 line L-1630 was controlled by E 1 and E 2 alleles with additive effects in E1 and E2 loci (Del Río et al. Reference Del Río, De Haro and Fernández-Martínez2003). The average C18:1 content in reciprocal F1 seeds (130 g/kg) was lower than the mid-parent value (179 g/kg; Table 2) and different from both parents, L-1630 (110 g/kg) and L-25X-1 (249 g/kg), indicating a partial dominance of low over high C18:1 levels. No maternal or cytoplasmic effects were observed for C18:1, as indicated by the lack of reciprocal differences in this generation (Table 2).
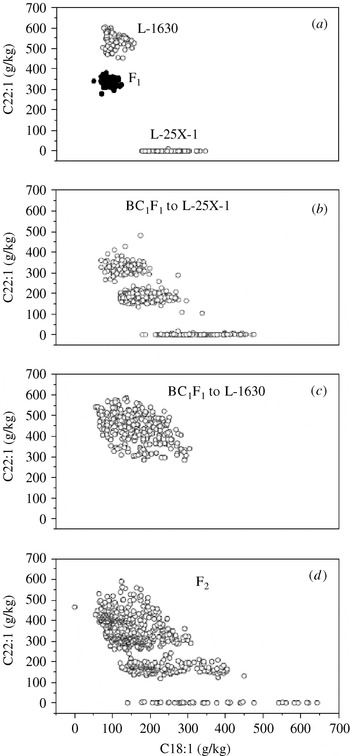
A strong transgressive segregation was observed in the segregating F2 and backcross to L-25X-1 generations (Fig. 4b, d). The C18:1 content of individual F2 seeds ranged from 54·3 to 643·2 g/kg and the backcrosses to L-25X-1 from 81·1 to 475·4 g/kg. The transgressive segregation found for the C18:1 content in the segregating generation indicates that both lines carry alleles for high C18:1 content at different loci (Fig. 4d), as concluded from the crosses between L-1630×L-2890.
(a) Scatter plots of C18:1 v. C22:1 concentration (g/kg) in the Ethiopian mustard lines L-25X-1 (P1), L-1630 (P2), and their F1, (b) BC to L-25X-1, (c) BC to L-1630 and (d) F2 seeds.

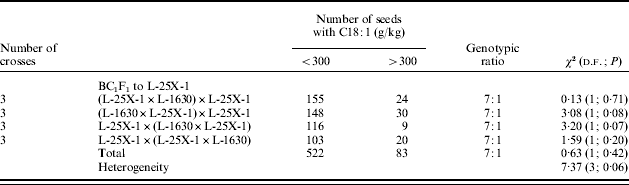
Within the zero C22:1 (<10 mg/kg) F2 population, the C18:1 content followed a bimodal distribution (Fig. 4d). The C18:1 of the first class ranged from 140 to 474 mg/kg, included individuals with values similar to line L-25X-1 and the range of the BC1F1 to L-25X-1. The second class included individuals with very high C18:1 values ranging from 537 to 643·2 g/kg. According to the size of the analysed population (749 F2), 11·7 seeds for the very high C18:1/zero C22:1 class were expected for both traits, C18:1 and C22:1, segregating independently (P=0·05). In the six F2 populations analysed (Fig. 4d), three from each reciprocal cross, the proportion of 16 individuals observed in the very high C18:1/zero C22:1 class fitted satisfactorily a 1:64 ratio (1/4 very high-C18:1/zero-C22:1×1/16 zero-C22:1), which indicated that the C18:1 content is controlled by three independent loci (χ2=1·35, P=0·24).
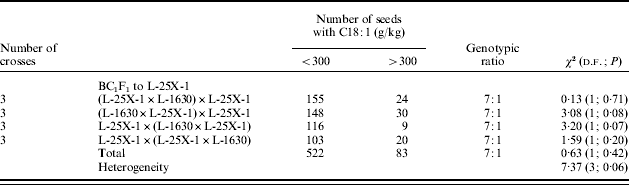
In the 12 backcrosses to the L-25X-1 parental, combined in Fig. 4b, two classes were distinguished, one ranging from 81·1 to 300 g/kg and including low+intermediate C18:1/intermediate+high C22·1 phenotypes, and the second including individuals with high C18:1/zero C22:1 content (300–475·4 g C18:1/kg). The frequencies observed in each class (Fig. 4b) fitted satisfactorily a 7:1 ratio (χ2=0·63, P=0·42). This segregation would be expected according to the three-loci model proposed (Table 5). The C18:1 content of the backcrosses to the line L-1630 seeds showed a continuous distribution (Fig. 4c) and no further division into subclasses was possible.
Number of seeds in oleic acid content classes in the analysis of BC1F1 populations from the crosses between 1630 and 25X-1 and chi-square analyses
Within the F2 population free of C22:1 and C20:1 acids, the levels of C18:1 and C18:2 were negatively correlated (r=−0·78, P<0·001) and in the F2 population having a C22:1 content over 250 g/kg, both fatty acids, C18:1 and C18:2, were also negatively correlated (r=−0·31, P<0·001). C18:1 and C18:2 contents were negatively correlated with C22:1 content within the F2 population free of C22:1 (r=−0·67, P<0·001 and r=−0·58, P<0·001, respectively).
Genetic control of high C18:1 both in high C22:1 background
Crosses between L-482 and L-1806
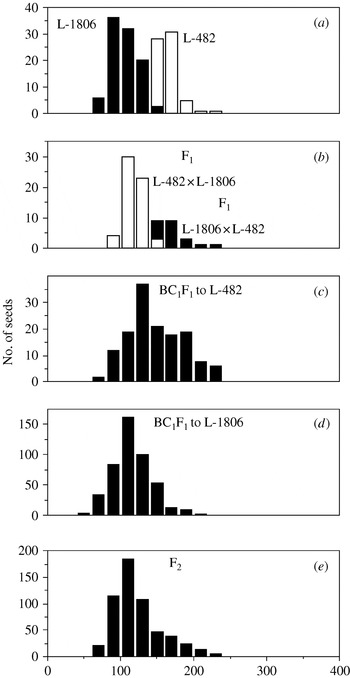
Seeds of L-482 had a C18:1 content of 162 g/kg and a high C22:1 content of 458 g/kg and seeds of L-1806 had a C18:1 content of 107 g/kg and a high C22:1 content of 401 g/kg (Table 1). The mean C18:1 content of F1 seeds was 134 g/kg which is similar to the mid-parent value (134 g/kg; Table 2), indicating additive effects influencing this trait. The reciprocal F1 seeds differed significantly for the C18:1 content (Table 2), indicating the existence of a slight maternal effect. Since no significant cytoplasmic effects could be detected on the C18:1 content in any of the crosses, the data from reciprocal F1, F2 and BC1F1 seeds were combined in Fig. 5. The seeds of mutant lines L-482 and L-1806 did not differ significantly for the C22:1 content.
(a) Frequency distributions of C18:1 (g/kg) in the Ethiopian mustard lines L-482 (P1), L-1806 (P2), and their (b) F1, (c) BC to L-482, (d) BC to L-1806 and (e) F2 seeds. Empty bars represent frequency distributions of C18:1 (g/kg) for L-482 (P1) and their reciprocal F1 seeds in Fig. 1 a, b, and dark vertical bars represent frequency distributions for L-1806 (P2) and their reciprocal F1 seeds in Fig. 1 a, b.

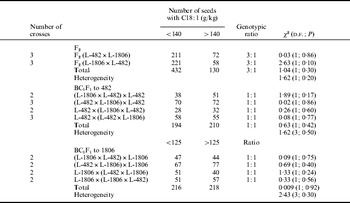
The C18:1 content of the F2 seeds ranged from 59·5 to 239·3 g/kg, showing a continuous distribution (Fig. 5e). Therefore, the phenotypic classes were defined on the basis of the C18:1 content of the parents grown in the same environment. According to this criterion, two classes were identified. The first class was assigned to the ‘low+intermediate’ category (C18:1<140 g/kg) corresponding to the range observed for L-1806 and reciprocal F1 seed, and the second class was assigned to the category ‘high’ (C18:1 content>140 g/kg) corresponding to the range observed for L-482. In all the F2 populations analysed (Table 6), the observed numbers for the two classes fitted satisfactorily a phenotypic ratio of 3:1 ‘low+intermediate:high’. These data indicated the presence of a major locus responsible for the high C18:1 content in L-482. The results were additionally supported by the 1:1 (intermediate:high) segregation found in the backcrosses to the high C18:1 parent L-482, and the 1:1 (low:intermediate) ratio observed in the backcrosses with the low C18:1 parent L-1806 (Table 6).
Number of seeds in oleic acid content classes in the analysis of F2 and BC1F1 populations from the crosses between L-482 and L-1806

Correlations among specific acid contents in F2 population indicated that C18:1 content was negatively correlated with C18:2 content (−0·81, P<0·001).
Discussion
In the cross L-1630×L-25X-1 it was revealed that the genetic control of C18:1 content was embryonic. The reciprocal F1 seeds from the crosses L-2890×C-101, L-482×L-2890, L-2890×L-1630 and L-482×L-1806 differed significantly for the C18:1 content, indicating the existence of a slight maternal effect. As have been described in other oleaginous species such as sunflower and soybean, the existence of maternal effects can depend on the lines used in the crosses (Fernández-Martínez & Knowles Reference Fernández-Martínez and Knowles1982; Erickson et al. Reference Erickson, Wilcox and Cavins1988). At the F2 level, C18:1 content did not differ significantly in all the reciprocal crosses, indicating the absence of cytoplasmic effects. The presence of the maternal effects but no cytoplasmic effects for C18:1 content observed in the present study are similar to findings previously reported in rapeseed by Thomas & Kondra (Reference Thomas and Kondra1973) and Rakow & McGregor (Reference Rakow and McGregor1973) and in Ethiopian mustard by Velasco et al. (Reference Velasco, Nabloussi, De Haro and Fernández-Martínez2003b).
There was partial dominance of low over higher C18:1 content in all crosses except for the cross L-482×L-1806, which indicated additive effects influencing seed C18:1 contents (Table 2). The results obtained in the present study regarding the partial dominance of low over high C18:1 content are in agreement with findings previously reported in B. carinata (Velasco et al. Reference Velasco, Fernández-Martínez and De Haro2003a, Reference Velasco, Nabloussi, De Haro and Fernández-Martínezb) but contrasting with those reported in rapeseed by Rakow & McGregor (Reference Rakow and McGregor1973) and Kondra & Thomas (Reference Kondra and Thomas1975), who indicated partial dominance for high C18:1/low C18:2. Similarly to the results obtained in the cross L-482×L-1806, Ecker & Yaniv (Reference Ecker and Yaniv1993) reported additive effects for loci controlling the C18:1 content and partial dominance of low over high C18:1 content in Sinapis alba.
The segregation pattern in F2 and BC1F1 populations differed in the crosses studied. The inheritance of C18:1 content in crosses segregating for this fatty acid was as expected for one (cross L-482×L-1806), two (cross L-2890×C-101) or three (crosses L-1630×L-2890, L-1630×L-25X-1 and L-482×2890) loci. The genetic systems, of one and two loci determining C18:1 content has been described previously in B. carinata (Velasco et al. Reference Velasco, Fernández-Martínez and De Haro2003a, Reference Velasco, Nabloussi, De Haro and Fernández-Martínezb) and in B. napus (Schierholt et al. Reference Schierholt, Rücker and Becker2001), but differ from the model of three loci described in the present work (crosses L-1630×L-2890, L-1630×L-25X-1 and L-482×2890).
Chen & Beversdorf (Reference Chen and Beversdorf1990) found different segregation patterns in crosses among three homozygous microspore-derived populations of spring rapeseed (B. napus) with contrasting amounts of C18:1, which were attributed to the existence of two gene systems, each containing two loci. One of these two gene systems has a major effect on C18:1 content which involved the co-segregation of C22:1. The other gene system which affects C18:1 is of minor importance in comparison to the major gene system and was controlled by two loci. In the present study, segregation for C18:1 was also controlled by at least two gene systems. One of these two gene systems has a major effect on both C18:1 and C22:1 contents, as the segregation of these two acids is interdependent; high C18:1 content was always associated with low C22:1 and vice versa.
The strong negative correlation between C18:1 and C22:1 content in crosses L-2890×C-101, L-1630×L-25X-1, L-482×L-2890 and L-2890×L-1630 (r=−0·93, −0·67, −0·78 and −0·66, respectively, all with P<0·001) suggests that the alleles at the loci in the major system act at the elongation step of the C18:1 to C22:1 pathway, which agrees with the results of Chen & Beversdorf (Reference Chen and Beversdorf1990). The present authors' hypothesis is that the two loci acting in the major system are the same as those loci involved in the control of C22:1 in mutant line L-2890 (alleles m 1 and m 2 at M1 and M2 loci), in mutant line L-1630 (alleles E 1 and E 2 at E1 and E2 loci) and in line L-25X-1 (alleles e 1 and e 2 at E1 and E2 loci) of Ethiopian mustard (Del Río et al. Reference Del Río, De Haro and Fernández-Martínez2003).
The other gene system that affects C18:1 is of minor importance in comparison to the gene system involving the co-segregation of C22:1. The present authors propose that this minor gene system explains the change to a strong correlation between C18:1 and C18:2 in crosses between L-482×L-2890, L-1630×L-25X-1 and L-2890×L-1630 when segregation for C22:1 in F2 seeds is present (r=−0·55 with P=0·07, −0·31 with P<0·001, −0·41 with P<0·001, respectively) or absent (r=−0·91, −0·78 and −0·77, respectively, all with P<0·001). This minor gene system is less apparent in the presence of C22:1 segregation, perhaps as a reflection of its impact on C18:1 compared to the alleles at loci controlling chain elongation from C18:1 to C22:1. The consistent positive correlation between C18:1 and C18:2 (r=0·81, P<0·001), even at levels of C22:1 up to 250 g/kg (r=0·33, P<0·001) in the cross L-2890×C-101, suggests that alleles determining the C18:1 content were only the m 1 and m 2 alleles at M1 and M2 loci controlling chain elongation from C18:1 to C22:1. The locus acting in the minor system controls the desaturation pathway of C18:1 to C22:1 and was tentatively named OL. The alleles in the locus OL controlling the C18:1 in line L-1630 were designated ol.
Cross of L-482 and L-1806 revealed that the high C18:1 content in L-482 was determined by alleles at a single locus. Taking into account the strong correlation between C18:1 and C18:2 contents in this cross (r=−0·81, P<0·001) it is proposed that the OL locus controls the high C18:1 in L-482. The alleles in L-482 were designated ol1, and in L-1806 were designated Ol1. The alleles controlling the low C18:1 in L-1806 were partially dominant to the alleles controlling the high C18:1 content (in line L-482).
The mutagenic treatment induced mutations (ol1, ol and Ol1) in the wild allele Ol, increasing the levels of C18:1 in mutant lines L-482 (ol1) and L-1630 (ol) and reducing the content of C18:1 in mutant line L-1806 (Ol1). In the case of the low C22:1 mutant L-2890, the mutagenic treatment only induced the partially recessive mutations (m 1 and m 2) in the wild alleles M1 and M2, reducing the levels of C22:1, without affecting the wild alleles Ol. Conversely, the zero C22:1 line L-25X-1 obtained by interspecific crossing of B. carinata C-101 and B. napus, and the B. juncea zero C22:1 (Fernández-Martínez et al. Reference Fernández-Martínez, Del Río, Garcés Velasco, Domínguez and De Haro2001), carried the wild alleles M at loci M1 and M2, alleles e for zero C22:1 concentration at loci E1 and E2 and wild alleles Ol at loci OL.
Therefore, taking into account firstly the genetic system (loci M1, M2, E1 and E2 controlling the chain elongation steps leading from C18:1 to C22:1) proposed in a previous study to explain the genetic control of C22:1 in crosses L-2890×C-101, L-1630×L-25X-1 and L-1630×L-2890 (Del Río et al. Reference Del Río, De Haro and Fernández-Martínez2003) and secondly, the locus OL identified in the present work (involved in control of desaturation of C18:1 to form C18:2), the genetic constitution of the parent lines would be OlOlE 1E 1E 2E 2m 1m 1m 2m 2 for L-2890, OlOlE 1E 1E 2E 2M 1M 1M 2M 2 for C-101, ololE 1E 1E 2E 2M 1M 1M 2M 2 for L-1630, OlOle 1e 1e 2e 2M 1M 1M 2M 2 for L-25X-1, ol1ol1E 1E 1E 2E 2M 1M 1M 2M 2 for L-482 and Ol1Ol1E 1E 1E 2E 2M 1M 1M 2M 2 for L-1806.
Genetic recombination of loci present in lines L-1630 and L-25X-1 resulted in transgressive recombinants with a high potential to develop agronomically acceptable hybrids for commercial exploitation, with about a three-fold increase of the C18:1 content of the parents and free of C22:1 content. This novel Ethiopian mustard germplasm has a linoleic acid content of about 180 g/kg. The reduction of linolenic acid content is seen as one of the key requirements for improving the value of zero C22:1 oils for frying applications (McVetty & Scarth Reference McVetty and Scarth2002). This line is hypothesized to have the genotype olol e 1e 1e 2e 2M 1M 1M 2M 2. The genetic relationship of the ol mutant alleles in L-1630 to ol1 alleles in L-482 controlling high C18:1 content is unknown. An additional increase of C18:1 content in recombinant line could be expected by mutagenesis or by introgressing the ol1 alleles from the L-482 mutant, if ol1 alleles were at a different locus than ol alleles in L-1630.
Because of the low number of genes involved in the genetic control of the high oleic acid trait in mutant lines L-482 and L-1630, a successful transference of this character into breeding lines can be performed in a few generations. The information provided by the present research will facilitate the development of commercial hybrids producing oil rich in oleic acid and free of erucic acid, thus satisfying the increasing demand for vegetable oils with high monounsaturated fatty acids for nutritional and industrial purposes. Further molecular studies using populations derived from crosses performed in this work could be useful for developing a linkage map, based on these populations, primarily using convenient PCR-based markers that enable integration with existing Brassica linkage maps (Qiu et al. Reference Qiu, Morgan, Shi, Long, Liu, Li, Zhuang, Wang, Tan, Dietrich, Weihmann, Everett, Vanstraelen, Beckett, Fraser, Trick, Barnes, Wilmer, Schmidt, Li, Li, Meng and Bancroft2006) and with the A. thaliana genome sequence (Arabidopsis Genome Initiative 2000; Hobbs et al. Reference Hobbs, Flintham and Hills2004). With the advent of molecular markers and the development of QTL mapping procedures, the selection efficiency in Ethiopian mustard improvement will be increased and also could be used to investigate the organization and regulation of genes responsible for oleic and erucic acid contents in this species.
We thank Alberto Merino and Gloria Fernández-Marín for their technical assistance. This work was supported by the M. C. Y. T. (Proj. AGL2001-2293) of the Spanish Government.