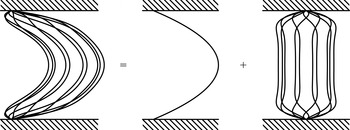
1 Introduction
Pulsatile flows occur in a variety of engineering applications as well as in the human body. Over the past fifty years many studies have addressed the linear dynamics of oscillating flows over a flat plate or through channels or pipes, but surprisingly few recent investigations have considered pulsatile flows, and the development of finite-amplitude travelling waves has hardly ever been addressed. While purely oscillatory flows are governed by a single characteristic time, based on the oscillation period, pulsatile flows also depend on a second characteristic time scale, related to the mean flow velocity. Another essential difference is that oscillating configurations undergo global flow reversal and therefore the absolute value of the flow speed increases and decreases twice per period, while pulsating flows generally maintain the same flow direction and display only one phase of increasing flow speed and one phase of decreasing flow speed in each cycle. Hence, the presence of a non-vanishing mean-flow component leads to behaviour distinct from purely oscillating situations. Using the classical channel geometry, the purpose of the present work is to systematically establish both linear and fully nonlinear flow features prevailing for fundamental pulsatile-flow configurations.
Among the few known exact solutions of the Navier–Stokes equations (Drazin & Riley Reference Drazin and Riley2006), those which are time periodic and parallel are of particular interest (Davis Reference Davis1976). The Stokes (Reference Stokes1851) layer, i.e. the flow induced in a semi-infinite volume of fluid by an infinite flat plate harmonically oscillating in its own plane, has served as the archetypal configuration for the study of time-periodic flows near a solid boundary. Similar velocity profiles prevail if the fluid is in contact with a fixed plate and is brought into motion by an oscillating pressure gradient parallel to the plate. If the flow is confined between two parallel plates, the exact base-flow profiles are still obtained in terms of exponential functions, while periodic flows through a circular pipe are known as Womersley (Reference Womersley1955) solutions and may be expanded in terms of Bessel functions.
All these time-periodic flows develop an oscillating boundary layer of characteristic thickness
 $$\begin{eqnarray}\displaystyle \unicode[STIX]{x1D6FF}=\sqrt{\unicode[STIX]{x1D708}/\unicode[STIX]{x1D6FA}}, & & \displaystyle\end{eqnarray}$$
where
 $\unicode[STIX]{x1D708}$
is the kinematic viscosity of the fluid and
 $\unicode[STIX]{x1D6FA}$
the pulsation frequency. For channels or pipes, the time-periodic flow profiles significantly depend on the ratio of the diameter to the oscillating-boundary-layer thickness, known as the Womersley number
 $Wo$
. Thus, for large values of
 $Wo$
, confinement or curvature effects are expected to be negligible and the dynamics similar to that of a semi-infinite Stokes layer. In contrast, at low values of
 $Wo$
, pulsatile flows may be seen as slowly modulated parabolic Poiseuille profiles. In physiological situations (Ku Reference Ku1997; Pedley Reference Pedley, Batchelor, Moffatt and Worster2000), typical Womersley numbers prevailing in the main blood vessels are in the range
 $5$
–
 $15$
which is neither small nor very large. Our recent study of flow through model abdominal aortic aneurysms (Gopalakrishnan, Pier & Biesheuvel Reference Gopalakrishnan, Pier and Biesheuvel2014a
,Reference Gopalakrishnan, Pier and Biesheuvel
b
has revealed the need to investigate in detail the dynamics of physiological flow conditions even for simple parallel geometries. As will be shown in the present paper, it is precisely in the range
 $5<Wo<20$
that pulsatile channel flow undergoes transitions between different characteristic regimes, both for small-amplitude perturbations as well as fully developed nonlinear propagating waves.
1.1 Literature review
Early theoretical and numerical work is mainly focused on the linear stability of Stokes layers or the equivalent channel and pipe flows. For obvious reasons, experimental investigations almost exclusively consider the flow through circular pipes, but are able to address the fully developed dynamics prevailing in unstable configurations. More recently, the linear stability of a range of time-periodic flows has been revisited, using the now available numerical methods and facilities. Surprisingly, apart from a few recent computations of turbulent periodic flows, the nonlinear regime has not yet attracted much theoretical or numerical attention.
Grosch & Salwen (Reference Grosch and Salwen1968) were among the first to address the linear stability of time-dependent plane Poiseuille flow, by expanding the disturbance streamfunction on a small set of basis functions. They found that for weak pressure gradient modulations, the resulting modulated flow was more stable than the steady flow, while a rather drastic destabilization was observed at higher velocity modulations.
von Kerczek & Davis (Reference von Kerczek and Davis1974) studied the linear stability of oscillatory Stokes layers, using quasi-static theories and integration of the linearized time-dependent equations. They were unable to find any unstable modes for the configurations considered. Using semi-analytic methods, Hall (Reference Hall1978) also found this flow to be stable in the parameter range investigated.
Yang & Yih (Reference Yang and Yih1977) considered axisymmetric perturbations to harmonic oscillating pipe flow. All configurations for which calculations have been carried out are found to be stable. Later, Fedele, Hitt & Prabhu (Reference Fedele, Hitt and Prabhu2005) also claimed that axisymmetric modes in pulsatile pipe flow are stable, while, more recently, Thomas et al. (Reference Thomas, Bassom, Blennerhassett and Davies2011) were able to obtain unstable axisymmetric modes and to establish critical conditions for this flow.
In a landmark study of pulsating plane channel flow, von Kerczek (Reference von Kerczek1982) considered configurations with moderate pulsation amplitudes, mostly near the critical Reynolds number for steady flow, and computed Floquet exponents by a series expansion, using a perturbation analysis in the amplitude of the oscillating base velocity. It was found that the sinusoidally pulsating flow is more stable than the steady plane Poiseuille flow for a range of frequencies greater than approximately
 $Wo=12$
. Lower or much higher frequencies were found to make the flow unstable, in contrast with the results of Grosch & Salwen (Reference Grosch and Salwen1968). The perturbation analysis also confirmed the result obtained by Hall (Reference Hall1975) that the growth rate depends quadratically on small pulsating amplitudes.
Using numerical simulations, Singer, Ferziger & Reed (Reference Singer, Ferziger and Reed1989) found that the effect of oscillation is generally stabilizing. However, at low frequencies, the perturbation energy may vary by several orders of magnitude within each cycle. These authors confirmed the findings by von Kerczek (Reference von Kerczek1982) and suspect that those by Grosch & Salwen (Reference Grosch and Salwen1968) are underresolved. They were also probably the first to attempt a nonlinear simulation.
Rozhdestvenskii, Simakin & Stoinov (Reference Rozhdestvenskii, Simakin and Stoinov1989) appear to be the first to implement a complete Floquet analysis, based on temporal integration of matrices. They were also able to confirm results by von Kerczek (Reference von Kerczek1982).
Using mainly analytical methods, Cowley (Reference Cowley, Dwoyer and Hussaini1987) and, more recently, Hall (Reference Hall2003), suggested that the Stokes layers do not sustain linearly unstable modes in the limit of very large Reynolds numbers.
In an experimental study, Merkli & Thomann (Reference Merkli and Thomann1975) investigated transition in oscillating pipe flow and showed that turbulence occurs in the form of periodic bursts which are followed by relaminarization in the same cycle and do not necessarily lead to turbulent flow during the whole cycle.
Using a similar experimental set-up, Hino, Sawamoto & Takasu (Reference Hino, Sawamoto and Takasu1976) identified three types of regimes: weakly turbulent, conditionally turbulent and fully turbulent. Decelerating phases are found to promote turbulence while the laminar flow may recover during accelerating phases.
Adopting a physiological approach, Winter & Nerem (Reference Winter and Nerem1984) reported similar experimental observations and noted that fully turbulent flow is only found when a mean flow is present.
Stettler & Hussain (Reference Stettler and Hussain1986) further investigated the transition occurring in a pulsatile pipe flow experiment and documented the passage frequency of ‘turbulent plugs’ for a wide range of control parameters and delineated the conditions when plugs occur randomly or are phase locked with the pulsation.
Considering oscillatory pipe flow, Akhavan, Kamm & Shapiro (Reference Akhavan, Kamm and Shapiro1991a ,Reference Akhavan, Kamm and Shapiro b ) established experimentally and numerically that turbulence appears explosively towards the end of the acceleration phase and is sustained throughout the deceleration phase while being restricted to the wall region. Using a quasi-steady transient growth analysis, it was suggested that transition may be the result of a secondary instability mechanism.
Straatman et al. (Reference Straatman, Khayat, Haj-Qasem and Steinman2002) derived, by a linear stability analysis, that pulsating a plane Poiseuille flow is always destabilizing. However, they seemed to associate stability with decay throughout the cycle and it is therefore difficult to interpret the marginal curves shown in that paper.
More recently, in a series of theoretical and numerical papers, Blennerhassett and Bassom, with Thomas and Davies, have used Floquet analysis and linear simulation to address the stability of a range of related time-periodic flows due to an oscillating plate (Blennerhassett & Bassom Reference Blennerhassett and Bassom2002; Thomas et al. Reference Thomas, Bassom, Blennerhassett and Davies2010, Reference Thomas, Davies, Bassom and Blennerhassett2014, Reference Thomas, Blennerhassett, Bassom and Davies2015), a streamwise oscillating channel (Blennerhassett & Bassom Reference Blennerhassett and Bassom2006; Thomas et al. Reference Thomas, Bassom, Blennerhassett and Davies2011) or pipe (Blennerhassett & Bassom Reference Blennerhassett and Bassom2006; Thomas et al. Reference Thomas, Bassom, Blennerhassett and Davies2011; Thomas, Bassom & Blennerhassett Reference Thomas, Bassom and Blennerhassett2012) as well as a torsionally oscillating pipe (Blennerhassett & Bassom Reference Blennerhassett and Bassom2007; Thomas et al. Reference Thomas, Bassom and Blennerhassett2012), thereby resolving some of the inconsistencies of previous linear stability analyses and establishing, among others, curves of marginal linear instability for this family of flows. The spatio-temporal impulse response of the Stokes layer was studied by Thomas et al. (Reference Thomas, Davies, Bassom and Blennerhassett2014), and the fate of some disturbances when they become nonlinear was also considered.
Luo & Wu (Reference Luo and Wu2010) revisited the linear instability of finite Stokes layers, comparing results obtained by instantaneous instability theory in a quasi-steady approach with those from Floquet analysis. It was shown that during its amplification phase, a Floquet mode closely follows the instantaneous unstable mode, and the results by Blennerhassett & Bassom (Reference Blennerhassett and Bassom2002) were confirmed.
Transition to turbulence has been investigated by direct numerical simulations of the Stokes boundary layer by Vittori & Verzicco (Reference Vittori and Verzicco1998), Costamagna, Vittori & Blondeaux (Reference Costamagna, Vittori and Blondeaux2003) and Ozdemir, Hsu & Balachandar (Reference Ozdemir, Hsu and Balachandar2014). Tuzi & Blondeaux (Reference Tuzi and Blondeaux2008) have addressed the intermittent turbulent regime observed in a pulsating pipe. These studies consider flow in wavy walled channels or pipes and it is observed that turbulence generally appears around flow reversal, and that it displays statistical properties similar to those prevailing in the steady case.
1.2 Objectives and organization of the paper
By considering the fundamental configuration of pulsatile channel flow, the aim of the present study is to systematically document the temporal dynamics of small-amplitude perturbations and, in unstable situations, to characterize the resulting finite-amplitude regime of travelling nonlinear modulated waves.
Revisiting the linear regime, using both Floquet analyses and linearized numerical simulations, we confirm the earlier findings and analyse in full detail three-dimensional perturbations over large parameter ranges.
The so-far neglected finite-amplitude travelling wave solutions prevailing for linearly unstable base flows are computed by direct numerical simulations of the complete Navier–Stokes equations, at prescribed total pulsating flow rates. Again, the purpose is to identify and analyse the characteristic regimes and to systematically explore a wide parameter space.
To this end, after introducing the governing equations and the geometry in § 2, the base flow and non-dimensional parameters are specified in § 3. The different mathematical approaches used in this work are formulated in § 4, while the associated numerical solution methods and relevant validation steps are discussed in appendix A. The main body of the paper consists of the results pertaining to the linear (§ 5) and nonlinear (§ 6) dynamics. In both cases, we start by discussing the features of characteristic examples, before progressively taking into account variations of more parameters in order to explore how the dynamics unfolds over the complete parameter space. The paper finishes (§ 7) with a summary and some suggestions for future work.
2 Governing equations and geometry
Throughout this study, the fluid flow is described by a vector velocity field
 $\boldsymbol{u}(\boldsymbol{x},t)$
and a scalar pressure field
 $p(\boldsymbol{x},t)$
that depend on position
 $\boldsymbol{x}$
and time
 $t$
and are governed by the incompressible Navier–Stokes equations
 $$\begin{eqnarray}\displaystyle & \displaystyle \frac{\unicode[STIX]{x2202}\boldsymbol{u}}{\unicode[STIX]{x2202}t}+(\boldsymbol{u}\boldsymbol{\cdot }\unicode[STIX]{x1D735})\boldsymbol{u}=\unicode[STIX]{x1D708}\unicode[STIX]{x0394}\boldsymbol{u}-\unicode[STIX]{x1D735}p+\boldsymbol{f}, & \displaystyle\end{eqnarray}$$
 $$\begin{eqnarray}\displaystyle & \displaystyle 0=\unicode[STIX]{x1D735}\boldsymbol{\cdot }\boldsymbol{u}, & \displaystyle\end{eqnarray}$$
where
 $\unicode[STIX]{x1D708}$
is the kinematic viscosity of the fluid (and the pressure has been redefined to eliminate the constant fluid density from the equations). In the momentum equation (2.1), the term
 $\boldsymbol{f}(\boldsymbol{x},t)$
represents an externally applied volume force.
The fluid domain is bounded by two fixed parallel plates, along which no-slip boundary conditions prevail. Using a Cartesian coordinate system, position is given by
 $\boldsymbol{x}=x_{0}\boldsymbol{e}_{0}+x_{1}\boldsymbol{e}_{1}+x_{2}\boldsymbol{e}_{2}$
, where
 $x_{0}$
,
 $x_{1}$
and
 $x_{2}$
(respectively
 $\boldsymbol{e}_{0}$
,
 $\boldsymbol{e}_{1}$
and
 $\boldsymbol{e}_{2}$
) denote wall-normal, streamwise and spanwise coordinates (respectively unit vectors), and the domain corresponds to
 $|x_{0}|<h$
where
 $2h$
is the channel width.
3 Base flow and non-dimensional parameters
A pulsatile base flow, of frequency
 $\unicode[STIX]{x1D6FA}$
, is an exact solution of the Navier–Stokes equations that is temporally periodic and consists of a velocity field purely in the streamwise direction that only depends on the wall-normal coordinate:
 $$\begin{eqnarray}\displaystyle \boldsymbol{U}(\boldsymbol{x},t)=U_{1}(x_{0},t)\boldsymbol{e}_{1}\quad \text{with }U_{1}(x_{0},t)=\mathop{\sum }_{n}U_{1}^{(n)}(x_{0})\exp (\text{i}n\unicode[STIX]{x1D6FA}t). & & \displaystyle\end{eqnarray}$$
Such a base flow is associated with a spatially uniform and temporally periodic streamwise pressure gradient of the form
 $-G(t)\boldsymbol{e}_{1}$
, with
 $$\begin{eqnarray}\displaystyle G(t)=\mathop{\sum }_{n}G^{(n)}\exp (\text{i}n\unicode[STIX]{x1D6FA}t), & & \displaystyle\end{eqnarray}$$
and corresponds to a temporally periodic flow rate
 $$\begin{eqnarray}\displaystyle Q(t)=\mathop{\sum }_{n}Q^{(n)}\exp (\text{i}n\unicode[STIX]{x1D6FA}t). & & \displaystyle\end{eqnarray}$$
In the above expressions, the conditions
 $Q^{(-n)}=[Q^{(n)}]^{\star }$
,
 $G^{(-n)}=[G^{(n)}]^{\star }$
, and
 $U_{1}^{(-n)}(x_{0})=[U_{1}^{(n)}(x_{0})]^{\star }$
ensure that all flow quantities are real (with
 $\star$
denoting complex conjugate).
Using these expansions in the Navier–Stokes equations shows that the different harmonics of the base flow are decoupled and yields the linear relationship between the flow-rate components
 $Q^{(n)}$
and the velocity components
 $U_{1}^{(n)}(x_{0})$
as
 $$\begin{eqnarray}\displaystyle U_{1}^{(n)}(x_{0})=\frac{Q^{(n)}}{2h}W\left(\frac{x_{0}}{h},\sqrt{n}Wo\right), & & \displaystyle\end{eqnarray}$$
where the Womersley number
 $Wo$
is defined as
 $$\begin{eqnarray}\displaystyle Wo\equiv h\sqrt{\unicode[STIX]{x1D6FA}/\unicode[STIX]{x1D708}}, & & \displaystyle\end{eqnarray}$$
and the function
 $W$
determines the profiles of the different velocity components and is defined as
 $$\begin{eqnarray}\displaystyle W(\unicode[STIX]{x1D709},w)\equiv \left\{\begin{array}{@{}ll@{}}\displaystyle \left(\frac{\cosh (\sqrt{\text{i}}\unicode[STIX]{x1D709}w)}{\cosh (\sqrt{\text{i}}w)}-1\right)/\left(\frac{\tanh (\sqrt{\text{i}}w)}{\sqrt{\text{i}}w}-1\right) & \displaystyle \text{if }w\neq 0\\ \displaystyle {\textstyle \frac{3}{2}}(1-\unicode[STIX]{x1D709}^{2}) & \displaystyle \text{if }w=0,\end{array}\right. & & \displaystyle\end{eqnarray}$$
for
 $|\unicode[STIX]{x1D709}|\leqslant 1$
, using
 $\sqrt{\text{i}}\equiv (1+\text{i})/\sqrt{2}$
. These profiles (3.6) are normalized to unit cross-sectionally averaged velocity.
Furthermore, the pressure and flow-rate components are related as
 $$\begin{eqnarray}\displaystyle \frac{Q^{(n)}}{G^{(n)}}=2\frac{h^{3}}{\unicode[STIX]{x1D708}}\frac{\text{i}}{nWo^{2}}\left(\frac{\tanh (\sqrt{\text{i}n}Wo)}{\sqrt{\text{i}n}Wo}-1\right)\quad \text{if }n\neq 0\quad \text{and}\quad \frac{Q^{(0)}}{G^{(0)}}=\frac{2}{3}\frac{h^{3}}{\unicode[STIX]{x1D708}}. & & \displaystyle\end{eqnarray}$$
Hence it is obvious that the pulsatile base flow is entirely determined by its frequency
 $\unicode[STIX]{x1D6FA}$
and the Fourier components
 $Q^{(n)}$
of the flow rate (or the components
 $G^{(n)}$
of the associated pressure gradient).
The mathematical and numerical methods implemented in the present study can handle flow rates of the form (3.3) with an arbitrary number of Fourier components, but this would correspond to a tremendously large multi-dimensional parameter space, impossible to explore exhaustively. Since, the aim here is to systematically analyse the behaviour of fundamental pulsating-flow configurations, the control-parameter space is restricted by investigating only base flow rates with a single oscillating component, i.e. for which
 $Q^{(n)}=0$
as
 $|n|\geqslant 2$
. Without loss of generality,
 $Q^{(1)}$
may then be restricted to real values. As only flows with a non-vanishing mean-flow component
 $Q^{(0)}$
will be considered, it is then convenient to write
 $$\begin{eqnarray}\displaystyle Q(t)=Q^{(0)}(1+\tilde{Q}\cos \unicode[STIX]{x1D6FA}t), & & \displaystyle\end{eqnarray}$$
where the relative amplitude
 $\tilde{Q}$
of the oscillating flow-rate component is defined as
 $$\begin{eqnarray}\displaystyle \tilde{Q}\equiv 2Q^{(1)}/Q^{(0)}. & & \displaystyle\end{eqnarray}$$
After defining a Reynolds number
 $$\begin{eqnarray}\displaystyle Re\equiv Q^{(0)}/\unicode[STIX]{x1D708}, & & \displaystyle\end{eqnarray}$$
based on the mean velocity
 $Q^{(0)}/2h$
, the channel width
 $2h$
and the viscosity
 $\unicode[STIX]{x1D708}$
, the base flow is entirely specified by three non-dimensional control parameters: the Womersley number
 $Wo$
(3.5), the Reynolds number
 $Re$
(3.10) and the relative amplitude of the oscillating flow-rate component
 $\tilde{Q}$
(3.9).
Snapshots of typical base-flow profiles are given in figure 1. Remember that the oscillating profiles develop a boundary layer near the walls of thickness
 $\unicode[STIX]{x1D6FF}=\sqrt{\unicode[STIX]{x1D708}/\unicode[STIX]{x1D6FA}}$
. The relative thickness of this boundary layer is governed by the Womersley number since
 $Wo=h/\unicode[STIX]{x1D6FF}$
. Throughout this paper, reference is often made to acceleration (respectively deceleration) phases of the base flow, here defined as phases during which the flow rate
 $Q(t)$
increases (respectively decreases). Note that since the boundary layers near the walls are out of phase with the bulk flow, the actual fluid accelerations or decelerations at different positions in the channel cross-section do not coincide exactly with such a global definition based on the sign of
 $\text{d}Q/\text{d}t$
.
Snapshots of typical base-flow profile associated with a flow rate of the form
 $Q(t)/Q^{(0)}=1+\tilde{Q}\cos \unicode[STIX]{x1D6FA}t$
. In this example,
 $Wo=10$
and
 $\tilde{Q}=0.6$
and ten profiles over one complete pulsation cycle are shown.

4 Mathematical formulation
In this entire study, the total instantaneous flow fields are separated into basic and perturbation quantities as
 $$\begin{eqnarray}\displaystyle & \displaystyle \boldsymbol{u}_{tot}(\boldsymbol{x},t)=U_{1}(x_{0},t)\boldsymbol{e}_{1}+\boldsymbol{u}(\boldsymbol{x},t), & \displaystyle\end{eqnarray}$$
 $$\begin{eqnarray}\displaystyle & \displaystyle p_{tot}(\boldsymbol{x},t)=-G(t)x_{1}+p(\boldsymbol{x},t), & \displaystyle\end{eqnarray}$$
whether the perturbation is of small amplitude (for linear stability analyses) or not (for investigating the fully developed nonlinear dynamics). The momentum and continuity equations for the perturbation quantities
 $\boldsymbol{u}(\boldsymbol{x},t)\equiv u_{0}(\boldsymbol{x},t)\boldsymbol{e}_{0}+u_{1}(\boldsymbol{x},t)\boldsymbol{e}_{1}+u_{2}(\boldsymbol{x},t)\boldsymbol{e}_{2}$
and
 $p(\boldsymbol{x},t)$
then read, in dimensional form,
 $$\begin{eqnarray}\displaystyle & \displaystyle \frac{\unicode[STIX]{x2202}\boldsymbol{u}}{\unicode[STIX]{x2202}t}+U_{1}\frac{\unicode[STIX]{x2202}\boldsymbol{u}}{\unicode[STIX]{x2202}x_{1}}+u_{0}\frac{\unicode[STIX]{x2202}U_{1}}{\unicode[STIX]{x2202}x_{0}}\boldsymbol{e}_{1}+(\boldsymbol{u}\boldsymbol{\cdot }\unicode[STIX]{x1D735})\boldsymbol{u}=\unicode[STIX]{x1D708}\unicode[STIX]{x0394}\boldsymbol{u}-\unicode[STIX]{x1D735}p+\boldsymbol{f}, & \displaystyle\end{eqnarray}$$
 $$\begin{eqnarray}\displaystyle & \displaystyle 0=\unicode[STIX]{x1D735}\boldsymbol{\cdot }\boldsymbol{u}. & \displaystyle\end{eqnarray}$$
The external volume force
 $\boldsymbol{f}(\boldsymbol{x},t)$
is mainly used in nonlinear evolution problems for maintaining the prescribed total pulsatile flow rate; it will be specified and discussed below (§ 4.3). Also, the initial perturbation in both linear and nonlinear evolution problems is triggered by a small-amplitude impulsive
 $\boldsymbol{f}$
, and it has been checked that the resulting dynamics does not depend on the details of this initial impulse.
4.1 Linear temporal evolution problem
When carrying out a linear stability analysis for small-amplitude perturbations, the quadratic terms
 $(\boldsymbol{u}\boldsymbol{\cdot }\unicode[STIX]{x1D735})\boldsymbol{u}$
in the previous equation (4.3) may be neglected. Since the base flow is homogeneous in directions parallel to the channel walls, infinitesimally small velocity and pressure disturbances may then be written by resorting to spatial normal modes of the form
 $$\begin{eqnarray}\displaystyle & \displaystyle \boldsymbol{u}(\boldsymbol{x},t)=\boldsymbol{u}^{l}(x_{0},t)\exp \text{i}(\unicode[STIX]{x1D6FC}_{1}x_{1}+\unicode[STIX]{x1D6FC}_{2}x_{2}), & \displaystyle\end{eqnarray}$$
 $$\begin{eqnarray}\displaystyle & \displaystyle p(\boldsymbol{x},t)=p^{l}(x_{0},t)\exp \text{i}(\unicode[STIX]{x1D6FC}_{1}x_{1}+\unicode[STIX]{x1D6FC}_{2}x_{2}), & \displaystyle\end{eqnarray}$$
where
 $\unicode[STIX]{x1D6FC}_{1}$
and
 $\unicode[STIX]{x1D6FC}_{2}$
are the streamwise and spanwise wavenumbers, respectively. Substitution of (4.5), (4.6) into the linearized version of the governing equations (4.3), (4.4) yields
 $$\begin{eqnarray}\displaystyle & \displaystyle \unicode[STIX]{x2202}_{t}u_{0}+\text{i}\unicode[STIX]{x1D6FC}_{1}U_{1}u_{0}=\unicode[STIX]{x1D708}(\unicode[STIX]{x2202}_{00}-\unicode[STIX]{x1D6FC}_{1}^{2}-\unicode[STIX]{x1D6FC}_{2}^{2})u_{0}-\unicode[STIX]{x2202}_{0}p, & \displaystyle\end{eqnarray}$$
 $$\begin{eqnarray}\displaystyle & \displaystyle \unicode[STIX]{x2202}_{t}u_{1}+\text{i}\unicode[STIX]{x1D6FC}_{1}U_{1}u_{1}+(\unicode[STIX]{x2202}_{0}U_{1})u_{0}=\unicode[STIX]{x1D708}(\unicode[STIX]{x2202}_{00}-\unicode[STIX]{x1D6FC}_{1}^{2}-\unicode[STIX]{x1D6FC}_{2}^{2})u_{1}-\text{i}\unicode[STIX]{x1D6FC}_{1}p, & \displaystyle\end{eqnarray}$$
 $$\begin{eqnarray}\displaystyle & \displaystyle \unicode[STIX]{x2202}_{t}u_{2}+\text{i}\unicode[STIX]{x1D6FC}_{1}U_{1}u_{2}=\unicode[STIX]{x1D708}(\unicode[STIX]{x2202}_{00}-\unicode[STIX]{x1D6FC}_{1}^{2}-\unicode[STIX]{x1D6FC}_{2}^{2})u_{2}-\text{i}\unicode[STIX]{x1D6FC}_{2}p, & \displaystyle\end{eqnarray}$$
 $$\begin{eqnarray}\displaystyle & \displaystyle 0=\unicode[STIX]{x2202}_{0}u_{0}+\text{i}\unicode[STIX]{x1D6FC}_{1}u_{1}+\text{i}\unicode[STIX]{x1D6FC}_{2}u_{2}, & \displaystyle\end{eqnarray}$$
with the notation
 $\unicode[STIX]{x2202}_{t}\equiv \unicode[STIX]{x2202}/\unicode[STIX]{x2202}t$
,
 $\unicode[STIX]{x2202}_{0}\equiv \unicode[STIX]{x2202}/\unicode[STIX]{x2202}x_{0}$
and
 $\unicode[STIX]{x2202}_{00}\equiv \unicode[STIX]{x2202}^{2}/\unicode[STIX]{x2202}x_{0}^{2}$
. Together with no-slip boundary conditions along the channel walls, this system of partial differential equations consists of a temporal evolution problem for the complex-valued functions
 $u_{0}$
,
 $u_{1}$
,
 $u_{2}$
and
 $p$
that depend on a single spatial coordinate,
 $x_{0}$
, and is numerically solved using the method outlined in § A.3 of the appendix.
4.2 Floquet analysis
Instead of integrating the previous linear temporal evolution problem by starting with a given initial condition, the linear stability of pulsating channel flow can also be studied by solving the eigenproblems arising from a Floquet analysis, thus obtaining the complete spectrum and the associated eigenfunctions.
Since the base flow is time periodic with pulsation
 $\unicode[STIX]{x1D6FA}$
, perturbations are sought in normal-mode form as
 $$\begin{eqnarray}\displaystyle & \displaystyle \boldsymbol{u}(\boldsymbol{x},t)=\left[\mathop{\sum }_{n}\hat{\boldsymbol{u}}^{(n)}(x_{0})\exp \text{i}n\unicode[STIX]{x1D6FA}t\right]\exp \text{i}(\unicode[STIX]{x1D6FC}_{1}x_{1}+\unicode[STIX]{x1D6FC}_{2}x_{2}-\unicode[STIX]{x1D714}t), & \displaystyle\end{eqnarray}$$
 $$\begin{eqnarray}\displaystyle & \displaystyle p(\boldsymbol{x},t)=\left[\mathop{\sum }_{n}\hat{p}^{(n)}(x_{0})\exp \text{i}n\unicode[STIX]{x1D6FA}t\right]\exp \text{i}(\unicode[STIX]{x1D6FC}_{1}x_{1}+\unicode[STIX]{x1D6FC}_{2}x_{2}-\unicode[STIX]{x1D714}t), & \displaystyle\end{eqnarray}$$
where the complex frequency
 $\unicode[STIX]{x1D714}$
is the eigenvalue, and the eigenfunctions
 $$\begin{eqnarray}\displaystyle \hat{\boldsymbol{u}}(x_{0},t)\equiv \mathop{\sum }_{n}\hat{\boldsymbol{u}}^{(n)}(x_{0})\exp \text{i}n\unicode[STIX]{x1D6FA}t\quad \text{and}\quad \hat{p}(x_{0},t)\equiv \mathop{\sum }_{n}\hat{p}^{(n)}(x_{0})\exp \text{i}n\unicode[STIX]{x1D6FA}t\qquad & & \displaystyle\end{eqnarray}$$
have the same temporal periodicity as the base flow.
Substitution of these expansions, with
 $\hat{\boldsymbol{u}}^{(n)}(x_{0})\equiv \hat{u} _{0}^{(n)}(x_{0})\boldsymbol{e}_{0}+\hat{u} _{1}^{(n)}(x_{0})\boldsymbol{e}_{1}+\hat{u} _{2}^{(n)}(x_{0})\boldsymbol{e}_{2}$
, into (4.7)–(4.10) yields the Floquet eigenvalue problem. This system of linear coupled ordinary differential equations in the
 $x_{0}$
-coordinate may be written, for each integer
 $n$
, as
 $$\begin{eqnarray}\displaystyle \unicode[STIX]{x1D714}\hat{u} _{0}^{(n)}=n\unicode[STIX]{x1D6FA}\hat{u} _{0}^{(n)}+\unicode[STIX]{x1D6FC}_{1}\mathop{\sum }_{k}U_{1}^{(k)}\hat{u} _{0}^{(n-k)}+\text{i}\unicode[STIX]{x1D708}(\unicode[STIX]{x2202}_{00}-\unicode[STIX]{x1D6FC}_{1}^{2}-\unicode[STIX]{x1D6FC}_{2}^{2})\hat{u} _{0}^{(n)}-\text{i}\unicode[STIX]{x2202}_{0}\hat{p}^{(n)}, & & \displaystyle\end{eqnarray}$$
 $$\begin{eqnarray}\displaystyle \unicode[STIX]{x1D714}\hat{u} _{1}^{(n)} & = & \displaystyle n\unicode[STIX]{x1D6FA}\hat{u} _{1}^{(n)}+\unicode[STIX]{x1D6FC}_{1}\mathop{\sum }_{k}U_{1}^{(k)}\hat{u} _{1}^{(n-k)}-\text{i}\mathop{\sum }_{k}\unicode[STIX]{x2202}_{0}U_{1}^{(k)}\hat{u} _{0}^{(n-k)}\nonumber\\ \displaystyle & & \displaystyle +\,\text{i}\unicode[STIX]{x1D708}(\unicode[STIX]{x2202}_{00}-\unicode[STIX]{x1D6FC}_{1}^{2}-\unicode[STIX]{x1D6FC}_{2}^{2})\hat{u} _{1}^{(n)}+\unicode[STIX]{x1D6FC}_{1}\hat{p}^{(n)},\end{eqnarray}$$
 $$\begin{eqnarray}\displaystyle & \displaystyle \unicode[STIX]{x1D714}\hat{u} _{2}^{(n)}=n\unicode[STIX]{x1D6FA}\hat{u} _{2}^{(n)}+\unicode[STIX]{x1D6FC}_{1}\mathop{\sum }_{k}U_{1}^{(k)}\hat{u} _{2}^{(n-k)}+\text{i}\unicode[STIX]{x1D708}(\unicode[STIX]{x2202}_{00}-\unicode[STIX]{x1D6FC}_{1}^{2}-\unicode[STIX]{x1D6FC}_{2}^{2})\hat{u} _{2}^{(n)}+\unicode[STIX]{x1D6FC}_{2}\hat{p}^{(n)}, & \displaystyle\end{eqnarray}$$
 $$\begin{eqnarray}\displaystyle & \displaystyle 0=-\text{i}\unicode[STIX]{x2202}_{0}\hat{u} _{0}^{(n)}+\unicode[STIX]{x1D6FC}_{1}\hat{u} _{1}^{(n)}+\unicode[STIX]{x1D6FC}_{2}\hat{u} _{2}^{(n)}, & \displaystyle\end{eqnarray}$$
together with no-slip boundary conditions along the channel walls
 $$\begin{eqnarray}\displaystyle \hat{u} _{0}^{(n)}=\hat{u} _{1}^{(n)}=\hat{u} _{2}^{(n)}=0\quad \text{for }x_{0}=\pm h. & & \displaystyle\end{eqnarray}$$
In the above momentum equations (4.14)–(4.16), the coupling of the different Fourier components of the velocity eigenfunctions occurs through the base-flow velocity components. Note that, since
 $U_{1}^{(k)}=0$
for
 $|k|\geqslant 2$
in the configurations under investigation (3.8), the coupling of the eigenvelocities through the base flow only occurs between
 $n$
and
 $n-1$
,
 $n$
or
 $n+1$
. The numerical solution of this generalized eigenvalue problem (4.14)–(4.18) is outlined in § A.2 of the appendix.
The long-term evolution of a given mode is dictated by the complex frequency
 $\unicode[STIX]{x1D714}$
, or equivalently by the Floquet multiplier
 $\unicode[STIX]{x1D707}\equiv \exp (-\text{i}\unicode[STIX]{x1D714}T)$
which accounts for the gain after one complete pulsation period. The complex frequency of the most unstable or least stable mode depends on all parameters through a linear dispersion relation as
 $$\begin{eqnarray}\displaystyle \unicode[STIX]{x1D714}=\unicode[STIX]{x1D714}^{lin}(\unicode[STIX]{x1D6FC}_{1},\unicode[STIX]{x1D6FC}_{2};Re,Wo,\tilde{Q}). & & \displaystyle\end{eqnarray}$$
Whenever
 $\unicode[STIX]{x1D714}_{i}>0$
, or equivalently
 $|\unicode[STIX]{x1D707}|>1$
, the perturbation is unstable and grows exponentially over a large number of pulsation periods. Note, however, that within a pulsation period the dynamics differs from such an exponential behaviour due to the base-flow pulsation.
4.3 Nonlinear temporal evolution problem
In unstable situations, an initial small-amplitude perturbation of wave vector
 $\unicode[STIX]{x1D6FC}_{1}\boldsymbol{e}_{1}+\unicode[STIX]{x1D6FC}_{2}\boldsymbol{e}_{2}$
may be amplified and eventually reach finite amplitudes so that the nonlinear term in (4.3) can no longer be neglected. Expanding the finite-amplitude disturbance as
 $$\begin{eqnarray}\displaystyle & \displaystyle \boldsymbol{u}(\boldsymbol{x},t)=\mathop{\sum }_{n}\boldsymbol{u}^{(n)}(x_{0},t)\exp \text{i}n(\unicode[STIX]{x1D6FC}_{1}x_{1}+\unicode[STIX]{x1D6FC}_{2}x_{2}), & \displaystyle\end{eqnarray}$$
 $$\begin{eqnarray}\displaystyle & \displaystyle p(\boldsymbol{x},t)=\mathop{\sum }_{n}p^{(n)}(x_{0},t)\exp \text{i}n(\unicode[STIX]{x1D6FC}_{1}x_{1}+\unicode[STIX]{x1D6FC}_{2}x_{2}), & \displaystyle\end{eqnarray}$$
and replacing these expansions with
 $\boldsymbol{u}^{(n)}(x_{0},t)\equiv u_{0}^{(n)}(x_{0},t)\boldsymbol{e}_{0}+u_{1}^{(n)}(x_{0},t)\boldsymbol{e}_{1}+u_{2}^{(n)}(x_{0},t)\boldsymbol{e}_{2}$
into (4.3), (4.4) results in a nonlinear temporal evolution problem consisting of a system of coupled partial differential equations for the different flow components
 $$\begin{eqnarray}\displaystyle & \displaystyle \unicode[STIX]{x2202}_{t}u_{0}^{(n)}+\text{i}n\unicode[STIX]{x1D6FC}_{1}U_{1}u_{0}^{(n)}+\mathop{\sum }_{k}N^{(n,k)}u_{0}^{(k)}=\unicode[STIX]{x1D708}\unicode[STIX]{x1D6E5}^{(n)}u_{0}^{(n)}-\unicode[STIX]{x2202}_{0}p^{(n)}, & \displaystyle\end{eqnarray}$$
 $$\begin{eqnarray}\displaystyle & \displaystyle \unicode[STIX]{x2202}_{t}u_{1}^{(n)}+\text{i}n\unicode[STIX]{x1D6FC}_{1}U_{1}u_{1}^{(n)}+(\unicode[STIX]{x2202}_{0}U_{1})u_{0}^{(n)}+\mathop{\sum }_{k}N^{(n,k)}u_{1}^{(k)}=\unicode[STIX]{x1D708}\unicode[STIX]{x1D6E5}^{(n)}u_{1}^{(n)}-\text{i}n\unicode[STIX]{x1D6FC}_{1}p^{(n)}, & \displaystyle\end{eqnarray}$$
 $$\begin{eqnarray}\displaystyle & \displaystyle \unicode[STIX]{x2202}_{t}u_{2}^{(n)}+\text{i}n\unicode[STIX]{x1D6FC}_{1}U_{1}u_{2}^{(n)}+\mathop{\sum }_{k}N^{(n,k)}u_{2}^{(k)}=\unicode[STIX]{x1D708}\unicode[STIX]{x1D6E5}^{(n)}u_{2}^{(n)}-\text{i}n\unicode[STIX]{x1D6FC}_{2}p^{(n)}, & \displaystyle\end{eqnarray}$$
 $$\begin{eqnarray}\displaystyle & \displaystyle 0=\unicode[STIX]{x2202}_{0}u_{0}^{(n)}+\text{i}n\unicode[STIX]{x1D6FC}_{1}u_{1}^{(n)}+\text{i}n\unicode[STIX]{x1D6FC}_{2}u_{2}^{(n)}, & \displaystyle\end{eqnarray}$$
where the operators
 $N^{(n,k)}$
and
 $\unicode[STIX]{x1D6E5}^{(n)}$
are defined as
 $$\begin{eqnarray}\displaystyle N^{(n,k)}\equiv u_{0}^{(n-k)}\unicode[STIX]{x2202}_{0}+u_{1}^{(n-k)}\text{i}k\unicode[STIX]{x1D6FC}_{1}+u_{2}^{(n-k)}\text{i}k\unicode[STIX]{x1D6FC}_{2}\quad \text{and}\quad \unicode[STIX]{x1D6E5}^{(n)}\equiv \unicode[STIX]{x2202}_{00}-n^{2}\unicode[STIX]{x1D6FC}_{1}^{2}-n^{2}\unicode[STIX]{x1D6FC}_{2}^{2}.\qquad \quad & & \displaystyle\end{eqnarray}$$
This is akin to performing a direct numerical simulation in a finite domain with periodic boundary conditions in the wall-parallel coordinates. The initial-value problem of interest here is the temporal development of a streamwise and spanwise-periodic small-amplitude perturbation, characterized by real values of
 $\unicode[STIX]{x1D6FC}_{1}$
and
 $\unicode[STIX]{x1D6FC}_{2}$
. The initial evolution is dictated by the linear temporal growth rate
 $\unicode[STIX]{x1D714}_{i}$
, obtained from a linear stability analysis. Whenever
 $\unicode[STIX]{x1D714}_{i}>0$
, modulated exponential temporal growth takes place until nonlinear effects come into play. The quadratic nonlinear terms of the Navier–Stokes equations then promote higher spatial harmonics of the form
 $\boldsymbol{u}^{(n)}(x_{0},t)\exp \text{i}n(\unicode[STIX]{x1D6FC}_{1}x_{1}+\unicode[STIX]{x1D6FC}_{2}x_{2})$
as well as a spatially homogeneous flow correction
 $\boldsymbol{u}^{(0)}(x_{0},t)$
. Terms of the form
 $\exp \text{i}(n\unicode[STIX]{x1D6FC}_{1}x_{1}+m\unicode[STIX]{x1D6FC}_{2}x_{2})$
with
 $m\neq n$
would only be generated by secondary instabilities; therefore, finite-amplitude flow fields may be expanded here as a single spatial Fourier series (4.20), (4.21) since the aim is to obtain finite-amplitude primary solutions. A complete secondary stability analysis of these primary nonlinear waves is beyond the scope of the present investigation.
The development, through nonlinear interactions, of a spatially homogeneous flow correction
 $\boldsymbol{u}^{(0)}(x_{0},t)$
results in a modification of the streamwise total flow rate by
 $$\begin{eqnarray}\displaystyle q_{1}(t)=\int _{-h}^{+h}u_{1}^{(0)}(x_{0},t)\,\text{d}x_{0}, & & \displaystyle\end{eqnarray}$$
and three-dimensional oblique waves may also give rise to a non-vanishing spanwise flow rate
 $$\begin{eqnarray}\displaystyle q_{2}(t)=\int _{-h}^{+h}u_{2}^{(0)}(x_{0},t)\,\text{d}x_{0}. & & \displaystyle\end{eqnarray}$$
Since there is no mean pressure gradient associated with a perturbation of the form (4.21), the governing equations (4.3), (4.4) for perturbations of the form (4.20), (4.21) without an external volume force
 $\boldsymbol{f}$
correspond to a temporal evolution problem at prescribed total pressure gradient. In order to simulate a temporal evolution at prescribed total flow rate, the assumed form of the pressure (4.21) is not sufficiently general: one must allow for the development of a spatially homogeneous pressure gradient, which is equivalent to an external volume force of the form
 $\boldsymbol{f}=-g_{1}(t)\boldsymbol{e}_{1}\,-g_{2}(t)\boldsymbol{e}_{2}$
and entails the additional terms
 $-g_{1}(t)$
and
 $-g_{2}(t)$
on the right-hand side of (4.23) and (4.24) when
 $n=0$
. This additional force, or pressure gradient, in the streamwise and spanwise directions may be tuned so that disturbances develop without modifying the base flow rate, which is purely in the streamwise direction. The numerical computation of the required
 $g_{1}(t)$
and
 $g_{2}(t)$
will be discussed in § A.3.
5 Linear dynamics
The configurations under investigation are completely determined by three non-dimensional control parameters: the Womersley number
 $Wo$
(3.5), the Reynolds number
 $Re$
(3.10) and the relative amplitude of the oscillating flow-rate component
 $\tilde{Q}$
(3.9). Numerical results, however, depend on the choice of units for space and time. In the sequel, distances are measured in units of the channel diameter (here
 $2h$
) and velocities in units of mean base-flow velocity (here
 $Q^{(0)}/2h$
). The associated time scale of
 $4h^{2}/Q^{(0)}$
then leads to a non-dimensional frequency of
 $\unicode[STIX]{x1D6FA}=4Wo^{2}/Re$
, which corresponds to a pulsation period of
 $T=\unicode[STIX]{x03C0}Re/2Wo^{2}$
.
With the non-dimensionalization adopted in this work, the steady Poiseuille flow is known to become linearly unstable for
 $Re>Re_{c}$
with
 $Re_{c}\simeq 7696$
, and the marginal perturbation at criticality is two-dimensional with a streamwise wavenumber of
 $\unicode[STIX]{x1D6FC}_{1,c}\simeq 2.041$
and a frequency of
 $\unicode[STIX]{x1D714}_{c}\simeq 0.808$
(see e.g. p. 73 of Schmid & Henningson (Reference Schmid and Henningson2001) and references therein).
The approach used here is to investigate how the instability features are influenced by the presence of an additional pulsatile component. Starting from Poiseuille flow, the instability characteristics are monitored as the amplitude
 $\tilde{Q}$
of the oscillating base flow-rate component is increased. For most results presented below, the reference configuration is the steady Poiseuille flow at
 $Re=10\,000$
, which is linearly unstable. Depending on the pulsation frequency, measured by the Womersley number, the aim is to work out whether the pulsating component promotes or reduces the instability and how the linear dynamics is affected within a pulsation period and in the long term.
The linear stability analysis is introduced with typical temporal evolution problems, increasing only
 $\tilde{Q}$
while all other parameters are kept constant. Subsequently, more general situations are considered, varying the Womersley number
 $Wo$
, streamwise and spanwise wavenumbers
 $\unicode[STIX]{x1D6FC}_{1}$
and
 $\unicode[STIX]{x1D6FC}_{2}$
and eventually the Reynolds number
 $Re$
to obtain the critical conditions for onset of linear instability in the most general case.
5.1 Typical temporal evolution problems
To illustrate the temporal dynamics of small-amplitude perturbations developing in pulsatile channel flow, we first consider perturbations of streamwise wavenumber
 $\unicode[STIX]{x1D6FC}_{1}=2$
at
 $Re=10\,000$
.
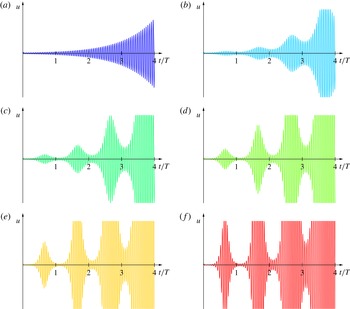
Temporal evolution of a small-amplitude perturbation with
 $\unicode[STIX]{x1D6FC}_{1}=2$
at
 $Re=10\,000$
and
 $Wo=10$
. Perturbation velocity time series for base flow with (a)
 $\tilde{Q}=0$
(Poiseuille flow), (b)
 $\tilde{Q}=0.02$
, (c)
 $\tilde{Q}=0.04$
, (d)
 $\tilde{Q}=0.06$
, (e)
 $\tilde{Q}=0.08$
and (f)
 $\tilde{Q}=0.10$
over 4 base-flow pulsation cycles. In this linear dynamics, the velocity scale is arbitrary but identical for all cases shown, and the same initial perturbation has been used throughout to trigger the perturbation.

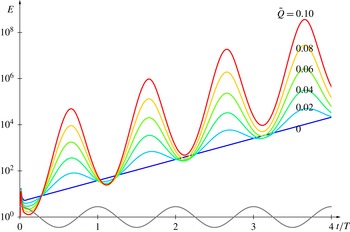
Temporal evolution of perturbation energy for
 $\tilde{Q}=0.00$
,
 $0.02,\ldots ,0.08$
,
 $0.10$
at
 $\unicode[STIX]{x1D6FC}_{1}=2$
,
 $Re=10\,000$
and
 $Wo=10$
(same configurations as figure 2). Intracyclic modulation amplitude rapidly increases with the pulsation amplitude
 $\tilde{Q}$
, and it is observed that intracyclic growth (respectively decay) approximately coincides with base-flow deceleration (respectively acceleration) phases, as indicated by solid sinusoidal line representing
 $Q(t)$
(not to scale).

Figure 2(a) shows the temporal evolution of a perturbation developing in steady Poiseuille flow (with
 $\tilde{Q}=0$
), computed by time marching of (4.7)–(4.10). An exponentially growing linear travelling wave is seen to develop, where
 $\boldsymbol{u}^{l}(x_{0},t)\sim \exp (-\text{i}\unicode[STIX]{x1D714}t)$
with a complex frequency of
 $\unicode[STIX]{x1D714}=0.7497+0.0067\text{i}$
. This frequency is numerically determined by computing e.g.
 $\text{i}(\unicode[STIX]{x2202}_{t}u_{0})/u_{0}$
, and its value is also confirmed by solving the corresponding eigenvalue problem (4.14)–(4.18). The energy contained in the perturbation grows exponentially as
 $E\sim \exp (2\unicode[STIX]{x1D714}_{i}t)$
, see figure 3. Throughout this section on linear dynamics, the instantaneous energy
 $E(t)$
of a perturbation is defined as the spatially averaged value of
 $|\boldsymbol{u}(\boldsymbol{x},t)|^{2}$
per unit volume.
Adding to this base flow a pulsatile component of different magnitudes
 $\tilde{Q}=0.02,0.04,\ldots ,0.10$
, at
 $Wo=10$
, the perturbation is observed to undergo a modulated exponential growth (figure 2
b–f), where the modulations occur at the frequency of the base flow. The temporal evolution of the corresponding fluctuating energy is shown in figure 3. The long-term growth of the perturbation is governed by the Floquet multiplier
 $\unicode[STIX]{x1D707}\equiv \exp (-\text{i}\unicode[STIX]{x1D714}T)$
and may be derived in the direct numerical simulations by monitoring e.g.
 $u_{0}(x_{0},t+T)/u_{0}(x_{0},t)$
(see § A.3 for more details on the numerical implementation). Here, for
 $\tilde{Q}=0.02$
,
 $0.04$
,
 $0.06$
,
 $0.08$
and
 $0.10$
, the perturbation grows exponentially according to a complex frequency of
 $\unicode[STIX]{x1D714}=0.7495+0.0068\text{i}$
,
 $\unicode[STIX]{x1D714}=0.7490+0.0072\text{i}$
,
 $\unicode[STIX]{x1D714}=0.7481+0.0077\text{i}$
,
 $\unicode[STIX]{x1D714}=0.7468+0.0085\text{i}$
and
 $\unicode[STIX]{x1D714}=0.7852+0.0095\text{i}$
respectively. Again, these values are confirmed by solving the corresponding Floquet eigenproblems. Thus, the weak periodic component of the base flow is here responsible for a slight increase in growth rate (
 $\unicode[STIX]{x1D714}_{i}$
).
In these examples, the pulsatile component of the base flow only weakly affects the long-term perturbation growth: all energy curves in figure 3 display a similar mean slope in these logarithmic plots. However, the dynamics within each cycle significantly changes with increasing values of
 $\tilde{Q}$
. Indeed, the amplitude of the intracyclic modulations increases by approximately three orders of magnitude as
 $\tilde{Q}$
is increased from
 $0.02$
to
 $0.1$
.
Comparison of the energy curves with the base flow rate (solid grey curve in figure 3) shows that enhanced growth occurs in the deceleration phase of the base flow, while decay occurs during the acceleration phase. Although time dependent, this behaviour is similar to what is known for steady boundary layers developing along a flat plate, for which an adverse pressure gradient promotes transition while a favourable pressure gradient delays it (Kachanov Reference Kachanov1994). The importance of this intracyclic growth and decay rapidly increases with
 $\tilde{Q}$
, while the net growth over an entire base-flow cycle in these examples is of the same order as the growth prevailing for the equivalent steady Poiseuille configuration.
In order to characterize the intracyclic dynamics, it is convenient to compensate the computed quantities by removing the asymptotic long-term exponential growth, i.e. to consider
 $$\begin{eqnarray}\displaystyle \text{}\underline{\boldsymbol{u}}(x_{0},t)\equiv \boldsymbol{u}(x_{0},t)\exp (-\unicode[STIX]{x1D714}_{i}t)\quad \text{and}\quad \text{}\underline{E}(t)\equiv E(t)\exp (-2\unicode[STIX]{x1D714}_{i}t). & & \displaystyle\end{eqnarray}$$
Note that the compensated flow fields
 $\text{}\underline{\boldsymbol{u}}$
, obtained by processing data from direct numerical simulations, differ from the Floquet eigenfunctions only by a phase velocity term
 $\exp (\text{i}\unicode[STIX]{x1D714}_{r}t)$
. The ratio
 $$\begin{eqnarray}\displaystyle \text{}\underline{E}_{min}^{max}\equiv \frac{\max _{t}\text{}\underline{E}(t)}{\min _{t}\text{}\underline{E}(t)} & & \displaystyle\end{eqnarray}$$
is then a direct measure of the amplitude of the intracyclic modulations. While
 $\text{}\underline{E}_{min}^{max}=1$
for steady Poiseuille flow, it rapidly grows with the pulsatile component and reaches
 $\text{}\underline{E}_{min}^{max}=8042$
for
 $\tilde{Q}=0.10$
in the above example. More results for
 $\text{}\underline{E}_{min}^{max}$
over a large parameter space are presented below.
The velocity time series shown in figure 2 illustrate that the dynamics is governed by two distinct time scales: fast oscillations (associated with
 $\unicode[STIX]{x1D714}_{r}$
) are due to the spatially travelling wave, while the slower modulations are tuned to the frequency
 $\unicode[STIX]{x1D6FA}$
of the base flow. In these examples,
 $\unicode[STIX]{x1D714}_{r}/\unicode[STIX]{x1D6FA}\simeq 19$
as
 $\unicode[STIX]{x1D6FA}=4Wo^{2}/Re=0.04$
. This discrepancy of frequencies explains why a stability analysis in terms of Floquet eigenmodes (4.13) requires a large number of Fourier components to be successful, and the required number of modes rapidly increases with
 $\tilde{Q}$
. In theory, a Floquet analysis is preferable to a linearized direct numerical simulation since it yields the entire spectrum and not only the dominant mode. In practice, however, the size of the associated eigenproblems becomes rapidly unmanageable as
 $\tilde{Q}$
is increased, while the resolution requirements for a direct numerical simulation (DNS) are largely independent of
 $\tilde{Q}$
.
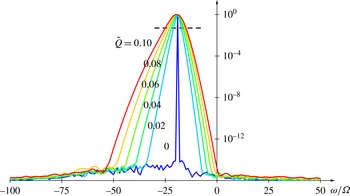
The number of Floquet harmonics that is required for a sufficient resolution of the modes may be estimated from DNS data. Indeed, a Fourier analysis of the compensated flow fields
 $\text{}\underline{\boldsymbol{u}}$
yields the spectra shown in figure 4. These spectra are centred around the dominant frequency in the signal, which corresponds to
 $-\unicode[STIX]{x1D714}_{r}$
, and their width (e.g. the number of modes above the dashed line at
 $1/20$
of the maximum) is directly related to the number of Fourier modes required to approximate the intracyclic dynamics. The rapid broadening of the spectra in figure 4 with
 $\tilde{Q}$
is associated with the increase of the intracyclic modulation amplitude, and highlights the sensitivity of the dynamics to the pulsating component of the base flow.
Spectra of compensated velocity time series for
 $\tilde{Q}=0.00,0.02,\ldots ,0.08,0.10$
at
 $\unicode[STIX]{x1D6FC}_{1}=2$
,
 $Wo=10$
and
 $Re=10\,000$
. The peak in these spectra near
 $\unicode[STIX]{x1D714}/\unicode[STIX]{x1D6FA}=-19$
is associated with the dominant frequency
 $-\unicode[STIX]{x1D714}_{r}$
of the travelling fluctuations. The width is related to the number of Fourier modes that are required in a Floquet analysis and is seen to rapidly increase with the base-flow pulsating amplitude
 $\tilde{Q}$
.

5.2 Temporal instability at
 $\unicode[STIX]{x1D6FC}_{1}=2$
and
$Re=10\,000$


The influence of the base-flow pulsating magnitude and frequency on disturbance growth has been systematically investigated at
 $Re=10\,000$
and
 $(\unicode[STIX]{x1D6FC}_{1},\unicode[STIX]{x1D6FC}_{2})=(2,0)$
for
 $5\leqslant Wo\leqslant 25$
and
 $0\leqslant \tilde{Q}\leqslant 0.6$
. The temporal growth rate
 $\unicode[STIX]{x1D714}_{i}$
has been computed both by direct numerical simulations of the linearized evolution equations and by solving the Floquet eigenproblems. For each value of the Womersley number
 $Wo=5,6,\ldots ,25$
, the pulsating magnitude
 $\tilde{Q}$
has been increased from
 $0$
to
 $0.6$
(in steps of
 $0.002$
) to illustrate the effect of an increasing oscillating component, starting with a Poiseuille flow, which is unstable in this configuration. For small values of
 $\tilde{Q}$
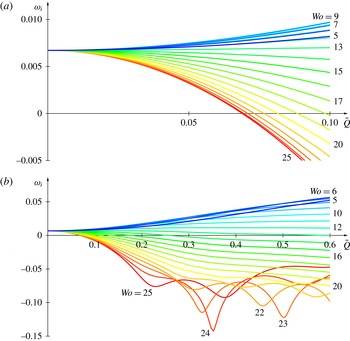
, the growth rate is seen to depend quadratically on the pulsating magnitude (figure 5
a), and the instability is enhanced at low frequencies (
 $Wo=5,\ldots ,13$
) while it is reduced at higher frequencies (
 $Wo=14,\ldots ,25$
); strongest destabilization occurs for
 $Wo=9$
. Note that the quadratic dependence in small values of
 $\tilde{Q}$
has been analytically established by Hall (Reference Hall1975) and von Kerczek (Reference von Kerczek1982). At larger values of
 $\tilde{Q}$
, perturbations are found to decay (
 $\unicode[STIX]{x1D714}_{i}<0$
) for Womersley numbers beyond
 $Wo=14$
, and the decay rate may display a non-monotonic dependence on
 $\tilde{Q}$
(figure 5
b).
Linear temporal growth rate at
 $Re=10\,000$
and
 $\unicode[STIX]{x1D6FC}_{1}=2$
for
 $0\leqslant \tilde{Q}\leqslant 0.6$
and
 $Wo=5,6,\ldots ,25$
.

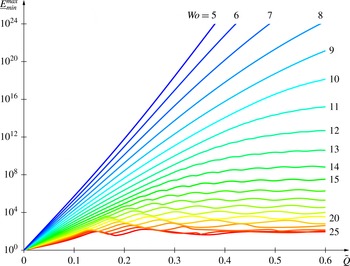
The intracyclic modulation amplitudes
 $\text{}\underline{E}_{min}^{max}$
computed for the same parameter ranges are given in figure 6. Whatever the Womersley number
 $Wo$
, the ratio
 $\text{}\underline{E}_{min}^{max}$
increases almost exponentially with
 $\tilde{Q}$
starting from Poiseuille flow (
 $\tilde{Q}=0$
). At larger pulsation amplitudes
 $\tilde{Q}$
, the growth of
 $\text{}\underline{E}_{min}^{max}$
is seen to saturate; however, at low Womersley numbers, the exponential growth of
 $\text{}\underline{E}_{min}^{max}$
continues to astronomical values as
 $\tilde{Q}$
increases. Since the intracyclic amplification
 $\text{}\underline{E}_{min}^{max}$
is related to the deceleration and acceleration phases of the base flow, its growth may be understood in the following manner. Increasing
 $\tilde{Q}$
at constant
 $Wo$
, corresponds to stronger deceleration and acceleration of the base flow without modifying their durations and therefore enhances the ratio
 $\text{}\underline{E}_{min}^{max}$
that is reached within each pulsation cycle. Moreover, reducing
 $Wo$
corresponds to increasing the pulsation period as
 $Wo^{-2}$
, and therefore stretching the duration of both deceleration and acceleration phases. Hence,
 $\text{}\underline{E}_{min}^{max}$
grows much faster with
 $\tilde{Q}$
at smaller values of
 $Wo$
.
Amplitude of intracyclic modulation
 $\text{}\underline{E}_{min}^{max}$
at
 $Re=10\,000$
and
 $\unicode[STIX]{x1D6FC}_{1}=2$
for
 $0\leqslant \tilde{Q}\leqslant 0.6$
and
 $5\leqslant Wo\leqslant 25$
.

Linear dynamics at
 $Re=10\,000$
and
 $\unicode[STIX]{x1D6FC}_{1}=2$
for
 $0\leqslant \tilde{Q}\leqslant 0.6$
and
 $5\leqslant Wo\leqslant 25$
. (a) DNS-based estimate of the number of Fourier modes required for a sufficiently resolved Floquet analysis. (b) Comparison of temporal growth rates, computed by linearized DNS (solid lines) and Floquet eigenproblems (symbols) with
 $N_{f}=30$
. Failure of truncated Floquet analysis (symbols off solid lines in b) largely corresponds to curves above dashed line in (a).

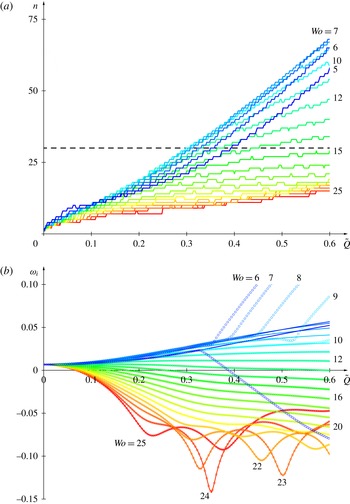
As discussed previously, in situations where significant intracyclic modulations take place, a large number of Fourier components is required when carrying out a stability analysis based on Floquet eigenproblems. From the DNS results, after computing Fourier spectra of the compensated velocity fields, the approximate number of Fourier modes required in a Floquet analysis can be determined: the data plotted in figure 7(a) correspond to the number of modes in the compensated spectrum with energy above
 $1/20$
of the maximum (above dashed line in figure 4). This plot may be used as a guideline for estimating the parameter region amenable to Floquet analysis. The relevance of this criterion is demonstrated in figure 7(b), comparing temporal growth rates computed both by linearized DNS (lines) and Floquet analysis (symbols) retaining
 $N_{f}=30$
Fourier components to expand the eigenmodes (4.13). As expected, both methods yield indistinguishable results up to
 $\tilde{Q}=0.6$
for moderate to large values of
 $Wo$
. It is only at lower pulsation frequencies, i.e. lower
 $Wo$
, that a truncated Floquet method is seen to fail beyond some value of
 $\tilde{Q}$
.
5.3 Two-dimensional instability analysis at
$Re=10\,000$

A complete two-dimensional instability analysis has been performed by exploring a range of streamwise wavenumbers,
 $0.5\leqslant \unicode[STIX]{x1D6FC}_{1}\leqslant 4.0$
, for each configuration. This range has been chosen so as to encompass all unstable wavenumbers for
 $5\leqslant Wo\leqslant 25$
and
 $0\leqslant \tilde{Q}\leqslant 0.6$
at
 $Re=10\,000$
.
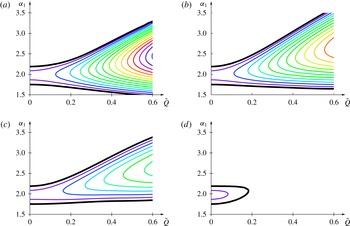
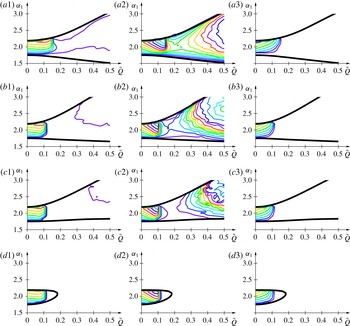
Figure 8 shows isolines of positive temporal growth rate for (a)
 $Wo=6$
, (b)
 $Wo=10$
, (c)
 $Wo=12$
and (d)
 $Wo=15$
, computed via linearized DNS. For Poiseuille flow (
 $\tilde{Q}=0$
), unstable wavenumbers range from
 $\unicode[STIX]{x1D6FC}_{1}\simeq 1.75$
to
 $\unicode[STIX]{x1D6FC}_{1}\simeq 2.19$
, and, as the amplitude
 $\tilde{Q}$
of the pulsating base-flow component is increased, this range evolves as well as the maximum growth rate that is achieved for each
 $\tilde{Q}$
.
As already observed, the instability is enhanced with increasing
 $\tilde{Q}$
for low to moderate Womersley numbers. Figure 8(a–c), corresponding to
 $Wo=6$
,
 $10$
and
 $12$
respectively, shows how the upper bound of the unstable wavenumber range increases almost linearly with
 $\tilde{Q}$
, while the lower bound depends much less on
 $\tilde{Q}$
. The most unstable wavenumber occurs roughly in the centre of the unstable range, and it is therefore observed that an increasing pulsation amplitude
 $\tilde{Q}$
favours instabilities at smaller wavelengths (larger
 $\unicode[STIX]{x1D6FC}_{1}$
). Thus, for these configurations, the maximum temporal growth rate is significantly larger than the values shown in figure 5 corresponding to a fixed
 $\unicode[STIX]{x1D6FC}_{1}=2$
.
At larger Womersley numbers (see figure 8
d corresponding to
 $Wo=15$
), the pulsating component has a stabilizing effect and the range of unstable
 $\unicode[STIX]{x1D6FC}_{1}$
disappears as
 $\tilde{Q}$
is increased.
Isolines of linear temporal growth rate for two-dimensional perturbations in
 $(\unicode[STIX]{x1D6FC}_{1},\tilde{Q})$
-plane at
 $Re=10\,000$
and (a)
 $Wo=6$
, (b)
 $Wo=10$
, (c)
 $Wo=12$
, (d)
 $Wo=15$
. Thick black lines correspond to the marginal curve
 $\unicode[STIX]{x1D714}_{i}=0$
and thin coloured lines to positive growth rates
 $\unicode[STIX]{x1D714}_{i}=0.005,0.010,0.015,\ldots .$

5.4 Three-dimensional instability analysis at
$Re=10\,000$

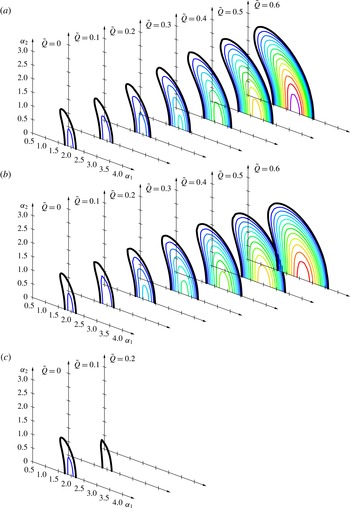
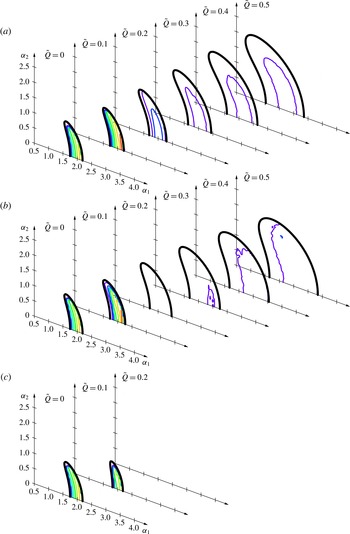
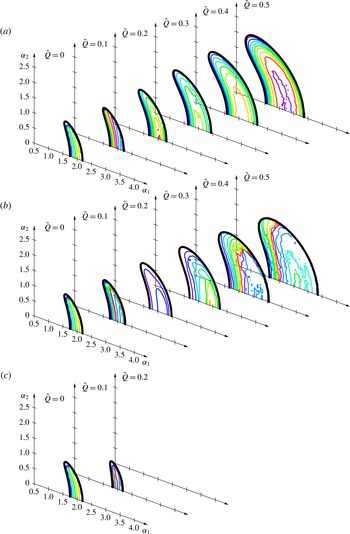
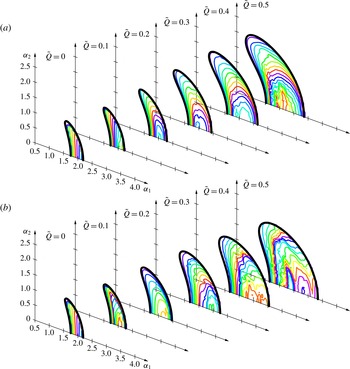
According to Squire’s theorem, which remains valid for pulsating flows (Conrad & Criminale Reference Conrad and Criminale1965), a two-dimensional analysis is sufficient to study onset of instability. Nonetheless, it is worth investigating the dynamics of three-dimensional perturbations developing in pulsatile channel flow. Figure 9 shows the temporal growth rate in the
 $(\unicode[STIX]{x1D6FC}_{1},\unicode[STIX]{x1D6FC}_{2})$
-wavevector plane for a range of pulsating amplitudes
 $\tilde{Q}$
and Womersley numbers
 $Wo$
, at
 $Re=10\,000$
.
At a high pulsation frequency of
 $Wo=15$
(figure 9
c), the pulsating component reduces the growth rates and base flows are stable at
 $\tilde{Q}=0.2$
and beyond. In contrast, at lower Womersley numbers, the base-flow pulsation enhances the instability and increases the range of unstable wavenumbers. At
 $Wo=5$
(figure 9
a), the maximum growth rate increases slightly faster with
 $\tilde{Q}$
than at
 $Wo=10$
(figure 9
b). While the maximum growth rate follows very similar trends at
 $Wo=5$
and 10, the evolution with
 $\tilde{Q}$
of the entire unstable region in the
 $(\unicode[STIX]{x1D6FC}_{1},\unicode[STIX]{x1D6FC}_{2})$
-wavevector plane shows some differences. Indeed, at
 $Wo=5$
(figure 9
a), the pulsation promotes spanwise modes associated with a finite
 $\unicode[STIX]{x1D6FC}_{2}$
and small
 $\unicode[STIX]{x1D6FC}_{1}$
. At
 $Wo=10$
(figure 9
b), the pulsation rather favours streamwise modes: as
 $\tilde{Q}$
is increased, the unstable region further extends in the direction of large values of
 $\unicode[STIX]{x1D6FC}_{1}$
.
Isolines of temporal growth rate
 $\unicode[STIX]{x1D714}_{i}$
in the
 $(\unicode[STIX]{x1D6FC}_{1},\unicode[STIX]{x1D6FC}_{2})$
-wavevector plane for
 $\tilde{Q}=0.0,0.1,\ldots ,0.6$
at (a)
 $Wo=5$
, (b)
 $Wo=10$
, (c)
 $Wo=15$
. Thick black lines correspond to the marginal curve
 $\unicode[STIX]{x1D714}_{i}=0$
and thin coloured lines to positive growth rates
 $\unicode[STIX]{x1D714}_{i}=0.005,0.010,0.015,\ldots .$

5.5 Critical Reynolds number
Whether a given base flow, characterized by the non-dimensional parameters
 $Re$
,
 $Wo$
and
 $\tilde{Q}$
, is linearly unstable or not depends on the growth rate of its most unstable or least stable mode:
 $$\begin{eqnarray}\displaystyle \unicode[STIX]{x1D714}_{i}^{max}(Re,Wo,\tilde{Q})\equiv \max _{\unicode[STIX]{x1D6FC}1,\unicode[STIX]{x1D6FC}2}\text{Im}\,\unicode[STIX]{x1D714}^{lin}(\unicode[STIX]{x1D6FC}1,\unicode[STIX]{x1D6FC}2;Re,Wo,\tilde{Q}). & & \displaystyle\end{eqnarray}$$
In accordance with Squire’s theorem, it is observed that the maximum growth rate always occurs for
 $\unicode[STIX]{x1D6FC}_{2}=0$
. Then, the critical Reynolds number
 $Re_{c}(Wo,\tilde{Q})$
for onset of instability at given values of
 $Wo$
and
 $\tilde{Q}$
is obtained by the condition of vanishing
 $\unicode[STIX]{x1D714}_{i}^{max}$
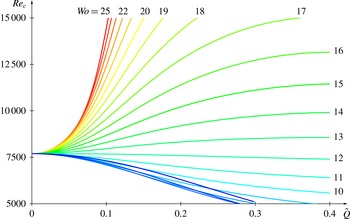
. The evolution of
 $Re_{c}$
with
 $\tilde{Q}$
for a range of
 $Wo$
is shown in figure 10. Poiseuille flow (
 $\tilde{Q}=0$
) corresponds to a critical Reynolds number of
 $Re_{c}=7696$
. For the configurations investigated here, the pulsating base-flow component is seen to have a stabilizing effect for Womersley numbers beyond
 $13$
. This stabilizing effect is very strong for
 $Wo>18$
: when increasing
 $\tilde{Q}$
, the critical Reynolds number more than doubles when
 $\tilde{Q}=0.2$
is reached. On the other hand, for lower frequencies, the pulsating component has a destabilizing effect, which appears to be strongest around
 $Wo=7$
.
6 Nonlinear dynamics
In this section the aim is to analyse the fully developed dynamics sustained in linearly unstable base flows, in order to identify and characterize the different regimes that prevail in this configuration. Since fully developed perturbations naturally arise from the temporal development of a small-amplitude initial disturbance, the present approach is based on temporal evolution problems investigated by direct numerical simulations of the complete Navier–Stokes equations. The initial evolution is dictated by linear dynamics, as discussed in the previous section. Whenever the linear temporal growth rate is positive, the perturbation necessarily reaches finite-amplitude levels and nonlinear effects come into play. In the absence of secondary instabilities, a fully developed regime is then reached with spatial periodicity imposed by the prescribed values of streamwise and spanwise wavenumbers
 $\unicode[STIX]{x1D6FC}_{1}$
and
 $\unicode[STIX]{x1D6FC}_{2}$
.
Subcritical behaviour has been documented for plane Poiseuille flow (Ehrenstein & Koch Reference Ehrenstein and Koch1991) and is expected to exist also for pulsatile channel flow. However, it is beyond the scope of the present paper to investigate finite-amplitude regimes that may exist beyond the linearly unstable regions in parameter space.
Critical Reynolds number for onset of temporal instability as a function of the base-flow pulsation amplitude
 $\tilde{Q}$
for a range of Womersley numbers:
 $Wo=5,6,\ldots ,25$
.

6.1 Two characteristic examples of fully developed regimes
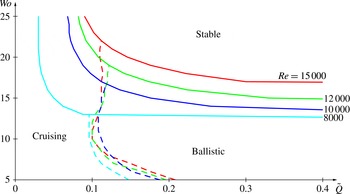
While carrying out direct numerical simulations over large regions of a multi-dimensional parameter space, essentially two types of fully developed regimes have been observed: ‘cruising’ regimes for which nonlinearities are sustained throughout the entire pulsation cycle and ‘ballistic’ regimes that are propelled into a nonlinear phase before subsiding again to small amplitudes within every cycle.
These two distinct regimes may be illustrated by analysing perturbations with
 $\unicode[STIX]{x1D6FC}_{1}=2$
developing in a base flow at
 $Re=10\,000$
and
 $Wo=10$
with two different pulsation amplitudes
 $\tilde{Q}=0.08$
and
 $0.20$
.
6.1.1 ‘Cruising’ nonlinear regime
For a pulsatile base flow at
 $Re=10\,000$
,
 $Wo=10$
and
 $\tilde{Q}=0.08$
, a small-amplitude perturbation of streamwise wavenumber
 $\unicode[STIX]{x1D6FC}_{1}=2$
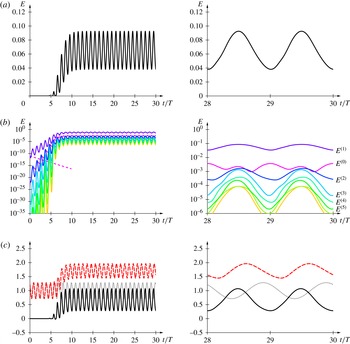
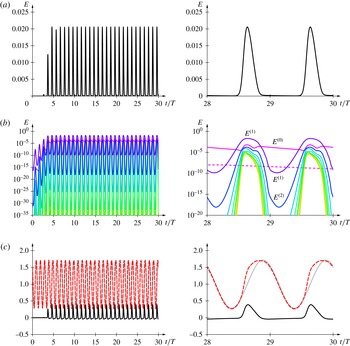
is linearly unstable and therefore leads to a fully developed regime. Figure 11(a) gives the temporal evolution of the total perturbation energy on a linear scale, while figure 11(b) shows the energy of the different spatial Fourier components on a logarithmic scale. Here, the instantaneous energy
 $E^{(n)}(t)$
of the
 $n$
th Fourier component of the perturbation is defined as the spatially averaged value of
 $|\boldsymbol{u}^{(n)}(x_{0},t)|^{2}$
per unit volume.
Instantaneous spatially averaged wall shear stress values are plotted in figure 11(c).
‘Cruising’ nonlinear regime resulting from modulated exponential growth of small-amplitude initial perturbation with
 $\unicode[STIX]{x1D6FC}_{1}=2$
at
 $Re=10\,000$
,
 $Wo=10$
and
 $\tilde{Q}=0.08$
. (a) Total perturbation energy. (b) Energy of each spatial Fourier component. (c) Spatially averaged wall shear stress of perturbation (black solid), total (red dashed) and base (grey dotted) fields relative to steady Poiseuille flow value.

During the early stages of the temporal evolution (here approximately
 $0<t/T<10$
), a linear regime prevails with a complex frequency of
 $\unicode[STIX]{x1D714}=0.7468+0.0085\text{i}$
and an intracyclic modulation amplitude of
 $\text{}\underline{E}_{min}^{max}=1.35\times 10^{3}$
. In this regime, the different Fourier components are classically slaved to the fundamental as
 $E^{(n)}\propto (E^{(1)})^{n}$
for
 $n\geqslant 2$
, and
 $E^{(0)}\propto (E^{(1)})^{2}$
. The mean slopes of the energy curves are seen to follow these scalings in figure 11(b), and the intracyclic modulations around these mean slopes do the same. It is only the mean-flow correction
 $E^{(0)}$
that is found to decay more slowly than
 $(E^{(1)})^{2}$
during the intracyclic decay phases. This slower decay of the spatially homogeneous component
 $E^{(0)}$
corresponds to viscous dissipation that is less efficient than the stabilization of the
 $E^{(1)}$
component during the base-flow acceleration phase. Indeed, for the same base flow, the decay of a spatially homogeneous perturbation with
 $\unicode[STIX]{x1D6FC}_{1}=\unicode[STIX]{x1D6FC}_{2}=0$
follows the dashed line in figure 11(b), which displays a similar slope as the mean-flow correction
 $E^{(0)}$
here in its phases of slow decay.
As finite-amplitude levels are reached (here beyond
 $t/T=10$
), a fully developed regime is entered consisting of a travelling nonlinear wave that is modulated by the pulsating base flow. In this regime, the modulation amplitude is no larger than the average values so that the regime remains fully nonlinear throughout the pulsation cycle and is characterized by a ratio of intracyclic modulation amplitudes of order unity, here
 $\text{}\underline{E}_{min}^{max}=2.51$
.
From figure 11(b) it is observed that the total perturbation energy is largely dominated by the fundamental component
 $E^{(1)}$
, even in the nonlinear regime. Higher harmonics are well below the fundamental and follow the same pattern of intracyclic modulation. It is only the mean-flow correction
 $E^{(0)}$
that displays a different trend: two intracyclic maxima, coinciding with the extrema of the fundamental (or the total) energy. The second maximum of
 $E^{(0)}$
that occurs when the perturbation is near its lowest is probably due to the continuing transfer of energy from the fundamental to the spatially homogeneous component and due to the fact that this energy is only slowly dissipated so that
 $E^{(0)}$
continues to build up while
 $E^{(1)}$
decreases. Monitoring the energy associated with the different Fourier components shows that this fully developed regime may be accurately computed by using only a limited number of components. All of the computations of the present study have been carried out with
 $N_{h}=9$
, and for most cases the fully developed dynamics was already well resolved with
 $N_{h}=5$
.
The instantaneous spatially averaged wall shear stress (WSS) is plotted in figure 11(c), relative to the value prevailing for a steady Poiseuille flow at the same Reynolds number. The wall shear stress component due to the perturbation (solid black curve) follows a similar evolution to the fluctuating energy (figure 11 a), which results in a significant increase of the total WSS (dashed red curve) and departure from the WSS prevailing for the base flow (dotted grey curve). The growth (respectively decay) of the perturbation WSS during the deceleration (respectively acceleration) phases of the base flow, results in a total spatially averaged WSS modulation out of phase with the base flow by approximately a quarter period, similar to what is observed for Stokes layers.
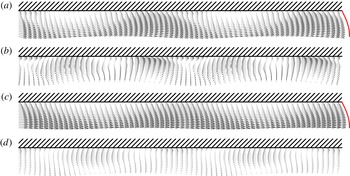
Snapshots of velocity fields in cruising nonlinear regime over two wavelengths with
 $\unicode[STIX]{x1D6FC}_{1}=2$
at
 $Re=10\,000$
,
 $Wo=10$
and
 $\tilde{Q}=0.08$
: (a) total velocity at
 $t/T=29.5$
, (b) perturbation velocity at
 $t/T=29.5$
, (c) total velocity at
 $t/T=30.0$
, (d) perturbation velocity at
 $t/T=30.0$
. Solid curves to the right of (a) and (c) indicate base-flow profile prevailing at the same instant.

This regime consists of a travelling nonlinear wave that propagates downstream with a temporally modulated amplitude. Snapshots of the flow fields over two wavelengths are shown in figure 12, near maximum energy at
 $t/T=29.5$
(a,b) and minimum energy at
 $t/T=30.0$
(c,d). The total flow fields (a,c) display the sinuous structure of these nonlinear travelling waves, while the perturbation velocity fields (b,d) give an idea of the associated propagating vortices.
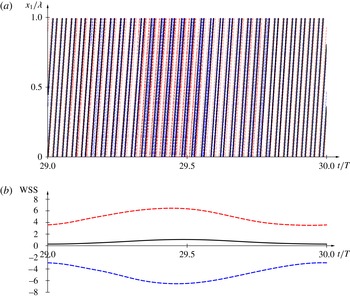
These modulated travelling nonlinear waves are associated with the spatio-temporal WSS pattern shown in figure 13(a) over one streamwise wavelength for one pulsation period. The characteristic oblique lines in this plot are associated with the nonlinear waves travelling at a nearly constant phase velocity. Their amplitude is modulated over the pulsation period, similarly to what has already been observed in figure 11. However, the wave-like nature of the flow structure is associated with local WSS values well above and below their spatial average shown in figure 11(c). The temporal evolution of the local maximum and minimum WSS values are shown in figure 13(b) together with the instantaneous spatial average. While the spatially averaged perturbation WSS values are of the same order as the base-flow contribution, the local extrema are significantly larger. Also, the modulation of these nonlinear propagating waves results in larger modulation amplitudes for the local extrema than for the spatially averaged values. Thus, this fully developed regime is associated with strong localized stresses in alternating directions travelling along the channel walls.
(a) Spatio-temporal pattern of the perturbation WSS in cruising regime over one streamwise wavelength
 $\unicode[STIX]{x1D706}=2\unicode[STIX]{x03C0}/\unicode[STIX]{x1D6FC}_{1}$
and one pulsation period. WSS values are relative to a steady Poiseuille flow at the same Reynolds number, and thick solid black isoline corresponding to
 $\text{WSS}=0$
separates thin dashed red (respectively blue) isolines corresponding to levels
 $\text{WSS}=2$
,
 $4$
,
 $6$
(respectively
 $\text{WSS}=-2$
,
 $-4$
,
 $-6$
). (b) Instantaneous spatially averaged (solid black), minimum (dashed blue) and maximum (dashed red) values of WSS.

6.1.2 ‘Ballistic’ nonlinear regime
The temporal evolution of an initial small-amplitude perturbation for a base flow at a larger pulsating amplitude of
 $\tilde{Q}=0.20$
is depicted in figure 14. In this example, the small-amplitude regime prevails approximately for
 $0<t/T<5$
, and, in that stage, the perturbation exponentially grows according to a complex frequency of
 $\unicode[STIX]{x1D714}=0.8119+0.0156\text{i}$
with a significantly larger intracyclic modulation amplitude of
 $\text{}\underline{E}_{min}^{max}=$
 $4.61\times 10^{7}$
.
‘Ballistic’ nonlinear regime resulting from modulated exponential growth of small-amplitude initial perturbation with
 $\unicode[STIX]{x1D6FC}_{1}=2$
at
 $Re=10\,000$
,
 $Wo=10$
and
 $\tilde{Q}=0.2$
. (a) Total perturbation energy. (b) Energy of each spatial Fourier component. (c) Spatially averaged wall shear stress of perturbation (black solid), total (red dashed) and base (grey dotted) fields relative to steady Poiseuille flow value.

Once finite amplitudes are reached, the essential difference with the previous configuration is that the nonlinear regime does not prevail throughout the entire pulsation cycle: the fully developed regime consists of regular nonlinear bursts separated by phases of nearly unperturbed base flow. Thus, the ratio of intracyclic modulation amplitudes is here much larger than unity,
 $\text{}\underline{E}_{min}^{max}=391$
, since the perturbation drops to very small levels during the linear phase of the cycle (figure 14
a).
Monitoring the temporal evolution of the energy contained in the different spatial Fourier components (figure 14
b), shows that the observations of the previous configuration still hold: during the linear phases, higher harmonics are slaved to the fundamental as
 $E^{(n)}\propto (E^{(1)})^{n}$
; a few Fourier components are enough to fully resolve the dynamics; during stabilization phases, the mean-flow correction
 $E^{(0)}$
decays on a slow time scale and therefore becomes un-slaved from the fundamental. Here the un-slaving of the mean-flow correction from the fundamental also occurs in the linear phases of the fully developed regime: the slow decay rate of the mean-flow correction is dictated by viscosity and is equivalent to that of a spatially homogeneous perturbation with
 $\unicode[STIX]{x1D6FC}_{1}=\unicode[STIX]{x1D6FC}_{2}=0$
indicated by a dashed line in figure 14(b). Again, the total perturbation energy is dominated by the fundamental component, except during the linear phases of the fully developed regime where the fundamental drops to negligible levels while the mean-flow correction lags behind. Note also that due to these alternating linear and nonlinear phases, the energy levels in the ballistic regime are significantly lower than those of the cruising regime.
The temporal evolution of the associated WSS is shown in figure 14(c). Obviously the WSS associated with the perturbation (solid black curve) is only significant during the nonlinear phases. These nonlinear phases are relatively short compared with the pulsation period, therefore the total WSS (dashed red curve) in the fully developed regime only weakly departs from the WSS prevailing for the base flow (dotted grey curve).
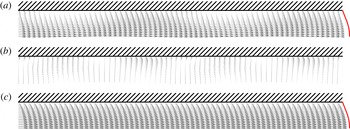
This fully developed regime consists of periodic nonlinear bursts that are identically regenerated during every pulsation cycle. Snapshots of the flow fields over two wavelengths are shown in figure 15. Near maximum energy at
 $t/T=29.6$
, the total flow fields (figure 15
a) exhibit the sinuous structure of the finite-amplitude travelling perturbation; this sinuosity is, however, less pronounced than in figure 12(a) since the perturbation is less energetic here. The associated perturbed fields at
 $t/T=29.6$
are represented in figure 15(b). In the linear phase, at
 $t/T=30.0$
, the total flow fields (figure 15
c) are indistinguishable from the base flow since the perturbation has negligible amplitude.
Snapshots of velocity fields in ballistic nonlinear regime over two wavelengths with
 $\unicode[STIX]{x1D6FC}_{1}=2$
at
 $Re=10\,000$
,
 $Wo=10$
and
 $\tilde{Q}=0.2$
: (a) total velocity at
 $t/T=29.6$
, (b) perturbation velocity at
 $t/T=29.6$
, (c) total velocity at
 $t/T=30.0$
when the perturbation is negligible. Solid curves to the right of (a,c) indicate base-flow profile prevailing at same instant.

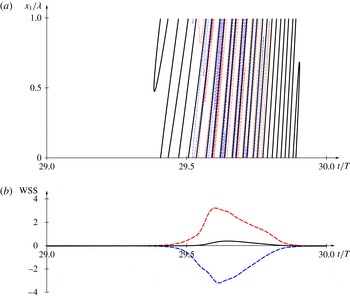
(a) Spatio-temporal pattern of the perturbation WSS in ballistic regime over one streamwise wavelength
 $\unicode[STIX]{x1D706}=2\unicode[STIX]{x03C0}/\unicode[STIX]{x1D6FC}_{1}$
and one pulsation period. WSS values are relative to a steady Poiseuille flow at the same Reynolds number, and the thick solid black isoline corresponding to
 $\text{WSS}=0$
separates the thin dashed red (respectively blue) isolines corresponding to levels
 $\text{WSS}=1$
,
 $2$
,
 $3$
(respectively
 $\text{WSS}=-1$
,
 $-2$
,
 $-3$
). (b) Instantaneous spatially averaged (solid black), minimum (dashed blue) and maximum (dashed red) values of WSS.

These nonlinear bursting travelling waves are associated with the spatio-temporal WSS pattern shown in figure 16(a). As already noted, the perturbation WSS is only significant during the nonlinear phases of the dynamics, here approximately for
 $29.4<t/T<29.8$
. While the spatially averaged perturbation WSS (solid black curve in figure 16
b) does not exceed half the mean value prevailing for the base flow, the local extrema due the travelling wave structure reach values that are an order of magnitude larger. Thus the ballistic regime is still associated with intense spatially localized WSS events, while the spatially averaged values remain rather weak (see also figure 14
c).
6.1.3 Terminology
These two markedly different fully developed dynamics exemplified by the configurations discussed in this section have motivated the terms ‘cruising’ and ‘ballistic’ regimes by analogy with cruising and ballistic flight: the ‘cruising’ perturbations are continuously driven by nonlinearities while the ‘ballistic’ state is characterized by ‘take-off’ and ‘landing’ of the perturbation energy level. More precisely, in the cruising regime, nonlinearities are sustained throughout the pulsation cycle, resulting in a fully developed regime with a modulated amplitude, that may be interpreted as saturated Tollmien–Schlichting waves undergoing modulations caused by the pulsation of the underlying base flow. In contrast, the ballistic regime consists of linear and nonlinear phases that alternate within every pulsation cycle: from a small-amplitude minimum reached near the middle of the linear phase, strong linear growth thrusts the system into a nonlinear regime that culminates after saturation at finite amplitude, before collapsing again and subsiding towards the next minimum.
6.2 Nonlinear dynamics at
$\unicode[STIX]{x1D6FC}_{1}=2$
and
$Re=10\,000$


The fully developed regime that prevails after perturbations reach finite amplitudes has been systematically investigated at
 $\unicode[STIX]{x1D6FC}_{1}=2$
and
 $Re=10\,000$
for Womersley numbers in the range
 $5\leqslant Wo\leqslant 25$
and increasing pulsation amplitudes
 $\tilde{Q}$
. Figure 17 shows the temporal evolution of the perturbation energy in the final regime over two base-flow pulsation periods for
 $0\leqslant \tilde{Q}\leqslant 0.2$
.
Temporal evolution of perturbation energy in fully developed regime at (a)
 $Wo=7$
, (b)
 $Wo=10$
, (c)
 $Wo=15$
, (d)
 $Wo=20$
, for
 $\tilde{Q}=0.00$
(horizontal line),
 $0.02,0.04,\ldots ,0.20$
and
 $\unicode[STIX]{x1D6FC}_{1}=2$
,
 $Re=10\,000$
.

For Poiseuille flow, i.e.
 $\tilde{Q}=0$
, finite-amplitude Tollmien–Schlichting waves with constant energy are selected (dark blue horizontal lines in figure 17).
As the base-flow pulsation amplitude
 $\tilde{Q}$
is increased, these nonlinear travelling waves display energy modulations around a mean value: in this cruising regime the temporally averaged perturbation energy remains very close to the value prevailing for
 $\tilde{Q}=0$
. As for the linear dynamics (see figure 3), energy builds up during base-flow deceleration (
 $n<t/T<n+0.5$
for integer
 $n$
) while it declines during base-flow acceleration (
 $n+0.5<t/T<n+1$
); recall that the definition of base-flow acceleration and deceleration phases is based on the sign of
 $\text{d}Q/\text{d}t$
.
The amplitude of these perturbation energy modulations grows as
 $\tilde{Q}$
is increased. Eventually the minimum energy value reached near
 $t/T=n$
drops to a low level, and the flow behaviour switches then to a ballistic regime, characterized by linear phases of negligible perturbation amplitudes alternating with finite-amplitude bursts. This transition from cruising to ballistic regimes appears to be rather sudden: curves in figure 17 correspond to constant steps in
 $\tilde{Q}$
of
 $0.02$
, and they display a gap at the transition between these two nonlinear regimes. At larger pulsation frequencies, see figure 17(d) at
 $Wo=20$
, the base-flow modulation has a stabilizing effect so that the ballistic regime is never selected: as
 $\tilde{Q}$
is increased, the critical value for stability is reached while the flow is still in a cruising regime. The fully developed modulated Tollmien–Schlichting waves that prevail at the lower values of
 $\tilde{Q}$
could probably be interpreted as inviscid vorticity waves and described by a Korteweg–de Vries equation, following a similar approach than that proposed by Tutty & Pedley (Reference Tutty and Pedley1994). In that context, the transition from cruising to ballistic regimes may be governed by a similar mechanism than that leading to cnoidal waves in a Korteweg–de Vries model.
Note also that when the critical value of
 $\tilde{Q}$
for transition from cruising to ballistic regimes is approached, the energy curves display small-scale irregular fluctuations that break the overall periodicity of the flow from one pulsation period to the next and are believed to be the sign of secondary instabilities rather than numerical instabilities since this same behaviour is observed after changing spatial and temporal resolutions of the simulations. These secondary instabilities certainly play a role in the precise transition scenario between the two nonlinear regimes. However, the present numerical implementation was designed to investigate the structure of nonlinear travelling waves of given spatial wavenumbers and does not take into account sufficient degrees of freedom for a full secondary stability analysis, which is left for future investigations.
At larger base-flow modulation amplitudes, the maximum energy reached during the nonlinear bursts in the ballistic regime increases again with
 $\tilde{Q}$
, as illustrated in figure 18 for
 $0.2\leqslant \tilde{Q}\leqslant 0.4$
and
 $Wo=7$
and
 $10$
. Eventually, the nonlinear bursts occurring at every base-flow pulsation period display some variation from one period to the next. Depending on the control parameters, the fluctuations that affect the regular pattern associated with the ballistic regime result either in period doubling or more irregular behaviour. A more detailed characterization of the fully developed regimes prevailing beyond these periodic nonlinear waves has not been attempted.
Temporal evolution of perturbation energy in fully developed regime at (a)
 $Wo=7$
, (b)
 $Wo=10$
, for
 $\tilde{Q}=0.20$
(dark blue),
 $0.22,\ldots ,0.38,0.40$
(red) and
 $\unicode[STIX]{x1D6FC}_{1}=2$
,
 $Re=10\,000$
. The maximum energy of the nonlinear bursts increases with
 $\tilde{Q}$
and, at larger values of
 $\tilde{Q}$
, successive peaks culminate at slightly different levels.

Phase diagram of the flow dynamics for
 $Re=10\,000$
and
 $\unicode[STIX]{x1D6FC}_{1}=2$
. A cruising regime prevails at low base-flow modulation amplitudes
 $\tilde{Q}$
. At larger
 $\tilde{Q}$
, to the right of the dashed curve, a ballistic regime takes over. Above the black curve, the pulsating base flow is linearly stable.

The phase diagram in figure 19 indicates the nature of the selected regime over the whole range of investigated Womersley numbers:
 $5\leqslant Wo\leqslant 25$
. The cruising regime prevails at low base-flow modulation amplitudes, starting from Poiseuille flow at
 $\tilde{Q}=0$
. At larger values of
 $\tilde{Q}$
, to the right of the dashed curve, transition to a ballistic regime occurs. The pulsating base flow is linearly stable above the black curve. The critical value of
 $\tilde{Q}$
where the transition between the two nonlinear regimes occurs is seen to weakly depend on the Womersley number. It is only at low values of
 $Wo$
that the cruising regime survives significantly beyond
 $\tilde{Q}\simeq 0.1$
. At larger pulsation frequencies (i.e. larger
 $Wo$
), the stabilizing effect of the base-flow pulsation competes with its enhancing effect on the perturbation energy modulation. Thus, as already observed in figure 17(d) for
 $Wo=20$
, the ballistic regime is suppressed and the cruising regime prevails over the entire range of unstable
 $\tilde{Q}$
, here for
 $Wo\geqslant 17$
.
The criterion used to distinguish between cruising and ballistic regimes is based on the ratio
 $\text{}\underline{E}_{min}^{max}$
of the energy perturbation in the fully developed regime. This ratio is of order
 $1$
for cruising regimes and increases more than tenfold in the ballistic regime, characterized by vanishing energy levels in its linear phases. Since the transition between both nonlinear regimes occurs rather suddenly, the boundary between both regimes is largely independent of the precise value of the critical ratio
 $\text{}\underline{E}_{min}^{max}$
used.
6.3 Two-dimensional nonlinear dynamics at
$Re=10\,000$

The complete two-dimensional nonlinear travelling wave solutions have been computed by exploring the whole range of linearly unstable wavenumbers
 $\unicode[STIX]{x1D6FC}_{1}$
for
 $0\leqslant \tilde{Q}\leqslant 0.5$
and
 $5\leqslant Wo\leqslant 25$
at
 $Re=10\,000$
.
Isolines of perturbation energy levels for two-dimensional fully developed nonlinear regimes in
 $(\unicode[STIX]{x1D6FC}_{1},\tilde{Q})$
-plane at
 $Re=10\,000$
and (a)
 $Wo=6$
, (b)
 $Wo=10$
, (c)
 $Wo=12$
, (d)
 $Wo=15$
. Panels (1) represent temporally averaged energy, while (2) and (3) give maximum and minimum values respectively. Colour isolines correspond to
 $E=0.01,0.02,0.03,\ldots ,$
and the thick black curve represents the neutral boundary.

Figure 20 shows characteristic features of perturbation energy for selected configurations. Panels of the first column (
 $a1$
–
 $d1$
) in this figure illustrate the temporally averaged energy of the fully developed regime prevailing in the linearly unstable domain of the
 $(\unicode[STIX]{x1D6FC}_{1},\tilde{Q})$
-plane for (
 $a1$
)
 $Wo=6$
, (
 $b1$
)
 $Wo=10$
, (
 $c1$
)
 $Wo=12$
and (
 $d1$
)
 $Wo=15$
. Panels in the second (
 $a2$
–
 $d2$
) and third (
 $a3$
–
 $d3$
) columns correspond respectively to maximum and minimum energy values in the same regimes.
For Poiseuille flow, constant-amplitude Tollmien–Schlichting waves are obtained, so that all plots correspond to the same values along the line
 $\tilde{Q}=0$
.
Increasing the base-flow pulsation amplitude
 $\tilde{Q}$
results in modulated nonlinear travelling waves with increasing modulation amplitude. For example, considering the case
 $Wo=6$
(figure 20
 $a1$
–
 $a3$
) and concentrating on
 $\unicode[STIX]{x1D6FC}_{1}=2$
for
 $0\leqslant \tilde{Q}\leqslant 0.1$
, it is seen that the average energy (figure 20
 $a1$
) remains almost constant while the maximum energy (figure 20
 $a2$
) increases with
 $\tilde{Q}$
and the minimum energy (figure 20
 $a3$
) decreases. The same observation holds for different values of
 $\unicode[STIX]{x1D6FC}_{1}$
and
 $Wo$
: for
 $0\leqslant \tilde{Q}\leqslant 0.1$
, the discrepancy between maximum energy (figure 20
 $a2$
–
 $d2$
) and the corresponding minimum energy (figure 20
 $a3$
–
 $d3$
) increases with
 $\tilde{Q}$
, while the average energy (figure 20
 $a1$
–
 $d1$
) remains almost constant in
 $\tilde{Q}$
. It is found that this cruising regime prevails over all unstable wavenumbers
 $\unicode[STIX]{x1D6FC}_{1}$
, and that the modulation amplitude is more pronounced at smaller wave lengths (larger
 $\unicode[STIX]{x1D6FC}_{1}$
). Note also that the nonlinear regime displays finite-amplitude energy levels up to the upper marginal wavenumber (near
 $\unicode[STIX]{x1D6FC}_{1}\simeq 2.2$
): it is expected that these nonlinear solutions continue to exist in the linearly stable region for larger values of
 $\unicode[STIX]{x1D6FC}_{1}$
, but the investigation of such sub-critical nonlinear modulated solutions by continuation methods has not yet been attempted.
The cruising regime, characterized by energy modulations around a mean value that is rather independent of
 $\tilde{Q}$
, extends over the entire range of linearly unstable
 $\unicode[STIX]{x1D6FC}_{1}$
from
 $\tilde{Q}=0$
to
 $\tilde{Q}\simeq 0.15$
at
 $Wo=6$
and to
 $\tilde{Q}\simeq 0.11$
at
 $Wo=10$
,
 $12$
and
 $15$
. Thus, the phase diagram of figure 19 remains valid after taking into account the whole range of unstable wavenumbers
 $\unicode[STIX]{x1D6FC}_{1}$
.
As already observed, the cruising regime ends rather suddenly when
 $\tilde{Q}$
is increased. The ballistic regime, that takes over at larger base-flow pulsation amplitudes, is characterized by much lower values of the temporally averaged energy (figure 20
 $a1$
–
 $c1$
) and vanishing values of minimum energy levels (figure 20
 $a3$
–
 $c3$
). The maximum energy (figure 20
 $a2$
–
 $c2$
) prevailing in the ballistic regime displays low values at onset of this regime (near
 $\tilde{Q}\simeq 0.15$
) and increases with
 $\tilde{Q}$
. The irregular shape of isolines in the ballistic regime is due to the loss of exact periodicity of the nonlinear solutions already observed in the previous section: when the successive nonlinear bursts are not perfectly identical, some scatter results while recording peak values in different realizations. At larger pulsation frequencies, the instabilities are suppressed as
 $\tilde{Q}$
is increased (figure 20
 $d1$
–
 $d3$
), thus avoiding the ballistic regime.
6.4 Three-dimensional nonlinear dynamics at
$Re=10\,000$

For given pulsating base flows, three-dimensional finite-amplitude modulated propagating waves have been computed over the entire linearly unstable region of the
 $(\unicode[STIX]{x1D6FC}_{1},\unicode[STIX]{x1D6FC}_{2})$
-wavevector plane. The linear temporal growth rate of three-dimensional perturbations has been discussed in § 5.4 and illustrated in figure 9.
The task of systematically investigating these fully developed nonlinear solutions has been carried out for
 $5\leqslant Wo\leqslant 25$
and
 $0\leqslant \tilde{Q}\leqslant 0.6$
at
 $Re=10\,000$
. For each base flow, characterized by the non-dimensional control parameters
 $\tilde{Q}$
,
 $Wo$
and
 $Re$
, the nonlinear temporal evolution problem has been simulated for those values of
 $(\unicode[STIX]{x1D6FC}_{1},\unicode[STIX]{x1D6FC}_{2})$
that are associated with a positive linear temporal growth rate. In this process, the
 $(\unicode[STIX]{x1D6FC}_{1},\unicode[STIX]{x1D6FC}_{2})$
-wavevector plane has been covered using steps of
 $0.05$
in both
 $\unicode[STIX]{x1D6FC}_{1}$
and
 $\unicode[STIX]{x1D6FC}_{2}$
and, for each run, characteristic quantities are derived from the fully developed nonlinear regime.
Figure 21 shows levels of temporally averaged perturbation energy while peak energy levels are plotted in figure 22. In these figures, colour isolines correspond to energy levels
 $E=0.01,0.02,\ldots ,$
and the thick black curve represents the neutral boundary.
Isolines of average energy levels for three-dimensional nonlinear solutions in the
 $(\unicode[STIX]{x1D6FC}_{1},\unicode[STIX]{x1D6FC}_{2})$
-wavevector plane for
 $\tilde{Q}=0.0,0.1,\ldots ,0.5$
at (a)
 $Wo=5$
, (b)
 $Wo=10$
, (c)
 $Wo=15$
and
 $Re=10\,000$
. Colour isolines correspond to
 $E=0.01,0.02,0.03,\ldots ,$
and the thick black curve represents the neutral boundary.

Isolines of maximum energy levels for three-dimensional nonlinear solutions in the
 $(\unicode[STIX]{x1D6FC}_{1},\unicode[STIX]{x1D6FC}_{2})$
-wavevector plane for
 $\tilde{Q}=0.0,0.1,\ldots ,0.5$
at (a)
 $Wo=5$
, (b)
 $Wo=10$
, (c)
 $Wo=15$
and
 $Re=10\,000$
. Colour isolines correspond to
 $E=0.01,0.02,0.03,\ldots ,$
and the thick black curve represents the neutral boundary.

At low base-flow modulation amplitudes,
 $\tilde{Q}=0.0$
and
 $0.1$
, the fully developed flow is in the cruising regime, characterized by a significant average perturbation energy (figure 21) and slightly larger maximum energy levels (figure 22). In this regime, average and peak energy levels significantly increase with
 $\unicode[STIX]{x1D6FC}_{1}$
, starting at low values near the small-
 $\unicode[STIX]{x1D6FC}_{1}$
neutral boundary and reaching finite values at the large-
 $\unicode[STIX]{x1D6FC}_{1}$
neutral boundary. The energy levels depend more weakly on
 $\unicode[STIX]{x1D6FC}_{2}$
, so that the isolevels remain roughly parallel to the neutral boundaries as
 $\unicode[STIX]{x1D6FC}_{2}$
is increased from
 $0$
.
Between
 $\tilde{Q}=0.1$
and
 $\tilde{Q}=0.2$
, the flow switches to ballistic regimes, and this transition is accompanied by a sharp drop in energy levels. Beyond
 $\tilde{Q}=0.2$
, for low to moderate pulsation frequencies, the perturbation energy levels increase again with
 $\tilde{Q}$
, very weakly on average (figure 21
a,b) but significantly for peak values (figure 22
a,b). In contrast, at higher Womersley numbers, base-flow pulsation has a stabilizing effect, see figures 21(c) and 22(c) at
 $Wo=15$
. In the ballistic regime, the energy isolines are more irregular for the same reasons as those mentioned in the previous sub-section, but the general trend of the peak energy levels remains the same, except that the largest values are reached within the linearly unstable region and not near the large-
 $\unicode[STIX]{x1D6FC}_{1}$
neutral boundary. Therefore it would be expected that the cruising nonlinear regime is more likely to display subcritical behaviour, i.e. to continue to exist beyond the large-
 $\unicode[STIX]{x1D6FC}_{1}$
neutral boundary, than the ballistic regime.
At a given value of
 $\tilde{Q}$
, the same regime is seen to prevail over the entire linearly unstable region of the
 $(\unicode[STIX]{x1D6FC}_{1},\unicode[STIX]{x1D6FC}_{2})$
-plane. Thus it appears that the phase diagram of figure 19 still remains valid after taking into account all linearly unstable three-dimensional waves.
The maximum localized WSS occurring in the nonlinear regimes is shown in figure 23. In this figure, colour isolines correspond to WSS levels of
 $0.5,1.0,1.5,\ldots ,$
relative to Poiseuille flow values. These plots follow a similar trend as the peak energy levels shown in figure 22, except that the regime change between
 $\tilde{Q}=0.1$
and
 $0.2$
is associated with a less pronounced drop in WSS.
Isolines of maximum local WSS levels for three-dimensional nonlinear solutions in the
 $(\unicode[STIX]{x1D6FC}_{1},\unicode[STIX]{x1D6FC}_{2})$
-wavevector plane for
 $\tilde{Q}=0.0,0.1,\ldots ,0.5$
at (a)
 $Wo=5$
, (b)
 $Wo=10$
and
 $Re=10\,000$
. Colour isolines correspond to
 $\text{WSS}=0.5,1.0,1.5,\ldots ,$
relative to Poiseuille value, and the thick black curve represents the neutral boundary.

6.5 Nonlinear dynamics at other Reynolds numbers
In order to systematically investigate the nonlinear dynamics prevailing after onset of linear instability, i.e. for Reynolds numbers above the marginal curves plotted in figure 10, two-dimensional nonlinear travelling wave solutions have been computed for linearly unstable configurations in the range
 $8000\leqslant Re\leqslant 15\,000$
.
The main findings are summarized in figure 24, extending the phase diagram of figure 19 and showing the nature of the selected flow regime in the
 $(\tilde{Q},Wo)$
-plane for
 $Re=8000$
,
 $10\,000$
,
 $12\,000$
and
 $15\,000$
. As in figure 19, these curves correspond to a fixed streamwise wavenumber of
 $\unicode[STIX]{x1D6FC}_{1}=2$
. In the preceding sections it has been shown, for
 $Re=10\,000$
, that this approach yields a good approximation of the boundary between cruising and ballistic regimes without exploring the whole region of linearly unstable three-dimensional waves in the
 $(\unicode[STIX]{x1D6FC}_{1},\unicode[STIX]{x1D6FC}_{2})$
-plane for each base flow. A systematic coverage of the five-dimensional parameter space (
 $Re$
,
 $Wo$
,
 $\tilde{Q}$
,
 $\unicode[STIX]{x1D6FC}_{1}$
,
 $\unicode[STIX]{x1D6FC}_{2}$
) would require of the order of
 $10^{6}$
runs for each value of
 $Re$
. Nonetheless, it has been checked that the curves of figure 24 are a faithful representation of the dominant flow dynamics prevailing for any linearly unstable wavenumbers.
In agreement with the linear results of § 5, the stable region of the
 $(\tilde{Q},Wo)$
-plane shrinks as the Reynolds number is increased: the stability boundary (solid curves in figure 24) moves toward larger values of
 $\tilde{Q}$
and
 $Wo$
with increasing
 $Re$
. In contrast, the boundary between cruising and ballistic regimes remains almost unchanged over the entire range from
 $Re=8000$
to
 $Re=15\,000$
. For all the base flows considered in this investigation, the transition from cruising to ballistic regimes is found to occur when the base-flow oscillation amplitude exceeds about
 $10$
%–
 $15\,\%$
of the steady flow component.
Maps in
 $(\tilde{Q},Wo)$
-plane indicating nature of the flow dynamics prevailing for a range of Reynolds numbers:
 $Re=8000$
,
 $10\,000$
,
 $12\,000$
and
 $15\,000$
. Dashed curves correspond to boundary between cruising and ballistic regimes. Above the solid curves the base flows are linearly stable.

7 Summary and future work
In this paper, we have systematically investigated the rich dynamics resulting from perturbations developing in harmonically pulsating channel flows, for Womersley numbers in the range
 $5\leqslant Wo\leqslant 25$
.
The temporal dynamics of small-amplitude perturbations consists of travelling waves that grow or decay exponentially in the long term while displaying intracyclic modulations tuned to the base-flow pulsations. Starting from steady Poiseuille flow and increasing the amplitude of the oscillating base-flow component
 $\tilde{Q}$
at constant Womersley number, it is found that the oscillating component reduces instability for
 $Wo\gtrsim 13$
while it has a destabilizing effect at lower frequencies. Strongest destabilization occurs near
 $Wo=7$
. Using Floquet analysis and linearized simulations, the present investigation confirms that growth rates depend quadratically on small values of
 $\tilde{Q}$
, a result analytically obtained by Hall (Reference Hall1975).
While instability (respectively stability) is determined by the net growth (respectively decay) of fluctuations over one complete pulsation cycle, strong transient growth and decay occur within each cycle. At small values of
 $\tilde{Q}$
, the intracyclic growth and decay phases almost balance so that the long-term growth remains similar to the Poiseuille value despite intracyclic modulation amplitudes that may reach several orders of magnitude. Intracyclic growth and decay mainly occur during base-flow deceleration and acceleration phases respectively, and intracyclic modulation is enhanced at low pulsation frequencies, i.e. for long durations of deceleration and acceleration phases. A side-effect of these strong intracyclic modulations is the requirement of a large number of Fourier modes for a reasonably resolved Floquet analysis. This also probably explains why earlier attempts at linear stability analyses by solving Floquet eigenproblems were fraught with difficulties, and only Thomas et al. (Reference Thomas, Bassom, Blennerhassett and Davies2011) were able to locate neutral conditions.
Exploring the whole range of three-dimensional perturbations does not change the general picture derived from two-dimensional stability analysis since Squire’s theorem remains valid for pulsating flows (Conrad & Criminale Reference Conrad and Criminale1965). Nonetheless, it is found that oblique perturbations at finite spanwise and small streamwise mode numbers are more strongly destabilized by low-frequency base-flow pulsation, e.g. at
 $Wo=5$
, than at frequencies around
 $Wo=10$
.
Using direct numerical simulations to compute the temporal evolution of fully developed nonlinear propagating waves resulting from linearly unstable situations has shown that there exist two distinct regimes of finite-amplitude dynamics. In the cruising regime, the perturbation evolves nonlinearly throughout the pulsation cycle, while the ballistic regime consists of linear and nonlinear phases that alternate, locked-in with the base-flow pulsation. Nonlinear solutions in the cruising regime may be interpreted as saturated Tollmien–Schlichting waves that are modulated by the base-flow pulsation. These cruising waves are selected for weak base-flow pulsation amplitudes
 $\tilde{Q}$
and their intracyclic modulation amplitudes increase with
 $\tilde{Q}$
, albeit not as drastically as in the linear regime. For stronger base-flow pulsations, the intracyclic modulation amplitude eventually becomes of the same order as the mean perturbation level. When such strongly modulated waves are no longer able to keep up with the nonlinear regime throughout the cycle, transition to the ballistic regime occurs. In the ballistic regime, the temporal evolution is then governed by the following sequence of steps: during base-flow deceleration phases, small-amplitude fluctuations grow fast, as in a purely linear setting, thus propelling the system into a nonlinear regime where the amplitude saturates at finite level; during subsequent base-flow acceleration, the perturbation amplitude declines until the flow falls back to the linear regime; the fluctuation amplitude then rapidly drops to reach a minimum near the maximum of the basic flow rate, and grows again in the subsequent base-flow deceleration phase. Thus, the ballistic regime follows part of a linear dynamics with high intracyclic modulation amplitude, while nonlinear saturation caps its growth and limits the perturbation level in the high-amplitude phase. These linear and nonlinear mechanisms adjust so that the nonlinear bursts are identically regenerated, resulting in a regime with no net growth or decay over one pulsation cycle. For larger base-flow pulsation amplitudes, these nonlinear bursts prevailing in the ballistic regime display some fluctuations from cycle to cycle, which is the sign of secondary instabilities, beyond the scope of the present investigation.
Computation of spatio-temporal wall shear stress patterns has revealed that both cruising and ballistic regimes are associated with intense spatially localized WSS values, much stronger than the spatially averaged values as well as the base-flow values.
Working out the nonlinear dynamics for the entire parameter space in the range
 $5\leqslant Wo\leqslant 25$
, shows that a cruising regime prevails at low base-flow modulation amplitudes
 $\tilde{Q}$
, and that transition to a ballistic regime occurs between
 $\tilde{Q}=0.1$
and 0.2, unless the ballistic regime is bypassed because the neutral boundary is crossed while still in the cruising regime.
The present investigation uses a single spatial Fourier series (4.20), (4.21) to compute the saturated wavetrains. This approach yields nonlinear solutions of the Navier–Stokes equations and prevents the development of secondary instabilities that would break the imposed spatial periodicity. Secondary instabilities may play an important part in the fully developed dynamics, and in particular near the transition between cruising and ballistic regimes. Secondary stability properties could be investigated by implementing a technique similar to that used for the rotating-disk flow (Pier Reference Pier2007), and the resulting dynamics could be computed by simulations allowing for more degrees of freedom, e.g. using a double Fourier expansion in both wall-parallel directions for the flow fields.
The nonlinear travelling waves found in the present investigation display a structure that is reminiscent of solutions to the Korteweg–de Vries equation. Therefore one might expect that an approach similar to that implemented by Tutty & Pedley (Reference Tutty and Pedley1994) could account for the dynamics, and possibly explain the ballistic regime in terms of cnoidal waves. Another line of thought would be to analyse the pulsating channel flow in terms of a Mathieu equation (McLachlan Reference McLachlan1964), also known to give rise to similar solutions as the amplitude of the oscillatory term becomes larger.
Having established the existence of nonlinear modulated travelling wave solutions for linearly unstable pulsating channel flows, it would now be worth to investigate the existence of subcritical solutions, i.e. finite-amplitude solutions that prevail in linearly stable base flows. Such subcritical solutions are known to exist for steady Poiseuille flow (Ehrenstein & Koch Reference Ehrenstein and Koch1991) and are therefore also expected in its pulsating counterpart. These subcritical solutions may be sought by continuously varying control parameters in a DNS or by generalizing the continuation technique of Ehrenstein & Koch (Reference Ehrenstein and Koch1991) to take into account the modulation of these solutions. The findings of the present paper suggest that the cruising regime probably displays such a subcritical behaviour, while it is less likely for the ballistic regime. And indeed, since the ballistic regime continuously regenerates nonlinear pulses on its own, it presumably does not depend on a finite-amplitude perturbation to be selected.
In the context of small-amplitude fluctuations, a question that has not yet been addressed is the nature of pulsating channel-flow instability, i.e. convective or absolute (Huerre & Monkewitz Reference Huerre and Monkewitz1990). For purely oscillating boundary layers, as investigated by Blennerhassett & Bassom (Reference Blennerhassett and Bassom2002, Reference Blennerhassett and Bassom2006) and Thomas et al. (Reference Thomas, Davies, Bassom and Blennerhassett2014), the onset of instability is expected to coincide with absolute instability, while steady plane Poiseuille flow is at most convectively unstable. Therefore, transition between convective and absolute instability is likely to occur when the pulsating base-flow component is increased or equivalently the steady component reduced; this could be investigated using the theory discussed by Brevdo & Bridges (Reference Brevdo and Bridges1997).
The observation of linear modes exhibiting strong intracyclic growth phases, raises the question of the possibility for even larger transient growth resulting from an optimal initial condition. Current investigations address the computation of transient energy amplifications using non-modal stability theory (see Schmid Reference Schmid2007) applied to time-periodic flows.
In a physiological context, the blood flow rates resulting from the cardiac pulse cannot be described by a single oscillating harmonic component but require a Fourier expansion of the form (3.3) with more modes. All the mathematical methods and numerical tools developed in the present investigation can handle flow rates with an arbitrary number of base-flow Fourier components. Current collaboration with Service de chirurgie vasculaire (Hôpital Édouard–Herriot, Lyon) and Service de Radiologie (Hôpital de la Croix-Rousse, Lyon) aims at obtaining relevant flow-rate waveforms for studying their fluid dynamical properties.
For bioengineering applications as well as for fundamental reasons, the present approach needs to be generalized from plane channel to circular pipe configurations. This work is in progress and requires minor adjustments to take into account the extra terms due to a formulation in cylindrical coordinates. However, the main difficulty arises from the fact that Hagen–Poiseuille flow through a circular pipe is linearly stable at all Reynolds numbers, therefore an approach based on temporally modulating the steady base flow is inappropriate for comprehending a regime of nonlinear waves travelling through a circular pipe. Thomas et al. (Reference Thomas, Bassom, Blennerhassett and Davies2011) have found neutrally stable conditions for pulsating pipe flow that could be used as starting points for nonlinear simulations; these conditions, however, correspond to essentially oscillating flow with a weak steady component, thus complicating their continuation toward physiological conditions. Furthermore, pulsatile flow through curved pipes (Siggers & Waters Reference Siggers and Waters2008) probably sustains even more complex dynamics.
Acknowledgements
This work was partially supported by a grant ‘PEPS Écoulements biologiques’, Institut des sciences de l’ingénierie et des systèmes (INSIS-CNRS). Part of this work was carried out while B.P. was enjoying a French Government fellowship at Churchill College, Cambridge University. Institut national de physique nucléaire et de physique des particules (IN2P3-CNRS) is gratefully acknowledged for very generously providing computing resources. Without access to its Centre de calcul allowing to continuously run hundreds of independent single-processor jobs it would not have been possible to carry out the present research requiring the systematic investigation of a multi-dimensional parameter space in great detail and at multiple resolutions.
Appendix A. Numerical solution methods and validation
Following the mathematical formulation of § 4, the governing equations yield systems of coupled partial differential equations of first order in time with spatial derivatives only in the wall-normal coordinate
 $x_{0}$
. The numerical implementation of these one-dimensional multi-component problems is based on the home-spun PackstaB library in C++; it involves a Chebyshev collocation technique for spatial discretization and a predictor–corrector fractional-step method for temporal integration. The essential features used in the present investigation are presented below, more details of the general method may be found in (Pier Reference Pier2015, § A.6).
A.1 Spatial discretization
The differential problems in the wall-normal coordinate
 $x_{0}$
are solved via a Chebyshev collocation method (Boyd Reference Boyd2001) where the collocation points
 $\unicode[STIX]{x1D709}_{i}\equiv -h\cos (i\unicode[STIX]{x03C0}/(N_{0}-1))$
for
 $0\leqslant i<N_{0}$
span the diameter of the channel.
No-slip boundary conditions apply to the velocity components while there are no boundary conditions for the pressure. Thus the velocity components are discretized using all
 $N_{0}$
collocation points including boundary points, while the pressure components may be discretized using only the
 $N_{0}-2$
interior points. This amounts to approximating velocity components by polynomials of order
 $N_{0}-1$
and pressure components by polynomials of order
 $N_{0}-3$
. In this collocation technique, approximations of the
 $x_{0}$
-derivatives are then computed by using
 $N_{0}\times N_{0}$
or
 $(N_{0}-2)\times (N_{0}-2)$
matrices, respectively.
Taking into account symmetry/antisymmetry of the different flow fields and using the associated discretized differential operators in the
 $x_{0}$
-coordinate, computations may be restricted to half the channel width and the numerical effort reduced by using only the
 $N_{0}^{\star }$
collocation points from the centreline to the boundary instead of the complete set of
 $N_{0}=2N_{0}^{\star }-1$
points covering the entire channel diameter.
A.2 Eigenvalue problems
The Floquet analysis discussed in § 4.2 yields an infinite system of linear coupled ordinary differential equations involving the Fourier components of the velocity and pressure eigenfunctions (4.14)–(4.17).
Truncating the Fourier expansions of the eigenfunctions (4.13) at
 $|n|\leqslant N_{f}$
then yields an algebraic generalized eigenvalue problem of size
 $(4N_{0}-2)(2N_{f}+1)$
, since there are
 $N_{0}$
values for each of the three velocity components and
 $N_{0}-2$
values for the pressure components. This generalized eigenvalue problem may be reduced to a regular eigenvalue problem of size
 $2(N_{0}-2)(2N_{f}+1)$
by eliminating the pressure (taking the divergence of the momentum equations) and one of the velocity components (using the continuity equation) as well as the (homogeneous) velocity boundary conditions. This may be further reduced to
 $2(N_{0}^{\star }-1)(2N_{f}+1)$
, with
 $N_{0}=2N_{0}^{\star }-1$
, by separately solving for sinuous or varicose modes.
Note that for all configurations considered in this study, it has been found that the most unstable or least stable perturbation is a sinuous mode, a confirmation of what was already observed by von Kerczek (Reference von Kerczek1982).
A.3 Temporal evolution problems
In a linear analysis, the equations (4.7)–(4.10) involve three scalar velocity components and one pressure field. In a nonlinear analysis, after truncating the Fourier expansions (4.20), (4.21) at
 $|n|\leqslant N_{h}$
, the equations (4.22)–(4.25) involve
 $3(2N_{h}+1)$
velocity components and
 $2N_{h}+1$
pressure components; note that the condition of real fields implies that
 $2N_{h}+1$
complex components are completely described by
 $2N_{h}+1$
independent real components. Time marching of these incompressible Navier–Stokes equations is carried out by a second-order accurate predictor–corrector fractional-step method, derived from the implementations of Goda (Reference Goda1979) and Raspo et al. (Reference Raspo, Hugues, Serre, Randriamampianina and Bontoux2002), where the velocity components are obtained at the intermediate time step by solving Helmholtz-type problems, and Poisson-type problems yield the pressure predictions and corrections required to enforce divergence-free velocity fields. Complete details of the numerical method are given in Pier (Reference Pier2015, § A.6.3).
For each simulation, the numerical values of the Floquet multiplier
 $\unicode[STIX]{x1D707}$
and of the associated frequency
 $\unicode[STIX]{x1D714}$
are derived by computing the ratios
 $u_{i}(x_{0,j},t+T)/u_{i}(x_{0,j},t)$
, where
 $i=0$
,
 $1$
or
 $2$
and
 $x_{0,j}$
is any of the collocation points. It is then checked that all these ratios converge to the same constant value and do not depend on the phase with respect to the base-flow pulsation, with at least five significant digits. Since the precision of these ratios is degraded when both the numerator and the denominator approach very small values, a threshold has been set on the magnitude of the denominator (typically
 $10^{-5}$
) below which the ratio is not computed. The same strategy has been adopted to produce table 1, but using longer time series than for the rest of the paper in order to obtain the required highly converged numbers.
As mentioned in § 4.3, an external volume force
 $\boldsymbol{f}=-g_{1}(t)\boldsymbol{e}_{1}\,-g_{2}(t)\boldsymbol{e}_{2}$
is used in the nonlinear governing equations in order to simulate evolution problems at the prescribed instantaneous total flow rate of the base flow. The purpose of this time-dependent spatially homogeneous body force, or pressure gradient, in the wall-parallel directions is to ensure that the spatially invariant flow corrections
 $\boldsymbol{u}^{(0)}(x_{0},t)$
due to nonlinearities develop without modifying the base flow rate. In the numerical implementation, the streamwise and spanwise flow-rate corrections
 $q_{1}(t)$
and
 $q_{2}(t)$
, defined in (4.27), (4.28), are driven to vanishing values by applying pressure gradient values governed by
 $$\begin{eqnarray}\displaystyle \unicode[STIX]{x2202}_{t}g_{1}=q_{1}\left(\frac{G^{(0)}}{\unicode[STIX]{x1D70F}Q^{(0)}}\right)\quad \text{and}\quad \unicode[STIX]{x2202}_{t}g_{2}=q_{2}\left(\frac{G^{(0)}}{\unicode[STIX]{x1D70F}Q^{(0)}}\right). & & \displaystyle\end{eqnarray}$$
Using sufficiently small values of the relaxation time
 $\unicode[STIX]{x1D70F}$
and solving (A 1) while time marching (4.22)–(4.25) guarantees that the pressure gradients
 $g_{1}(t)$
and
 $g_{2}(t)$
constantly adjust so as to suppress any departure from the base flow rate.
A.4 Validation
The accuracy of our numerical schemes has been assessed by comparison with known results and by extensive resolution tests.
For steady Poiseuille configurations, the eigenvalues given by Schmid & Henningson (Reference Schmid and Henningson2001, p. 504) have been reproduced to 8 significant digits both by solving the corresponding eigenvalue problem and by linearized direct numerical simulations (DNS); note that in these tables (Schmid & Henningson Reference Schmid and Henningson2001, p. 504) the third column corresponds to
 $\unicode[STIX]{x1D6FC}=0.25$
and
 $\unicode[STIX]{x1D6FD}=2$
instead of the mistakenly given
 $\unicode[STIX]{x1D6FD}=3$
. The nonlinear time-marching procedure has been checked by reproducing the Tollmien–Schlichting waves obtained by Ehrenstein & Koch (Reference Ehrenstein and Koch1991).
For pulsating base flows, we have reproduced the growth rates shown in figure 1 of von Kerczek (Reference von Kerczek1982) by computing data similar to those shown in our figure 5(b). By modifying our codes to take into account oscillating boundaries, we have also reproduced the data given in table 1 of Blennerhassett & Bassom (Reference Blennerhassett and Bassom2006), albeit not to 6 significant digits for all of them, and those more recently presented in figure 2b of Thomas et al. (Reference Thomas, Bassom, Blennerhassett and Davies2011).
The validation of our numerical methods is further based on thorough resolution-independence studies and, for the linear results, on the consistency between Floquet analysis and linearized DNS.
Complex frequency
 $\unicode[STIX]{x1D714}$
of most unstable linear perturbation at
 $Re=10\,000$
,
 $Wo=10$
,
 $\tilde{Q}=0.1$
and
 $\unicode[STIX]{x1D6FC}_{1}=2$
. Values computed by solving Floquet eigenproblem (truncated at
 $N_{f}$
Fourier components) and linearized DNS (with
 $N_{t}$
time steps per pulsation period) for different spatial resolutions.

Table 1 gives values of the complex frequency
 $\unicode[STIX]{x1D714}$
for the most unstable linear perturbation at
 $Re=10\,000$
,
 $Wo=10$
,
 $\tilde{Q}=0.1$
and
 $\unicode[STIX]{x1D6FC}_{1}=2$
. For a range of spatial discretizations
 $N_{0}^{\star }=16$
,
 $24$
,
 $32$
and
 $40$
, the value of
 $\unicode[STIX]{x1D714}$
is computed by solving Floquet eigenproblems using an increasing number
 $N_{f}$
of Fourier modes for the eigenfunctions and by linearized DNS using an increasing number
 $N_{t}$
of time steps per base-flow pulsation period. With both methods, it is found that eight significant digits are achieved for
 $N_{0}^{\star }\geqslant 32$
. In this example, the eigenproblem is already very accurately resolved with
 $N_{f}\geqslant 12$
, and the temporal simulations reach the same precision with
 $N_{t}\geqslant 5\times 10^{5}$
. Note that these correspond to approximately
 $N_{t}/20$
time steps per perturbation period since
 $\unicode[STIX]{x1D714}_{r}/\unicode[STIX]{x1D6FA}\simeq 20$
with
 $\unicode[STIX]{x1D6FA}=4Wo^{2}/Re=0.04$
. Figure 25(a) plots the error of the values computed by DNS with respect to the converged Floquet results and demonstrates the second-order convergence of the temporal integration scheme; for
 $N_{0}^{\star }\geqslant 32$
, curves are indistinguishable in this log–log plot. In practice, linearized simulations with
 $N_{t}=10^{4}$
and
 $N_{0}^{\star }=32$
yield results of sufficient accuracy over the entire parameter space considered here. In contrast, the number
 $N_{f}$
of Fourier modes required for convergence depends on
 $Wo$
and increases significantly with
 $\tilde{Q}$
as discussed in § 5.2.
(a) Error in
 $\unicode[STIX]{x1D714}$
computed by linearized DNS with increasing number
 $N_{t}$
of time steps per pulsation period and
 $N_{0}^{\star }=16$
,
 $24$
,
 $32$
,
 $40$
,
 $48$
. (b) Error in perturbation energy computed by nonlinear DNS with increasing
 $N_{t}$
and
 $N_{h}=2$
(blue),
 $3,4,\ldots ,10$
(red) at
 $N_{0}^{\star }=56$
.

Energy of fully developed nonlinear fluctuation at
 $Re=10\,000$
,
 $Wo=10$
,
 $\tilde{Q}=0.2$
and
 $\unicode[STIX]{x1D6FC}_{1}=2$
. Values computed by DNS with
 $N_{t}$
time steps per pulsation period, spatial Fourier expansions truncated at
 $|n|\leqslant N_{h}$
and using a range of resolutions in
 $x_{0}$
coordinate.

Table 2 gives values of the average perturbation energy in the fully developed regime at
 $Re=10\,000$
,
 $Wo=10$
,
 $\tilde{Q}=0.2$
and
 $\unicode[STIX]{x1D6FC}_{1}=2$
, obtained by DNS with up to
 $N_{t}=10^{6}$
time steps per pulsation period and different settings of
 $N_{h}$
and
 $N_{0}^{\star }$
. This configuration is discussed in detail in § 6.1.2. For nonlinear temporal evolution problems, the resolution requirements to achieve a precision of 8 significant digits are more difficult to meet since increasing the number
 $N_{h}$
of spatial Fourier modes also requires larger values of
 $N_{0}^{\star }$
to fully resolve these higher modes. Nonetheless, figure 25(b), which plots the error with respect to the value computed at highest resolution, shows that second-order convergence is still achieved for the nonlinear simulations. For the parameter ranges considered in this paper, it has been found that nonlinear simulations with
 $N_{t}=10^{5}$
,
 $N_{h}=7$
and
 $N_{0}^{\star }=48$
are generally more than enough to obtain reliable results and plots that do not change at higher resolutions.