I. INTRODUCTION
Direct methanol fuel cells (DMFCs) have received considerable attention in the past decades owing to their viable use in powering transportation vehicles and portable electronic devices.Reference Zhang and Shen1–Reference Zainoodin, Kamarudin and Daud4 Compared with fuel cells based on hydrogen, DMFCs offer a higher energy density, together with easier storage and transport of the fuel (i.e., methanol). One of the key reactions involved in the operation of DMFCs is the methanol oxidation reaction (MOR), which is typically catalyzed by Pt nanopartciles.Reference Chen, Lim, Lee and Xia5–Reference Zhao, Yin, Ma, Liang, Liu, Liao, Lu and Xing7 However, due to the extremely low abundance in the earth crust and the ever-growing demand from different sectors, there is an urgent need to develop more active catalysts for cost-effective and sustainable use of a precious metal such as Pt.
Extensive effort has been devoted to the development of new strategies for minimizing the loading of Pt in a catalyst by improving the activity and durability. The strategies include (i) controlling the shape and thus surface structure to maximize the specific activityReference Peng and Yang8–Reference Kang, Yang, Markovic and Stamenkovic14 and (ii) incorporating a second metal to tailor the electronic structure and further enhance the specific activity.Reference Antolini, Lopes and Gonzalez15–Reference Alam, Saito and Takaba21 To these ends, Aldaz and coworkersReference Solla-Gullón, Vidal-Iglesias, López-Cudero, Garnier, Feliu and Aldaz22 investigated the catalytic activities of Pt nanocrystals enclosed by {100} and {111} facets toward MOR and found that the Pt(111) surface exhibited a peak current density 2.1 times greater than that of the Pt(100) surface. Additionally, Liu and coworkersReference Liu, Yu, Chen, Lo, Hwang, Chien and Liu23 successfully prepared Pt–Ru nanocrystals with controllable compositions and demonstrated that the presence of Ru led to the formation of a Pt–Ru surface not only favorable for methanol oxidation but also tolerant to CO poisoning, giving greatly enhanced activity and durability when compared with the commercial Pt/C catalyst. Sun and coworkersReference Xu, Zhang, Sun, Yang, Dai, Gao, Li, Zhang, Wang, Yu and Sun24 reported the synthesis of Pt–Ni alloy hexoctahedral nanocrystals covered by well-defined {321} facets, showing a 4.0-fold enhancement in terms of specific activity and an improved durability toward MOR, when benchmarked against the commercial Pt/C. These prior studies clearly demonstrate the importance to combine facet-controlled synthesis with alloying to optimize both the activity and durability of a Pt-based catalyst toward MOR.
Herein, we report an approach to the facile synthesis of Pt–Ag nanocrystals with octahedral and tetrahedral shapes, as well as concaved facets. The presence of a Ag(I) precursor was found to play important roles in reducing a Pt(IV) precursor and in defining the surface structure of the Pt–Ag nanocrystals. Additionally, the reducing power of poly(vinylpyrrolidone) (PVP) could be manipulated by varying the molecular weight, giving rise to the formation of Pt–Ag octahedral and tetrahedral nanocrystals with tunable sizes. When tested as catalysts toward MOR, the Pt–Ag alloy nanocrystals exhibited greatly enhanced activity and durability relative to the commercial Pt/C catalyst.
II. EXPERIMENTAL SECTION
A. Chemicals
Sodium hexachloroplatinate (Na2PtCl6·6H2O, 98%), silver trifluoroacetate (CF3COOAg, 99.99%), PVP (MW ≈ 10, 29, 40, 55, and 1300 k), perchloric acid (HClO4, 70%, PPT Grade, Veritas, Ohio), and N,N-dimethylformamide (DMF) were all obtained from Sigma-Aldrich and used without further purification. Methanol (CH3OH, ≥99.8%) and sulfuric acid (H2SO4, ≥95%) were obtained from Alfa and used as received. All aqueous solutions were prepared using deionized (DI) water with a resistivity of 18.2 MΩ cm at room temperature.
B. Synthesis of Pt–Ag alloy nanocrystals
In a standard synthesis, 10 mg of Na2PtCl6·6H2O, 10 mg of CF3COOAg, and 50 mg of PVP (MW ≈ 29 k) were dissolved in 10 mL of DMF and then transferred into a 20-mL vial. After the vial had been tightly capped, the mixture was heated to 160 °C in an oil bath under magnetic stirring for 2 h. The solid product was collected by centrifugation, washed once with acetone (acetone/DMF = 3/1, v/v), and three times with a mixture of acetone and ethanol (acetone/ethanol = 3/1, v/v).
C. Electrochemical measurements
The electrochemical measurements were conducted in a three-electrode cell using an electrochemical workstation (CHI 600E potentiostat, CH Instruments, Bee Cave, Texas). A reversible hydrogen electrode and Pt mesh were used as the reference and counter electrodes, respectively. The Pt–Ag alloy nanocrystals were loaded on carbon (Ketjenblack EC-300J, AkzoNobel, Amsterdam, the Netherlands), with a weight percentage of approximately 20 wt%, to serve as the working electrode. The cyclic voltammograms (CVs) were recorded in a N2-saturated 0.1 M HClO4 solution in the potential range of 0.08–1.1 V and at a scanning rate of 50 mV/s. The linear sweep voltammograms were tested in a mixture of 1.0 M CH3OH and 0.5 M H2SO4 in the potential range of 0.2–1.2 V and at a scanning rate of 50 mV/s. All electrochemical measurements were carried out at room temperature.
D. Characterization
The transmission electron microscopy (TEM) analysis was conducted on an HT7700 microscope (Hitachi, Tokyo, Japan) operated at 120 kV. High-resolution transmission electron microscopy images, high-angle annular dark- and bright-field scanning transmission electron microscopy (HAADF- and HAABF-STEM, respectively) images, and energy-dispersive X-ray spectroscopy (EDX) data were acquired using a Cs-corrected FEI Titan (Hillsboro, Oregon) TEM/STEM microscope at Oak Ridge National Laboratory (ORNL). X-ray diffraction (XRD) patterns were obtained with a PANalytical X’Pert PRO Alpha-1 diffractometer (Almelo, the Netherlands) using 1.8 kW Ceramic Copper tube source. The inductively coupled plasma mass spectrometry (ICP-MS) analysis was conducted with NexION 300Q (PerkinElmer, Waltham, Massachusetts) to determine the metal contents in a sample.
III. RESULTS AND DISCUSSION
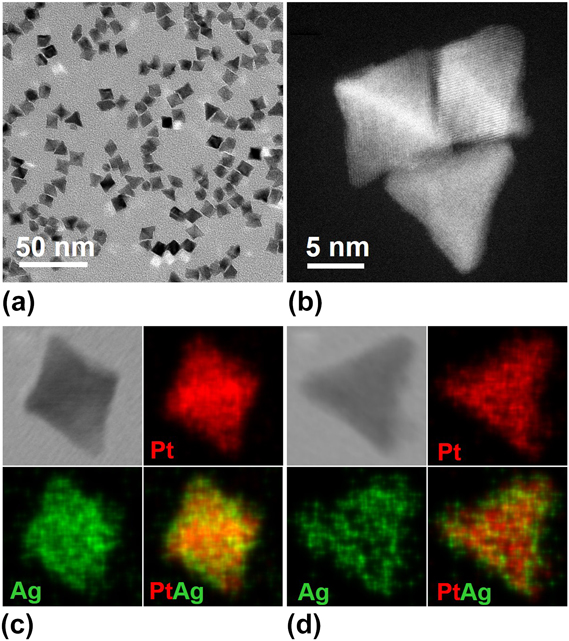
In a typical synthesis, Na2PtCl6, CF3COOAg, and PVP were dissolved in DMF and then heated to 160 °C for 2 h in a tightly capped vial. Figure 1(a) shows a TEM image of the Pt–Ag nanocrystals (roughly 75% octahedra and 20% tetrahedra) characterized by slightly concaved surfaces. Figure 1(b) shows a HAADF–STEM image of three Pt–Ag nanocrystals, from which the octahedral and tetrahedral shapes could be clearly resolved. The average sizes of the octahedra and tetrahedra were 9 and 14 nm, respectively, in terms of edge length. We also conducted EDX mapping to resolve the elemental distributions of Pt and Ag in the nanocrystals, as illustrated in Figs. 1(c) and 1(d). Both Pt and Ag were uniformly distributed in the Pt–Ag nanocrystals, indicating the formation of an alloy structure. According to the ICP-MS result shown in Table SI, the weight percentage of Pt was 72.2 wt% while that of Ag was 27.8 wt% in the Pt–Ag alloy nanocrystals, corresponding to an atomic ratio of 3:2 between Pt and Ag.
(a) TEM image of the Pt–Ag alloy nanocrystals prepared using the standard protocol. (b) HAADF-STEM image of three Pt–Ag nanocrystals. (c and d) HAABF–STEM images and EDX mapping (Pt/red, Ag/green) of two Pt–Ag nanocrystals in the shapes of (c) octahedron and (d) tetrahedron, respectively.

To elucidate the formation mechanism of the Pt–Ag alloy nanocrystals, we conducted TEM analysis on the intermediate products collected at different reaction stages of a standard synthesis, as illustrated in Fig. 2. At the initial stage [t = 10 min, Fig. 2(a)], the product was mainly composed of 3-nm nanocrystals with poorly defined shapes, together with a small portion of octahedra and tetrahedra. When the reaction was continued for 30 min [Fig. 2(b)], the proportions of octahedral and tetrahedral nanocrystals in the product were increased, and the particle size was also enlarged. As the reaction was extended to 60 min and further to 90 min [Figs. 2(c) and 2(d), respectively], the products were dominated by octahedral and tetrahedral nanocrystals. The formation of Pt–Ag octahedral and tetrahedral nanocrystals could be attributed to the presence of the Ag(I) precursor.Reference Sun and Xia25 As argued by Strüber and coworkers,Reference Fu, Ma, Gao, Chen, Tang, Lu and Lee26,Reference Song, Kim, Connor, Somorjai and Yang27 the desorption energy of Ag atoms on the Pt(100) surface is greater than that on the Pt(111) surface, favoring the deposition of Pt along the 〈100〉 direction through the oxidation of the adsorbed Ag atoms and thus the formation of octahedral and tetrahedral nanocrystals.Reference Fu, Ma, Gao, Chen, Tang, Lu and Lee26,Reference Song, Kim, Connor, Somorjai and Yang27 Additionally, the corners and edges of the nanocrystals also showed higher growth rates than that of the side faces, leading to the formation of concave facets on the as-obtained Pt–Ag nanocrystals.Reference Herricks, Chen and Xia28
TEM images of the Pt–Ag alloy nanocrystals collected at different stages of a synthesis based on the standard protocol: (a) 10, (b) 30, (c) 60, and (d) 90 min.

To better understand the formation of Pt–Ag octahedral and tetrahedral nanocrystals, we also conducted a set of control experiments. We first investigated the role of Pt(IV) and Ag(I) precursors by conducting the synthesis in the absence of Pt(IV) or Ag(I) precursor. As shown in Fig. S1, when the Pt(IV) precursor was missing, we obtained Ag nanocrystals as a mix of cubes, rods, and bipyramids; all of them were enclosed by {100} facets owing to the strong binding of PVP toward the Ag(100) surface.Reference Sun and Xia25 When the synthesis was conducted in the absence of the Ag(I) precursor, no solid product was obtained, indicating that the presence of Ag(I) and thus the formation of Ag clusters or seeds could facilitate the reduction of the Pt(IV) precursor.Reference Fu, Ma, Gao, Chen, Tang, Lu and Lee26,Reference Song, Kim, Connor, Somorjai and Yang27
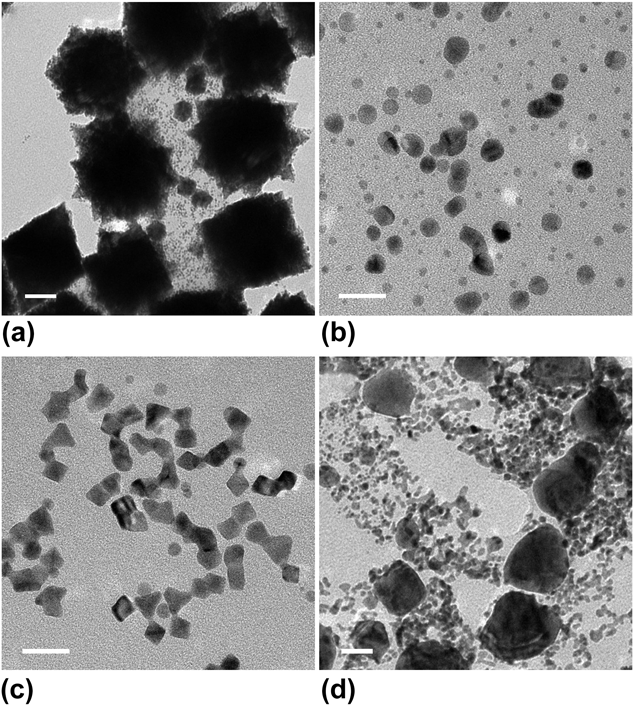
We then varied the amount of the Ag(I) precursor to examine its role in the formation of Pt–Ag nanocrystals. When the amount of the Ag(I) precursor was reduced to 5 mg, the majority of the obtained Pt–Ag nanocrystals had a branched morphology, with an overall size of about 50 nm [Fig. 3(a)]. If the amount of the Ag(I) precursor was increased to 7.5 mg, most of the nanocrystals took a spheroidal shape, together with sizes ranging from 1 to 8 nm [Fig. 3(b)]. By contrast, when the amount of the Ag(I) precursor was increased to 12.5 mg, the product became a mix of octahedral, tetrahedral, and spheroidal nanocrystals [Fig. 3(c)]. However, the octahedral and tetrahedral shapes were poorly defined. As we further increased the amount of the Ag(I) precursor to 15 mg, the product mainly consisted of irregular nanocrystals with a broad size distribution [Fig. 3(d)]. The formation of various types of Pt–Ag nanocrystals could be attributed to the difference in the nucleation process under diverse feeding ratios of the Ag(I) to Pt(IV) precursors. However, the nucleation process involved in this synthesis is too complicated to be resolved. It might involve multiple reactions and/or events, including the formation of Ag seeds followed by the co-deposition of Pt and Ag atoms through heterogeneous nucleation, the galvanic replacement between elemental Ag and the Pt(IV) precursor, and the formation of AgCl (Ag+ from CF3COOAg and Cl− from Na2PtCl6), among others. Altogether, the feeding ratio between the Ag(I) and Pt(IV) precursors was pivotal to the formation of Pt–Ag alloy nanocrystals with a narrow size distribution and well-defined shapes.
TEM images of the nanoparticles obtained using the standard protocol except for the introduction of different amounts of CF3COOAg: (a) 5, (b) 7.5, (c) 12.5, and (d) 15 mg. (Scale bars: 10 nm).

The reaction temperature was also critical to the formation of Pt–Ag alloy nanocrystals, which can significantly affect not only the reducing power of the reductant but also the surface diffusion kinetics of atoms. Figure S2(a) shows a TEM image of the Pt–Ag nanocrystals prepared using the standard protocol except for the use of reaction temperature at 150 °C. The obtained nanocrystals showed a relatively larger size compared to that of the standard sample, indicating the generation of fewer nuclei due to the lower temperature. When the synthesis was carried out at 170 °C, the octahedral and tetrahedral nanocrystals were observed as the predominant product, but with a smaller size than that of the product obtained using the standard protocol [Fig. S2(b)]. This can be attributed to the fact that the reduction of both the Ag(I) and Pt(IV) precursors was accelerated at an elevated reaction temperature, leading to the generation of more nuclei during the nucleation process and thus the formation of smaller Pt–Ag nanocrystals.
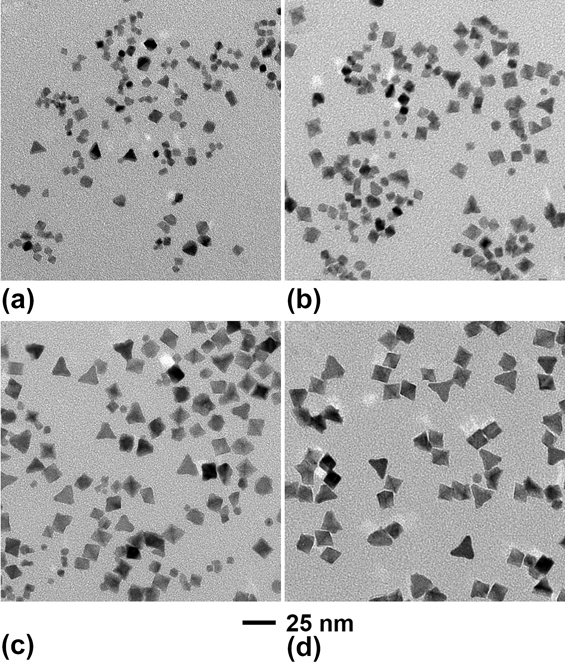
It has been reported that the hydroxyl group in PVP could serve as a mild reductant, offering a versatile route to the chemical synthesis of noble-metal nanocrystals.Reference Washio, Xiong, Yin and Xia29 Herein, we used PVP with different molecular weights to investigate its effect on the formation of Pt–Ag alloy nanocrystals. When PVP with a molecular weight of 10 k was used, the products contained irregular nanoparticles with sizes in the range of 1–6 nm, in addition to octahedral and tetrahedral nanocrystals [Fig. 4(a)]. If PVP with a molecular weight of 40 k was used, the as-synthesized Pt–Ag nanocrystals mainly took octahedral and tetrahedral shapes, with enlarged sizes of 12 and 18 nm, respectively [Fig. 4(b)]. As the molecular weight of PVP was increased to 55 k and 1300 k, the average sizes of the as-obtained Pt–Ag octahedral nanocrystals were increased to 18 and 25 nm, respectively, whereas those of the tetrahedral nanocrystals were increased to 23 and 32 nm [Figs. 4(c) and 4(d)]. The variation in particle size stemmed from the different reducing powers of PVP with different chain lengths. As a reduction process typically involves the electron transfer and collision between the precursor and the reductant, PVP with a shorter chain-length was able to interact with the metal precursor more effectively and thus promote the reduction of metal ions.Reference Xiong, Washio, Chen, Cai, Li and Xia30 When PVP with a molecular weight of 10 k was used in the synthesis, the reducing power was enhanced relative to the standard synthesis, giving rise to the formation of smaller Pt–Ag nanocrystals [Fig. 4(a)]. Conversely, when the synthesis was performed using PVP with higher molecular weights of 40 k, 55 k, and 1300 k. The decreased reducing power resulted in the generation of fewer nuclei during the nucleation step, and thereby the formation of Pt–Ag nanocrystals with increased sizes. Besides, we also conducted the standard synthesis in the absence of PVP and were able to obtain Pt–Ag particles, as illustrated in Fig. S3, demonstrating that DMF also served as a reductant in the present synthesis. However, the as-synthesized Pt–Ag particles showed severe aggregation, verifying the role of PVP in stabilizing the individual nanocrystals. Taken together, PVP could work as not only a colloidal stabilizer but also a co-reductant in the present synthesis. Using PVP with different molecular weights, we were able to obtain Pt–Ag octahedral and tetrahedral nanocrystals with sizes in the range of 9–25 and 14–32 nm, respectively.
TEM images of the Pt–Ag alloy nanocrystals prepared using the standard protocol except for the use of PVP with different molecular weights. (a) 10, (b) 40, (c) 55, and (d) 1300 k.

Figure 5 shows an XRD pattern of the Pt–Ag nanocrystals prepared using the standard protocol. The characteristic peaks of (111), (200), (220), and (311) indicate a face-centered cubic (fcc) structure for the Pt–Ag nanocrystals. According to the HAABF-STEM image of an individual Pt–Ag octahedron shown in the inset, the {111} lattice fringe spacing was measured to be 2.30 Å, which was larger than that of fcc Pt (2.26 Å, JCPDS No. 04-0802) but smaller than that of fcc Ag (2.36 Å, JCPDS No. 04-0783). Additionally, the diffraction peaks of the Pt–Ag nanocrystals were positioned between those of the pure Pt and Ag, further supporting the formation of an alloy structure.Reference Fu, Ma, Gao, Chen, Tang, Lu and Lee26 Based on Vegard’s law,Reference Denton and Ashcroft31 the atomic ratio of Pt to Ag in the alloy nanocrystals was derived as 59:41, in agreement with the ICP-MS data (3:2, see Table SI).
XRD pattern of the Pt–Ag alloy nanocrystals prepared using the standard protocol. The characteristic peaks of the pure Pt and Ag metals are marked by black and gray bars, respectively. Black bars: JCPDS No. 04-0802 (Pt). Gray bars: JCPDS No. 04-0783 (Ag). The inset shows a HAABF-STEM image of an individual Pt–Ag alloy octahedron.

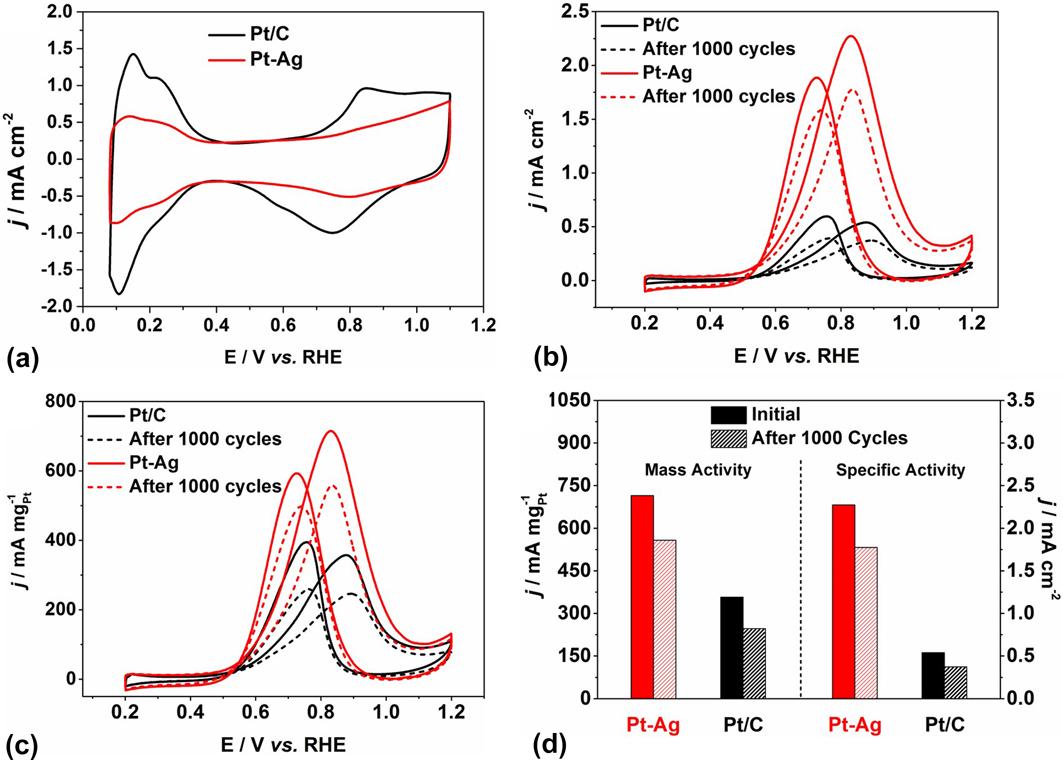
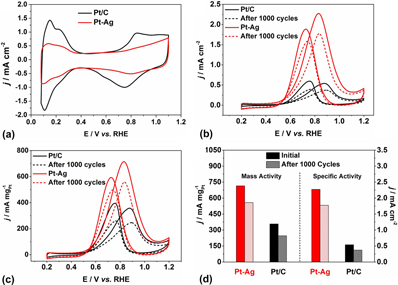
The catalytic activities of the Pt–Ag alloy nanocrystals were measured and compared with those of the commercial Pt/C toward MOR. The Pt–Ag nanocrystals were loaded on carbon for the subsequent electrochemical measurements, with a weight percentage of 20 wt% in terms of Pt. Figure S4 shows TEM images of the commercial Pt/C and the carbon-supported Pt–Ag alloy nanocrystals, both showing good dispersity. The CVs were measured in a N2-saturated 0.1 M HClO4 solution at a scan rate of 50 mV/s [Fig. 6(a)], from which the electrochemical active areas (ECSAs) were derived as 29.8 and 71.4 m2/gPt for the Pt–Ag nanocrystals and commercial Pt/C, respectively. The smaller ECSA of the Pt–Ag nanocrystals can be attributed to the relatively larger size and alloy surface composition. Figure 6(b) shows the ECSA-normalized current density (i.e., specific activity) of the Pt–Ag nanocrystals and commercial Pt/C, which was calculated to be 2.3 and 0.5 mA/cm2, respectively. Especially, the Pt–Ag nanocrystals exhibited a 4.6-fold enhancement in terms of specific activity than the commercial Pt/C. The mass-normalized current density (i.e., mass activity) of the Pt–Ag nanocrystals was 714.7 mA/mgPt, which was 2.0 times as high as that of the commercial Pt/C (357.2 mA/mgPt), as shown in Fig. 6(c).
Comparison of the catalytic properties of the Pt–Ag alloy nanocrystals and commercial Pt/C toward MOR. (a) CV curves of the Pt–Ag alloy nanocrystals and commercial Pt/C measured in a N2-saturated 0.1 M HClO4 solution at a scan rate of 50 mV/s (b) ECSA- and (c) mass-normalized CV curves for the Pt–Ag alloy nanocrystals and commercial Pt/C measured before and after 1000 CV cycles in a N2-saturated mixture containing 0.5 M H2SO4 and 1.0 M CH3OH, in the potential range of 0.2–1.2 V and at a scan rate of 20 mV/s. (d) Summary of the specific and mass activities of the Pt–Ag alloy nanocrystals and commercial Pt/C before and after 1000 CV cycles.

The durability of two types of catalysts was also investigated by electrochemically cycling for 1000 cycles in the potential range of 0.2–1.2 V, and the catalytic activities before and after the accelerated tests are summarized in Fig. 6(d). After the accelerated tests, the specific activity of the Pt–Ag nanocrystals was 1.8 mA/cm2, which was still 3.6 times greater than that of the original commercial Pt/C. The mass activities after 1000 cycles were measured to be 557.9 and 246.3 mA/mgPt for the Pt–Ag nanocrystals and the commercial Pt/C, respectively. Specifically, the Pt–Ag nanocrystals exhibited a 1.6-fold enhancement in terms of mass activity than that of the original commercial Pt/C. Additionally, the mass activity of the Pt–Ag nanocrystals indicated a decay of 21.9% while that of the commercial Pt/C dropped by 31.1% after the accelerated tests. Taken together, the Pt–Ag octahedral and tetrahedral nanocrystals exhibited enhanced activity and durability than the commercial Pt/C toward MOR.
The enhancement in activity and durability can be attributed to both the concaved facets and the alloy structure.Reference Yang, Roling, Vara, Elnabawy, Zhao, Hood, Bao, Mavrikakis and Xia32–Reference He, Wu, Liu, Zhang, Chu, Feng, Hu, Zhou and Xie36 The oxidation of methanol is well known to occur through two major pathwaysReference Batista, Malpass, Motheo and Iwasita33: direct and indirect. The direct pathway involves several dehydrogenation steps to form intermediate CO, which is then oxidized to CO2. The indirect pathway referred to the formation of soluble intermediates such as formaldehyde and formic acid, followed by further oxidation to generate CO2. The concaved facets on Pt-based nanocrystals have been demonstrated to facilitate both the direct and indirect pathways, in addition to improved tolerance toward CO adsorption.Reference Xu, Zhang, Sun, Yang, Dai, Gao, Li, Zhang, Wang, Yu and Sun24,Reference Housmans, Wonders and Koper34,Reference Herrero, Franaszczuk and Wieckowski35 Besides, the Ag atoms in the Pt–Ag nanocrystals are also beneficial to the modulation of the electronic structure, forming a surface favorable for methanol oxidation, further boosting the performance.Reference Pedersen, Escudero-Escribano, Velázquez-Palenzuela, Christensen, Chorkendorff and Stephens18,Reference He, Wu, Liu, Zhang, Chu, Feng, Hu, Zhou and Xie36
IV. CONCLUSIONS
In summary, we have demonstrated a protocol for the facile synthesis of Pt–Ag octahedral and tetrahedral nanocrystals with concaved facets. The average sizes of the Pt–Ag octahedral and tetrahedral nanocrystals were 9 and 14 nm, respectively, and the atomic ratio of Pt to Ag was 3:2. The presence of the Ag(I) precursor was demonstrated to facilitate the reduction of the Pt(IV) precursor and promote the formation of Pt–Ag nanocrystals with octahedral and tetrahedral shapes. Additionally, the feeding ratio between the Pt(IV) and Ag(I) precursors as well as the reaction temperature were critical to the formation of Pt–Ag alloy nanocrystals with a narrow size distribution. By varying the molecular weight, we were able to adjust the reducing power of PVP and thereby tune the size of Pt–Ag nanocrystals. When benchmarked against the commercial Pt/C, the Pt–Ag nanocrystals displayed enhanced activity and durability toward MOR. Taken together, this work offers a facile and versatile route to the synthesis of Pt–Ag alloy nanocrystals with enhanced performance toward MOR.
Supplementary Material
To view supplementary material for this article, please visit https://doi.org/10.1557/jmr.2018.346.
ACKNOWLEDGMENTS
This work was supported in part by a grant from the NSF (DMR 1506018), and start-up funds from the Georgia Institute of Technology. High-resolution imaging was performed at the Oak Ridge National Laboratory’s Center for Nanophase Materials Sciences, which is a U.S. DOE Office of Science User Facility (M.C.). Z.D.H. gratefully acknowledges support from the National Science Foundation Graduate Research Fellowship under Grant No. DGE-1650044 and the Georgia Tech-ORNL Fellowship.