


1. Introduction
Understanding spatial and temporal variability of Antarctic surface temperatures is fundamental to a wide variety of climatological and glaciological investigations. Satellite observations of thermal microwave emission now span more than two decades and are an important resource for determining the spatial patterns of Antarctic temperature variations through time (Reference Schneider and SteigSchneider and Steig, 2002; Reference Schneider, Steig and ComisoSchneider and others, 2004). Unlike thermal infrared observations (Reference ComisoComiso, 2000; Reference King and ComisoKing and Comiso, 2003), microwave brightness temperatures over ice sheets are largely unaffected by clouds. Their interpretation in terms of surface temperature depends, however, on snow scattering properties and on the depth profile (and thus history) of the surface temperature field.
The question thus arises how the relation between satellite observations of microwave brightness temperatures and actual surface temperatures varies in time and space. Of particular interest is whether interannual variations in this relation may affect inferred interannual variations in surface temperature, and thus result in a spurious appearance of Antarctic climate variability.
Here we report initial work to address this latter question, based on physical modeling of the relation between arbitrary surface temperature time series and the corresponding time series of brightness temperature. It is conventional to parameterize the relation between microwave brightness temperatures, T B(t), and surface temperatures, T s(t), with an ‘effective emissivity’, e eff(t) = T B(t)/T s(t). For a given microwave frequency, e eff depends both on snow properties and on the frequency of the surface temperature forcing (Reference SurdykSurdyk, 2002). For example, while Reference ZwallyZwally (1977) showed that e eff for the Antarctic ice sheet is roughly constant in the annual mean, Reference Shuman and StearnsShuman and Stearns (2001) find that e eff varies several per cent seasonally. It is therefore useful to replace the effective emissivity parameterization with a model that involves both thermal diffusivity and the microwave extinction length in the firn. We will show that these parameters do not separately influence the relation between time series; rather, that relation depends only on a single time-scale given by a ratio of the parameters. Moreover, the characteristic time-scale should be, to a good approximation, independent of the surface temperature forcing frequency.
We test the model using a 7 year surface temperature time series from the Byrd Station automated weather station (AWS) in West Antarctica and corresponding observations of brightness temperatures at 37 GHz, vertical polarization, from the Scanning Multichannel Microwave Radiometer (SMMR), and estimate the characteristic time-scale empirically. The inferred time-scale is in good agreement with an independent estimate derived from separate published estimates of thermal diffusivity and microwave extinction length. Initial results show no pronounced temporal change in the averaging time-scale for this dataset.
2. Theory
For this initial modeling, we idealize near-surface firn as a material in which temperature, T(z,t), as a function of depth z,0 ≤ z < ∞ and time t, – ∞ < t < ∞, is governed by diffusion with a depth-independent diffusivity, a 2m2 s–1 (Reference PatersonPaterson, 1994).

We consider the situation in which the firn is initially isothermal at all depths, and then surface temperature variations begin and force corresponding temperature variations at depth. More precisely, we specify T(z,t) = T m for all t ≤ 0 and for all z, and T(0,t) = T m + f (t) for t ≤ 0. This problem can be solved for T(z,t) in a standard way using Laplace transformation; details are given by Reference Carrier and PearsonCarrier and Pearson (1976) and Reference KevorkianKevorkian (1989). The result is:

where the convolution kernel is given by

We assume that microwave emission from near-surface firn can be modeled in terms of a radiative transfer equation (Reference ZwallyZwally, 1977). For this initial modeling, we furthermore assume that scattering in the firn is sufficiently weak that brightness temperature depends only on the absorption and scattering of emitted radiation out of the direction of observation; we neglect effects on emission of scattering of emitted radiation into the observation direction. Under this approximation, the brightness temperature, T B(z,t) in the look direction of the sensor (after accounting for refraction at the snow surface), as a function of depth and time, is governed by the equation:

where κ e is the total extinction coefficient of radiation in the firn due both to absorption and scattering, μ is the cosine of the angle from vertical of the (refracted) look direction to the sensor within the firn, and κ a is the extinction coefficient due solely to absorption (Reference ZwallyZwally, 1977; Reference Tsang, Kong and ShinTsang and others, 1985). Note that the extinction coefficients have units of length–1, and in fact κ – e 1 is simply the e-folding length for extinction due to both absorption and scattering; κ – a 1 is the corresponding length for absorption alone. It is straightforward to solve this differential equation for the brightness temperature just below the snow surface, T B(0+,t), using an integrating factor (Reference Boyce and DiPrimaBoyce and DiPrima, 1977), with the result:

Extension of this result to include effects of stronger scattering can be accomplished using a method similar to that of Reference ZwallyZwally (1977), but it proves valuable to see which of the key phenomena can be reproduced by this simplest model; we therefore defer consideration of stronger scattering effects to future work.
The brightness temperature just below the snow surface is related to the brightness temperature observed by a sensor above the surface by a polarization- and look-angle-dependent transmission coefficient,  Using Equation 1 for T(z,t), we obtain

Using Equation 1 for g(z,τ), interchanging orders of integration in the convolution term and performing the indicated integrations, we find

where the convolution kernel involves the complementary error function, erfc(z):

The first term on the right in Equation 1 is simply the brightness temperature prior to the onset of surface temperature variations, which we denote T
Bm. The second, convolutional term appears at first to depend in a complicated way on the microwave extinction coefficient and thermal diffusivity. The actual dependence is quite simple, however, as can be seen by rewriting Equations (7) and (8) in terms of a dimensionless integration variable 

Thus the response of brightness temperature to surface temperature depends not on the microwave extinction coefficient and thermal diffusivity separately, but rather only through the reciprocal of their product, which has the dimensions of time and constitutes a natural time-scale, τ 0, for the problem.
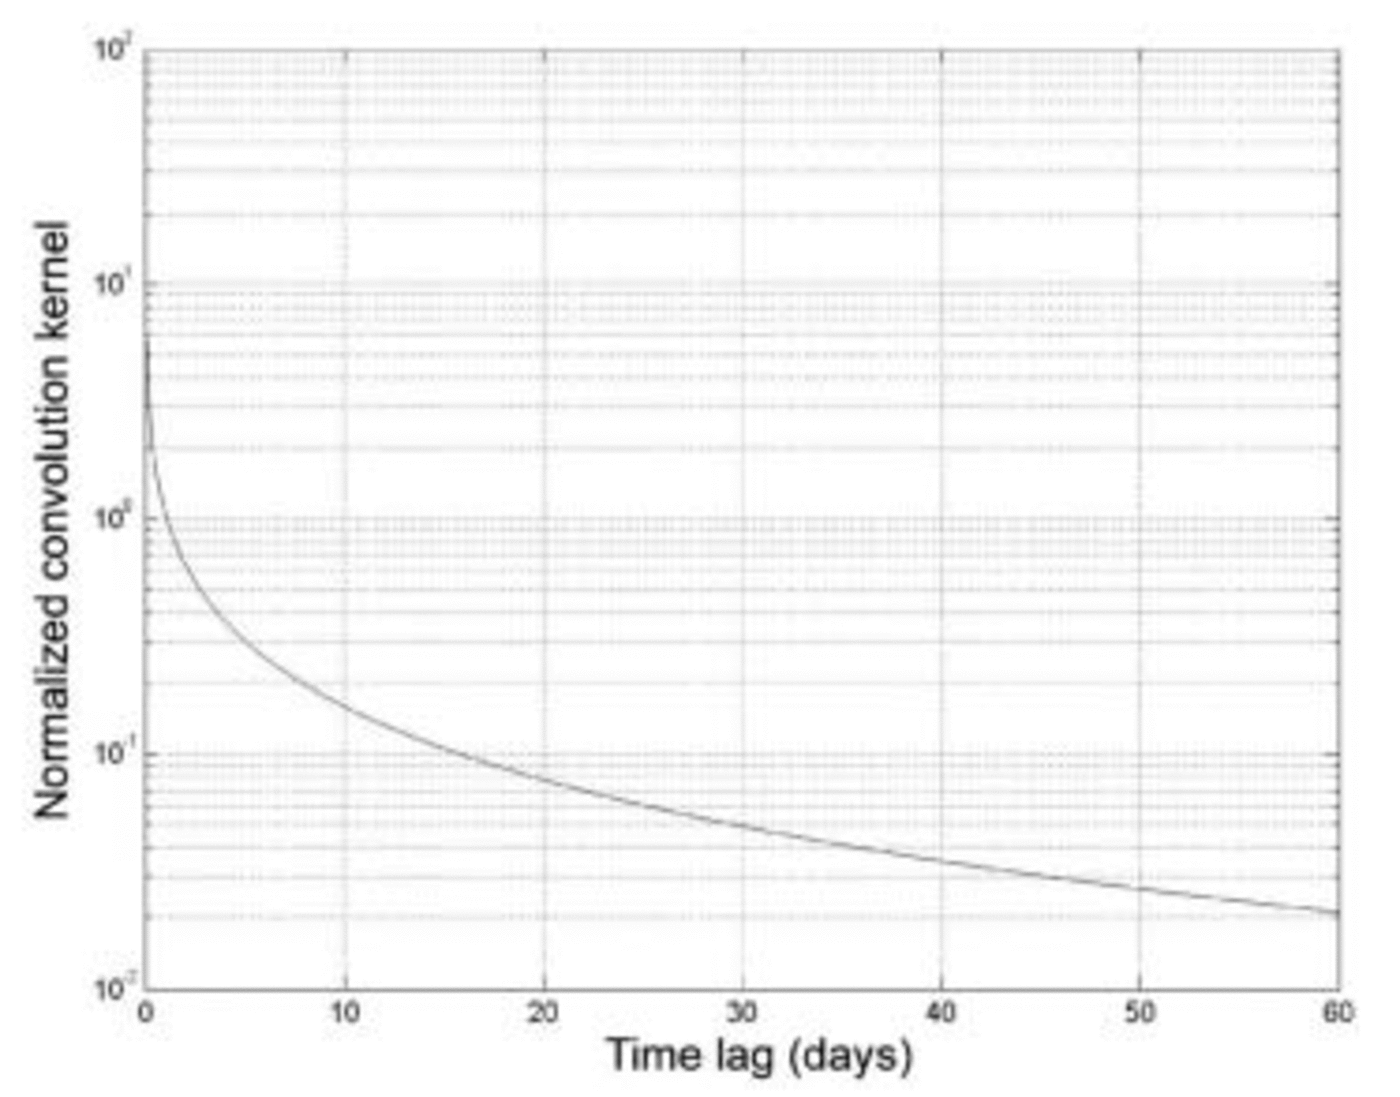
A review of published values by Reference SurdykSurdyk (2002), as well as computations following Reference PatersonPaterson (1994), suggest a reasonable value of a 2 = 7 × 10⁻⁷m2 s–1 for the thermal diffusivity of near-surface Antarctic firn. The computations of Surdyk suggest a reasonable value of μ/κ e of 1m for 37 GHz, vertically polarized emission. Together, these values imply a value for τ 0 of approximately 1.43 × 10⁶ s, or roughly 16.5 days. Figure 1 shows a semi-log plot of the convolution kernel using this value of τ 0, as a function of time lag in days. Note that the square-root singularity of the kernel at zero lag is integrable and so presents no analytical difficulty (though we will address the computational issue in the next section). More interesting is the behavior of the kernel at long lags: asymptotically, the kernel falls off as lag to the –3/2 power, rather than as a negative exponential function of lag as would be the case for a first-order autoregressive process. Thus brightness temperature time series depend on surface temperature variations at times farther in the past than an autoregressive process having the same characteristic timescale.
Semi-log plot of the convolution kernel relating surface temperature and brightness temperature variations, using parameters appropriate to near-surface Antarctic firn and emission at 37 GHz, vertical polarization. The convolution kernel has been normalized by 10–6 for plotting purposes. Note that an exponential function, as would be seen for a first-order autoregressive process, would appear as a straight line on this plot.
3. Methods for Numerical Computations and Comparison With Observations
The square-root singularity of the convolution kernel at zero lag makes numerical computations based directly on Equation 1 problematic. The problem is easily avoided, however, by a simple change of variable (Reference Press, Teukolsky, Vetterling and FlanneryPress and others, 1992). Let  Then Equation 1 becomes

which is easy to integrate numerically.
Comparison of our theory with observations is facilitated by eliminating the need to estimate Г and κ a. To this end, we set T Bm and T m equal to the means of the observed brightness temperature and surface temperature time series, respectively, and we compute the fractional variation in observed brightness temperature (from Equation 1):

The lefthand side of this equation is dimensionless and easily derived from observations, while the righthand side is a dimensionless numerical calculation in terms of the observed fractional variation in surface temperature. Thus, results presented in the following section are based on Equation 1.
Finally, comparison of theory with observations is complicated by the fact that actual brightness temperatures near the beginning of a given record depend on surface temperatures at times prior to the first observation. Moreover, computed brightness temperatures reflect our (artificial) assumption that surface temperature was constant prior to the beginning of observations. We address this issue by using surface temperature time series that are precisely an integer number of years, N, in duration, and we periodically extend the time series to make the extension many times τ 0 in length. We verify that the computed brightness temperature series during the last N years of output differ only negligibly from those during the previous N years, and we use only the final N years of output for comparison with observations. Although surface temperature variations during the 2 or 3N years prior to brightness temperature observations surely were not exactly those during the observation period, we effectively assume that the true variations differed little from the periodic extension of data into the past. Because the surface temperature time series presently available are rather short, we prefer this assumption to the alternative of using brightness temperature series significantly shorter than the surface temperature series.
4. Comparison with Observations
For a first comparison of theory with observations, we adopt the method of Shuman and co-workers (Reference Shuman, Alley, Anandakrishnan and StearnsShuman and others, 1995; Reference Shuman and StearnsShuman and Stearns, 2001; Reference Shuman and ComisoShuman and Comiso, 2002), which combines near-surface (∼1.75 m) temperatures from an AWS with satellite observations of 37 GHz, vertically polarized brightness temperature. The AWSs provide point observations of temperature every 10 min (when the sensor is functioning), at locations known to accuracies on the order of 100m or less (Reference Shuman and StearnsShuman and Stearns, 2001; Reference Shuman and ComisoShuman and Comiso, 2002). By contrast, satellite observations of 37 GHz brightness temperatures for a given location are acquired a few times per day and are spatial averages over largely, though not precisely, overlapping sensor footprints with diameters of approximately 30km (Reference Gloersen, Campbell, Cavalieri, Comiso, Parkinson and ZwallyGloersen and others, 1992). Two satellite observations per day are averaged and gridded spatially at a resolution of 25 km (Reference Gloersen, Campbell, Cavalieri, Comiso, Parkinson and ZwallyGloersen and others, 1992; NSIDC, 1992). Shuman’s method assumes that the accuracy of geolocation in gridding is a small fraction of the grid resolution, identifies one gridcell with the location of a given AWS and compares the (daily average) brightness temperature for that gridcell with the daily average of point temperature observations from the AWS. The validity of such a comparison depends on the times during the day at which the two relevant satellite observations occur for a given site, on the correlations of brightness temperature between adjacent gridcells, which are very high, and on the spatial scale of daily temperature variations, which is not well known. However, Shuman and co-workers’ comparisons at a variety of ice-sheet locations removed from coastlines show close correspondence to within a (seasonally variable) scaling factor, namely the effective emissivity discussed in section 1 (Reference Shuman, Alley, Anandakrishnan and StearnsShuman and others, 1995; Reference Shuman and StearnsShuman and Stearns, 2001; Reference Shuman and ComisoShuman and Comiso, 2002). We have adopted the method on this basis.
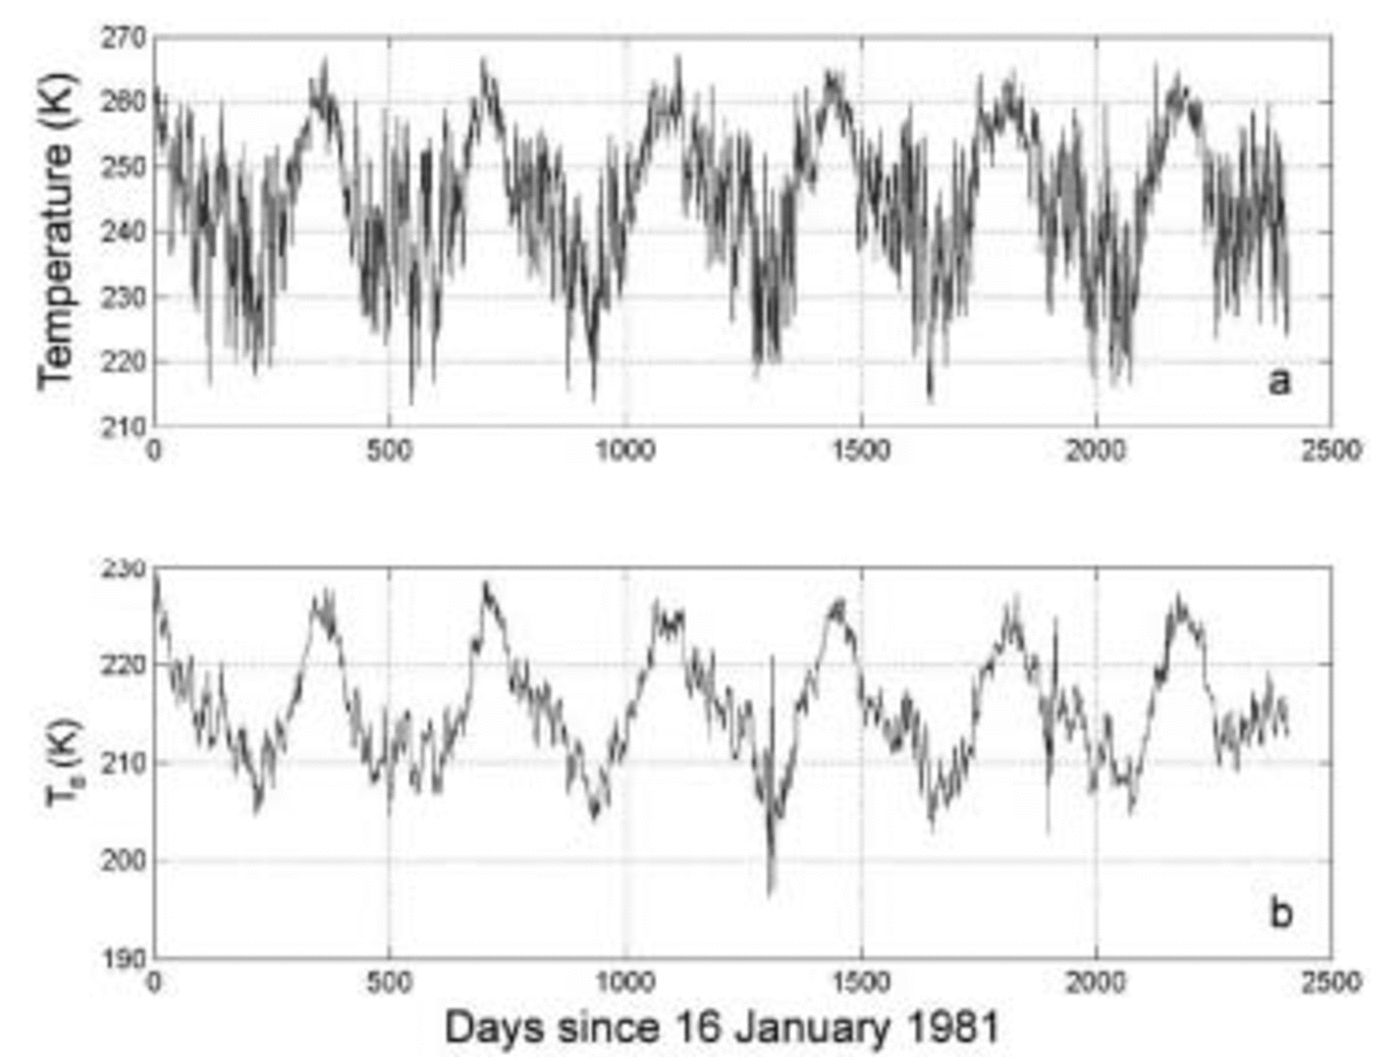
Specifically, we have used part of the dataset of Reference Shuman and StearnsShuman and Stearns (2001) (provided to us by C. A. Shuman) which includes daily average temperatures from the Byrd AWS which span 7 years (2556 days), beginning on 16 January 1981, with only 4 missing days; we filled in the missing days with averages of the daily temperatures on either side of the gaps. Brightness temperature observations from the SMMR are available for the pixel containing the location of the Byrd AWS for the first 2408 days of the surface temperature record. Plots of the near-surface and brightness temperature records are shown in Figure 2.
(a) Plot of Byrd AWS near-surface (∼1.75m height) temperature data, from 16 January 1981 onward for 2408 days. (b) Corresponding brightness temperature observations at 37GHz frequency, vertical polarization, from the SMMR.
We followed the procedure described in section 3 to compute 7 year time series of fractional variance in brightness temperature using various values of τ 0, and then compared the first 2408 values of the predictions with the observed brightness temperatures. Figure 3 shows the comparison for a value of τ 0 at the upper end of what we considered, a priori, to be plausible, τ 0 = 107 s ≈ 116 days. Figure 3a and b show the observed and computed fractional variations, respectively, while Figure 3c shows the residuals, i.e. the point-wise differences between computed and observed time series. Although the general character of the annual cycle is reproduced by the computation, the residuals even on annual time-scales are comparable in magnitude to the data, and reproduction of sub-annual variations is poor.
Plot of the fractional variation in (a) observed brightness temperatures, (b) computed brightness temperatures using a value of τ 0 = 107 s V 116 days, and (c) the difference of observed and computed time series.

By contrast, predicted variations using a value of τ 0 = 1.5 × 10⁶ s ≈ 17.4 days (Fig. 4) agree well with observations on all time-scales from interannual down to a few days, with correspondingly much smaller residuals. Figure 5 shows that the value τ 0 = 1.5 × 10⁶ s in fact minimizes (or very nearly minimizes) the difference between observation and computation, as measured by the standard deviation of residuals normalized by the standard deviation of the observed fractional variation. The minimum is narrow and global, so comparison of observed and computed time series effectively constrains the estimate for τ 0 based on observations.
Plot of the fractional variation in (a) observed brightness temperatures, (b) computed brightness temperatures using a value of τ 0 = 1.5 V 106 s V 17:4 days, and (c) the difference of observed and computed time series.

Plot of standard deviations of residuals between observed and computed time series (normalized by the standard deviation of the observed time series), as a function of τ 0. To verify the location of the minimum, note that the five (τ 0, normalized residual) pairs around and including the minimum are: (14.5, 0.2798); (15.9, 0.2782); (17.4, 0.2781); (18.8, 0.2792); (20.3, 0.2811).

There are two events in the brightness temperature record, near day 1320 and day 1910, that are clearly not captured by the prediction, though close examination shows that the data comprising those events are unusual; whether the data in the events result from physical events or from instrumental causes requires further investigation. Provisionally considering just the first 1000 days of data, however, we find that spectral behavior of the predicted series closely matches that of the observations. Figure 6 shows plots of power spectral densities of fractional variations in near-surface temperature, brightness temperatures, and the predicted brightness temperature with τ 0 = 1.5 × 10⁶ s. The observed and predicted spectra are both ‘reddened’ in comparison with the near-surface temperatures because surface variations are smoothed by diffusion into the snow and by emission from a range of depths. The prediction not only captures accurately the reddening at all frequencies up to that corresponding to about 4 days, but also tracks even fine details of the observed spectra up to frequencies corresponding to about 20 days.
Plot of estimated power spectral densities of fractional variations in the Byrd near-surface temperature data (upper, thin line), and the observed (lower, thick line) and predicted (lower, thin line) fractional variations in 37 GHz, vertically polarized brightness temperature, using the first 1000 days of data and predictions shown in Figure 4.

5. Discussion
It is, we think, somewhat remarkable that the 37 GHz brightness temperature variations at Byrd Station from 1981 to 1987 can be modeled accurately on a wide range of timescales, using only the simplest model of the relevant physics and a single characteristic time-scale. Moreover, the derivation of that time-scale, τ 0, shows how independent thermal and microwave characteristics of the firn act to determine the one-parameter convolutional relation between surface and brightness temperatures. Combined observations of surface and brightness temperatures tightly constrain the value of τ 0 to a value near 1.5 × 10⁶ s, which agrees well with that indicated by independent estimates of firn thermal and microwave properties, namely 1.43 × 10⁶ s (cf. section 2).
Neither the magnitude of the residuals in Figure 4 nor the spectra in Figure 6 show any strong evidence for variation of τ 0 with time over the (nearly) 7 year record. Thus this initial comparison suggests constancy in the relation between surface and brightness temperatures in West Antarctica near Byrd Station. This is particularly pertinent for the application of multi-proxy calibration methods (Reference Mann, Bradley and HughesMann and others, 1998) in Antarctica, which estimate spatial patterns of temperature variability without assuming a particular (or even spatially invariant) relationship between temperature and proxies such as brightness temperature, but for which constancy of the relation through time is especially important.
Wider application of these results will clearly depend on whether their apparent simplicity also holds at other times and places; we are presently investigating this question.
Acknowledgements
We thank C. A. Shuman for providing brightness temperature and AWS data in a convenient format, and for valuable discussions. This work was supported initially by the NASA Earth Science Enterprise, grant NAG5-10225, and primarily by the US National Science Foundation Office of Polar Programs, grant OPP 0126161.



