



I. INTRODUCTION
The use of a dichotomy algorithm for indexing powder diffraction patterns was introduced by Louër and Louër (Reference Louër and Louër1972) with the first computer program written for orthorhombic and higher symmetry systems. Later, with the advances in computer technology, extensions to monoclinic (Louër and Vargas, Reference Louër and Vargas1982) and triclinic systems (Boultif and Louër, Reference Boultif and Louër1991, Reference Boultif and Louër2004) were reported. In this method, the position 2θ i of the diffraction lines and the absolute uncertainty Δ(2θ) i on their measure, namely 2θ i ± Δ(2θ) i , are used for the search of indexing solutions. This approach presents the advantage of avoiding a propagation of errors on a random basis, provided experimental errors do not exceed the absolute uncertainty Δ(2θ) i . Nowadays, more complex cases are reported in powder diffraction studies, particularly with the use of high-resolution powder diffractometers with synchrotron X-rays. It is therefore appropriate to introduce some optimization in the analysis, in particular for triclinic powder data, as well as new facilities, in the current versions of the computer program: DICVOL04 (Boultif and Louër, Reference Boultif and Louër2004) and its expanded version DICVOL06 (Louër and Boultif, Reference Louër and Boultif2007). These features are described in the present study and some aspects of importance in the use of the dichotomy algorithm are discussed. The performance of the new version, DICVOL14, is illustrated with many powder diffraction data sets.
II. THE DICHOTOMY METHOD AND DICVOL14
Powder pattern indexing is based on the quadratic equation obtained by squaring the reciprocal lattice vectors d hkl * (=1/d hkl ), i.e. Q hkl (=1/d hkl 2) = f(a, b, c, α, β, γ, h, k, l), where a, b, c, α, β, and γ are the linear and angular parameters of the unit cell and hkl the Miller indices. The dichotomy method is based on the variation in direct space (for monoclinic and higher symmetry systems) of the lengths of cell edges and the interaxial angle of monoclinic cells by means of finite sections (0.4 Å and 5°, respectively), followed by a progressive reduction of these intervals with a dichotomy procedure. For the triclinic system a specific strategy is used in order to reduce calculation times. The algorithm is applied in Q-space to the powder constants, Q A, Q B,…, Q F of the quadratic equation (for details, see Boultif and Louër, Reference Boultif and Louër1991), and the first two lines in the input data are constrained by selected hkl indices. The successive dichotomy process is applied until the intervals become very narrow. Whatever the symmetry, at each dichotomy level a pattern is calculated in the form of intervals [Q −(hkl), Q +(hkl)] for each line. They are compared with the observed data, Q i ± ΔQ i , and the solution is retained if the following conditions are verified:
 $$Q_{-}(hkl) - \Delta Q_i \le Q_i \le Q_+(hkl)+\Delta Q_i$$
Optimizations and some heuristic knowledge are introduced to improve the convergence of the tree-type process, e.g. the search of mathematical solutions with smallest cell volumes from scanning the volume space by shells of 400 Å3. For the triclinic symmetry, the first volume shell is estimated from the relation between the number of diffraction lines and the volume of the triclinic cell (see Smith, Reference Smith1977). The reliability of the solutions is checked with the de Wolff (Reference de Wolff1968) figure of merit (FoM) , whose definition shows that the higher accuracy of data and the more complete the pattern, the larger is the FoM.
Compared to DICVOL04/06, the new version of the computer program, DICVOL14, includes: (i) an optimization of filters in the final stages of the convergence of the successive dichotomy process, which are adapted to the higher precision obtained with synchrotron X-rays; (ii) an optimization for the triclinic system of the step length for scanning the powder constants, as well as an extension of the scanning limits for cases with a long axis; (iii) a new approach for zero-point offset evaluation; and (iv) a detailed review of the input data from the resulting unit cells. In addition to the visualization on the computer screen of the progress of a calculation, two output files are created. The main file contains the solution(s) found in the course of the indexing process, and the second one with the extension “ord” (already introduced, in a shorter form, in the DICVOL06 version) gives the solutions ranked according to their FoM, M 20. In this file, all calculated lines, together with the observed lines, are listed for the top five mathematical solutions. Further results from cell-centering tests on the final indexing output listings are shown and the probable Bravais-type lattice is derived. The review of the powder data can be used for checking that all input observed lines are indexed and a careful analysis of systematic extinctions can give space group information. The determination of the correct space group from powder data is rarely unambiguous so that, as stated by McCusker and Baerlocher (Reference McCusker, Baerlocher, David, Shankland, McCusker and Baerlocher2002) “it is important to keep the uncertainty of the assumed space group in mind in subsequent steps” of a structure determination.
III. DICHOTOMY ALGORITHM AND DATA QUALITY
A. Effect of the uncertainty on peak positions
The absolute uncertainty Δ(2θ) i on the peak position is an important parameter in powder pattern indexing. Too large selected errors Δ(2θ) i would introduce instabilities arising from more possible theoretical lines within the error interval, they would lengthen computing time and they would increase the risk of missing the correct solution. Clearly, the higher the precision, the narrower the absolute error can be set, and easier is the pattern indexing. Generally, for data collected with laboratory X-rays and CuKα radiation a standard experimental error is ±0.03° (2θ) (default value in DICVOL14 for monoclinic and higher symmetry); however, it is desirable to reduce it for the triclinic symmetry, e.g. ±0.025° (2θ) (default value in DICVOL14) and, also, when large cell axes are expected or if the density of lines is high (e.g. large-cell volume, presence of spurious lines, short wavelength). For a shorter wavelength λ, as frequently used with synchrotron X-rays, the default value in DICVOL14 is set proportional to the ratio λ/λ Cu Kα . The default values must, however, be critically considered according to the diffraction line broadening. It is worth considering the absolute error on the individual lines with respect to their width and resolution in the diffraction pattern. The instrumental resolution function (IRF) of the diffractometer used to collect the data (see, for example, Louër and Langford, Reference Louër and Langford1988) is the reference for minimum line broadenings. In practice, the measured full-width at half-maximum (FWHMs) can be used for estimating the error intervals ±Δ(2θ) on peak positions. As a rule of thumb an error interval in the range 1/2–1/3 FWHM is a reasonable (starting) estimation for separated lines. [It can be noted that for non-uniform FWHMs, e.g. in case of anisotropic line broadening, line overlap or low-counting statistics, the absolute error Δ(2θ) i can be set for each individual line i.]
With the advent of high resolution with synchrotron X-rays and the use of short wavelengths, data collection with step sizes as small as 0.001° (2θ) are reported. This is illustrated in Figure 1 with data collected at the 11-BM synchrotron beam line (Argonne Advanced Photon Source) (Papoular et al., Reference Papoular, Toby and Agafonov2011). It shows a line profile in the pattern of triclinic tetracaine hydrochloride (λ = 0.458 82 Å), collected with steps of 0.001°(2θ), with a FWHM = 0.0106° (2θ). The angular interval shown at the top of the line profile corresponds to 0.003° (2θ), i.e. ±1.5 steps or ±0.0015° (2θ), close to 1/3 FWHM. When using this small uncertainty on input peak positions the solution is obtained in 0.1 s with DICVOL14.
Example of diffraction line profile in the powder diffraction pattern of tetracaine hydrochloride collected with synchrotron X-rays, λ = 0.458 82 Å (11-BM synchrotron beam line, Argonne Advanced Photon Source), step size 0.001° (2θ) (Papoular et al., Reference Papoular, Toby and Agafonov2011). The FWHM is 0.0106° (2θ) and the 0.003° interval corresponds to an absolute error Δ(2θ) of 0.0015° (2θ).

B. Error magnitude and computing time
The magnitude of the absolute error |Δ(2θ) i | has an effect on the search of indexing solutions with the dichotomy algorithm and, consequently, on computing times (CPU times). This is also dependent on the lattice symmetry since the density of lines increases according to the number of unit cell parameters. It has already been shown that DICVOL91 is tolerant of imprecision (Louër, Reference Louër, Prince and Stalick1992). Simulated powder data of orthorhombic and monoclinic materials with a random error were used in order to assess the behavior of the program (see Figure 2 in Louër, Reference Louër, Prince and Stalick1992). Successful indexing was obtained with random errors as large as 0.10° (2θ) and 0.07° (2θ), respectively. In the same review, the effect of zero-point errors (see Figure 3 in Louër, Reference Louër, Prince and Stalick1992) has also been studied. For the two examples the correct solution was found up to 0.30° (2θ) and 0.15° (2θ) zero-angle offset, respectively. This tolerance to random and systematic errors was also noted by Shirley (Reference Shirley, Block and Hubbard1980). Some powder data collected with laboratory and synchrotron X-rays are used to further illustrate the effect of the magnitude of the error parameter.
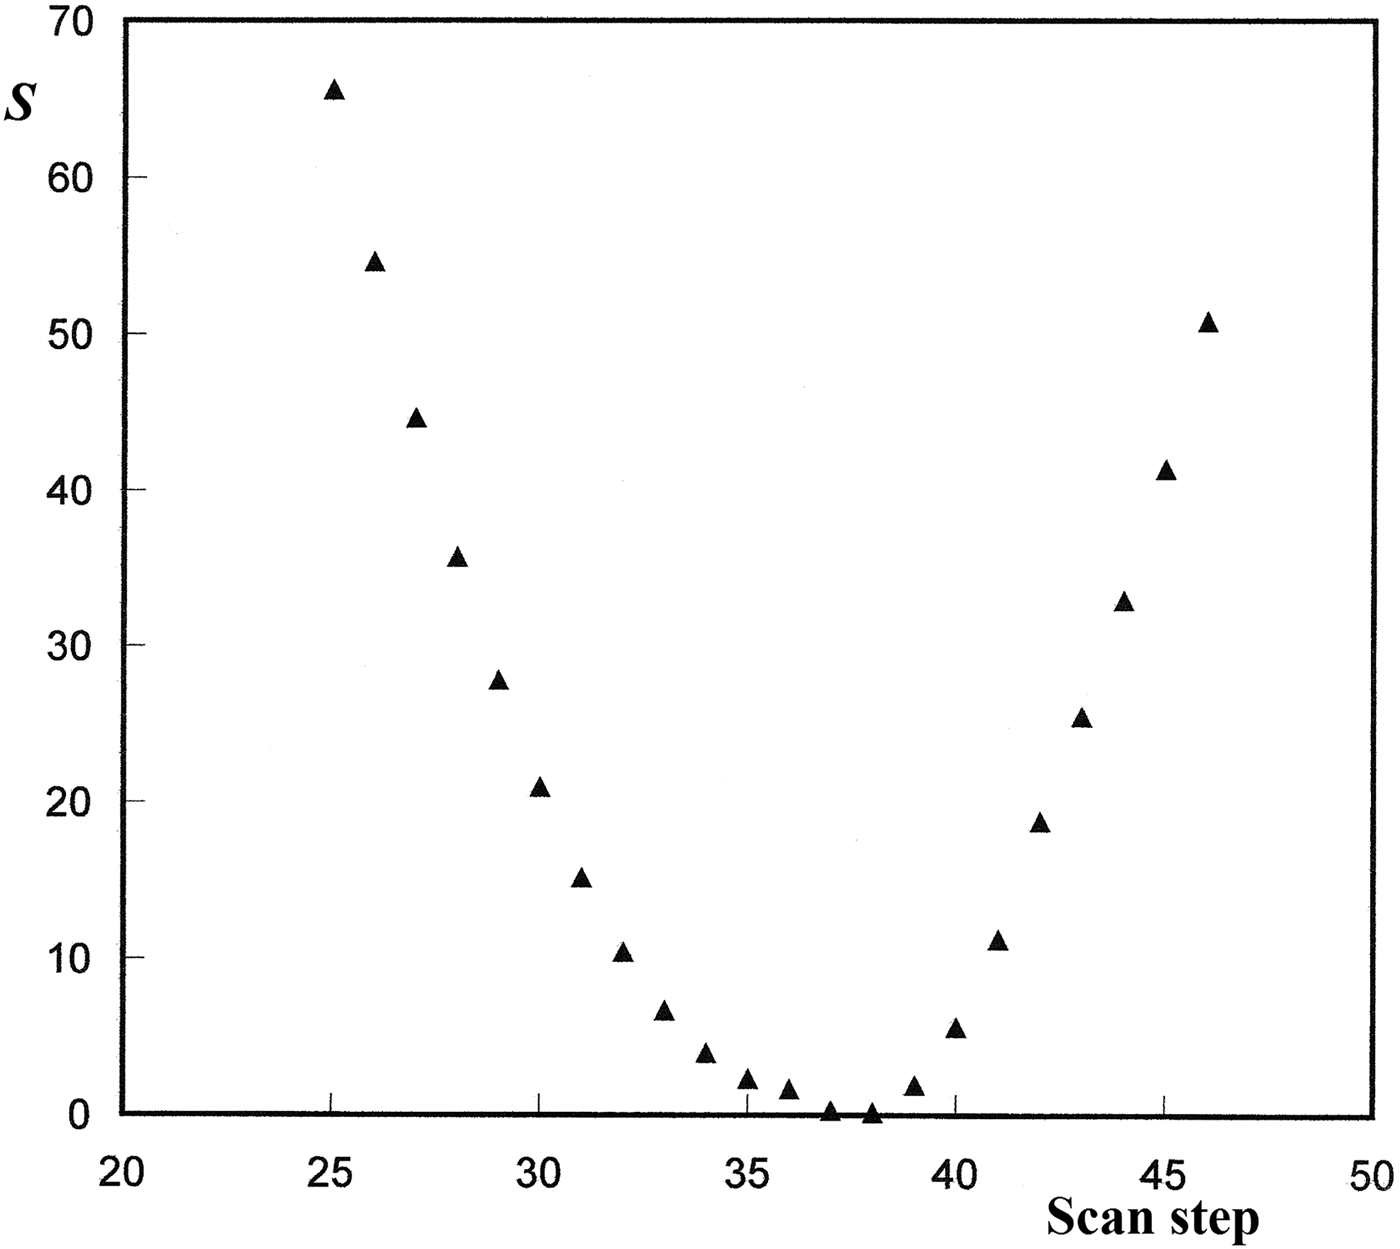
Search of the zero-point offset with the scanning approach based on the pairs of harmonic lines detected in the powder data set. S is the residual minimized with a least-squares analysis.
(i) Standard powder diffraction data
The powder data were collected with laboratory monochromatic X-rays (λ = 1.540 596 Å) using the Debye–Scherrer (D–S) geometry for low-absorbing materials and Bragg–Brentano (B–B) geometry for materials with heavy atoms. The absolute error |Δ(2θ)| on powder data input in DICVOL14 was progressively increased until the program failed (the number N of lines for the indexing search was set to 20). The results are as follows:
-
- Tetragonal urea (D–S), Powder Diffraction File (PDF) entry 55-0142 (ICDD, Reference Soorya2014), only one solution is found up to |Δ(2θ)| = 0.70°, CPU times are lower than 1 s until |Δ(2θ)| = 0.20°.
-
- Orthorhombic theophylline (D–S, PDF entry 55-1653), only one solution is found up to |Δ(2θ)| = 0.19°, CPU times are lower than 2s.
-
- Monoclinic barium titanate oxalate (B–B, Louër et al., Reference Louër, Boultif, Gotor and Criado1990), the maximum volume in DICVOL14 has been set to 3000 Å3, the solution is found up to |Δ(2θ)| = 0.15°, CPU times are lower than 1 s until |Δ(2θ)| = 0.05°.
-
- Triclinic uranium uranyl phosphate (B–B, PDF 48-1227), the solution is found up to |Δ(2θ)| = 0.06°, CPU times are lower than 60 s until |Δ(2θ)| = 0.04°.
It appears again that indexing with the dichotomy algorithm (DICVOL14) is generally not too sensitive to imprecision. The tolerance |Δ(2θ)| decreases from high to low symmetry, i.e. for the selected examples 0.70° (2θ) (tetragonal), 0.50° (orthorhombic), 0.15° (monoclinic), and 0.06° (triclinic). As expected, a side effect of increasing |Δ(2θ)| is the increase of CPU times, which remain small for high-symmetry cases but become significantly greater for low-symmetry cells, particularly the triclinic case.
Although the results reported here demonstrate the efficiency of the dichotomy algorithm, it is important to keep in mind that wide uncertainty limits on peak positions increase the risk of generating wrong solutions, particularly as soon as the number of cell parameters increases. Then, data quality (noted by minimal errors on measured Bragg angles) remains a recommended practice in powder pattern indexing. Moreover, incompleteness of the input data may be an additional reason for failure or long computing times. For triclinic symmetry examples, incompleteness in the input data is reflected in the parameter N calc of the Smith and Snyder FoM (Reference Smith and Snyder1979) reported as “F N = value [Δ(2θ), N calc]”. Each solution found by DICVOL14 is characterized by F 20. A high value of the number of calculated lines N calc, until the 20th observed line, indicates that many lines are probably missing in the input data set, and then the solution must be further examined thoroughly, e.g. from the review of the entire data set (N total lines) reported in the file “.ord”. Additionally, impurity lines may also cause indexing failure. The user must approach indexing with discernment and critical thinking when impurities may be present in a sample.
(ii) High-resolution powder diffraction data
With synchrotron X-ray sources narrow line profiles are observed for materials with negligible intrinsic line broadening. This is illustrated in Figure 1. The precision on measured peak positions is high and the absolute error is small. An immediate consequence in pattern indexing is a significant increase of the magnitude of the FoM of solutions obtained from synchrotron data compared with laboratory data (see, for example, Cernik and Louër, Reference Cernik and Louër1993). The effect of the magnitude of |Δ(2θ)| on the indexing with DICVOL14 of the powder data of triclinic tetracaine hydrochloride [a = 7.4060(6) Å, b = 8.5713(7) Å, c = 13.710(1) Å, α = 106.252(6)°, β = 90.767(7)°, γ = 98.705(9)°, V = 824.49(11) Å3, M 20 = 204, F 20 = 2073(0.0004, 22)] can be summarized as follows: the solution is obtained for errors in the range 0.0015°–0.015° (2θ), with CPU time varying from 0.07 to 15 s, respectively. Only the correct solution (M 20 ≈ 200) is found up to an error of 0.005° (2θ). With greater errors the correct solution is still found, but additional cells with lower M 20 values are also proposed.
C. Zero-point offset evaluation from a scanning approach
An optional analysis of the zero-angle offset in the input data was proposed in DICVOL04. Its interest was essentially for uncalibrated data with significant zero shift. Indeed, for small shifts [e.g. ≲ 0.05° (2θ)], the extra degree of freedom (for the mixed error parameter, including the true zero-point shift and specimen-surface displacement in B–B optics) in the refinement process of the lattice parameters is generally efficient enough to solve the problem. A benefit of refining the “zero-shift” is an increase of the FoMs (see, Louër and Boultif, Reference Louër and Boultif2006).
For greater zero-point shifts the method used in DICVOL04 was based on the reflection-pair method reported by Dong et al. (Reference Dong, Wu and Chen1999). In the context of pattern indexing, some ambiguous results were often found with DICVOL04, leading to long CPU times. In the new version DICVOL14, a scanning approach has been preferred. The procedure is also based on the use of higher orders of reflections, if they can be identified unambiguously. In the present approach, the input 2θ i positions are artificially shifted by a zero-point varying in an interval [−0.30°, +0.30° (2θ)] with a scan step width of 0.005°. For each step, the effect on the different line orders is calculated through the quantity Δm (=m–d i /d j , where d i and d j are the d-spacings of two line orders for a particular step, and m is the integer corresponding to the ratio of the d-spacings). All identified pairs of lines with an integer ratio are considered. The zero-point is then estimated from a least-squares analysis, by minimizing the residual S [=Σ(Δm/m)2]. The sum is taken over pairs of harmonics. As shown in Figure 2, for a particular example, the minimum of the residual is located between steps 37 and 38, i.e. the zero-shift [=(37 + 38)/2 × “step width”] is 0.1875° (2θ).
The scanning approach for zero-point shift estimation is stable and a unique solution is obtained, provided unambiguous higher orders of lines at low angles are identified. The method has been tested successfully on many experimental powder data sets. In particular, all 30 triclinic powder data reported in the whole NBS monograph 25 (1963–1985) were artificially degraded by a zero shift in the range 0.15°–0.30° (2θ). These data were subsequently analyzed with DICVOL14. Twenty shifted patterns were correctly indexed.
The powder data of acetylcysteine reported in the PDF entry 46-1988 (ICDD, Reference Soorya2014), with the quality “i”, are characterized by a low FoM F 30 = 20(0.031, 49). They can be used to illustrate the usefulness of the scanning method implemented in DICVOL14. The unit cell is triclinic (a = 5.897 Å, b = 6.548 Å, c = 5.108 Å, α = 103.93°, β = 102.19°, γ = 96.34°, V = 184 Å3). With 0.03° (2θ) as absolute error on peak positions, an unsatisfactory solution (V = 477 Å3), with a poor FoM [F 20 = 17(0.018, 65)], is found in the second volume domain (352 s). If the parameter for searching a zero-point offset is activated, a zero-point error −0.125° (2θ) is suggested and the correct solution [M 20 = 33, F 20 = 51(0.016, 25)] is found in 0.3 s.
IV. TESTING DICVOL14
The compilation of the FORTRAN program (MS-DOS version) and all applications of DICVOL14 have been performed with a Dell XPS 15 laptop equipped with an Intel processor 2.4 GHz with Turbo Boost up to 3 GHz. The executable program can be downloaded from the web site (http://www.cdifx.univ-rennes1.fr/progs/dicvol14/DICVOL14.zip).
A. General tests
DICVOL14 has been tested from powder data reported in the NBS Monograph 25 (Natl Bur. Stand., 1963–1985), namely 70 experimental and one calculated patterns reported in section 20 (Natl Bur. Stand., 1984) [absolute uncertainty Δ(2θ) = 0.03°], as well as the 30 patterns of triclinic compounds (including seven calculated patterns) reported in the whole NBS Monograph 25 [absolute uncertainty Δ(2θ) = 0.025°]. [For the powder data of Li4Th7(MoO4)16 and Li4Th7(WO4)16 the parameter “VOLMAX” was set to 3500 Å3.] The patterns were all correctly indexed, except for the data of triclinic KIO3 (Section 15, a = 7.708 Å, b = 7.222 Å, c = 7.689 Å, α = 109.25°, β = 108.96°, γ = 109.37°, V = 355.9 Å3). This phase is described as a “pseudo-monoclinic perovskite-type” and only a triclinic cell with half the correct volume was obtained with DICVOL14. For the 100 indexed patterns, the average computing times were less than 1 s for orthorhombic and higher-symmetry data sets and 4 s for monoclinic cases, except for one data set (Eu2O3) indexed in 80 s. Thirteen powder data sets of triclinic compounds were indexed in less than 5 s, eight in the range 5–30 s, six in the range 30–160 s, and the last two data sets in 360 and 690 s. The program has also been successfully tested with experimental powder data using the density and formula weight of the material as input information. As shown by Louër and Vargas (Reference Louër and Vargas1982), substantial reduction of computing times are obtained when the density information is used, since only limited volume domains of the direct parameter-space are explored. The powder data of pharmaceutical materials listed in Boultif and Louër (Reference Boultif and Louër2004; Table 2) were also indexed.
B. Triclinic examples
To improve further the triclinic section of DICVOL14, additional powder diffraction data of materials with a triclinic cell from the PDF, with quality “C”, “*”, and “i”, have been used to check the behavior of the program. Among them, 40 examples with peculiarities were selected according to the presence of a dominant zone (several successive first lines with a common zero Miller index, No. “0” in Table I), to long edges with several higher orders of the first line as first lines (N harm in Table I) of the data set, or having close linear parameters. They were successfully indexed; some representative examples are listed in Table I. From the input data the presence of harmonic lines as first lines in the pattern (N harm) can be easily detected, and it is the indication of a long axis with respect to the two others. In practice, with such experimental powder data, it is necessary to act on some input control parameters to have a chance to identify the correct solution, i.e. the number of lines N (>20) used for searching solutions, the absolute error Δ(2θ) and the tolerance for spurious lines N imp (which include impurity lines and measured line positions with an error exceeding the input absolute error).
Examples of triclinic powder data with a dominant zone or long axis indexed with DICVOL14. Data quality (PDF, ICDD, Reference Soorya2014): “C” for calculated, “*” for precise data, and “i” for indexed data. The linear cell parameters are given, No. “0” is the number of successive first lines with a common zero index, N harm is the number of successive harmonic lines at lowest angles, N is the number of lines used for the indexing search, N imp is the number of allowed impurity lines, N calc is the number of calculated lines up to the 20th observed line, Δ(2θ) the input absolute error in DICVOL14 (i.e. 0.002° for calculated patterns and 0.025° for experimental patterns), and CPU is the computing time.
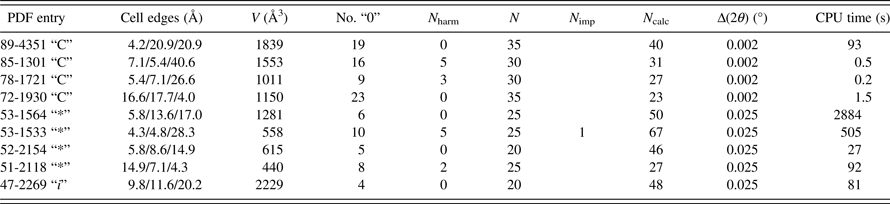
The powder data of n-docosane (PDF entry 53–1533 “*”) can be used for illustration. The parameters of the reduced cell are a = 4.28 Å, b = 4.82 Å, c = 28.26 Å, α = 86.41°, β = 85.95°, γ = 73.61°, and V = 557 Å3. The first five lines are 00l lines (l = 1–5), consequently the value for N was increased to 25. With the default value for the absolute error and no spurious lines [Δ(2θ) = 0.025°, N imp = 0], a first calculation (81 s) with DICVOL14 is unsuccessful. A second run with a tolerance for one spurious line [Δ(2θ) = 0.025°, N imp = 1] gives the correct reduced cell [M 20 = 14 and F 20 = 22(0.014, 67)] in 510 s. The value of N calc = 67 indicates that many possible lines are missing from the input data and the indexing listing shows that one line among the 25 lines used for indexing has a discrepancy (2θ calc–2θ obs) = 0.042°2θ.
C. Impurity lines, binary patterns
Powder pattern indexing is a demanding application of the powder method. This is a consequence of the ill posed mathematical problem as noted in this statement by Vand and Johnson (Reference Vand and Johnson1968) “we cannot solve the indexing problem by the method of ordinary algebra, as no matter how many (quadratic) equations we take, we have always more unknowns than knowns”. The dichotomy algorithm is a means to circumvent this problem. Generally, data quality must be as high as possible and it is desirable to avoid impurity lines, because they introduce additional unknown parameters and methodological instabilities. However, for a few two-phase patterns, some successful results have been reported with DICVOL04 (Louër and Boultif, Reference Louër and Boultif2006). A sample of 15 powder data sets of binary-mixture patterns have been used to test the efficiency of the parameter “number of spurious lines” in DICVOL14. Data were taken from the NBS Monograph 25 (1963–1985) and from the PDF (ICDD, Reference Soorya2014) for the piracetam polymorphs. The individual data sets were added to simulate mixing and DICVOL14 was used for searching an indexing solution. Clearly, only the solution of the phase with higher density of lines could be expected. A small error Δ(2θ) (e.g., 0.01°2θ) was used to reduce instabilities and to limit the number of mathematical solutions. For 12 data sets, a correct indexing solution was obtained (Table II). For two binary patterns of triclinic/monoclinic and triclinic/triclinic phases, many solutions were proposed; however, the correct solution was ranked at the fourth position over 32 and first over 37 solutions, respectively. For one mixture of patterns of triclinic phases the program failed because the first line belonged to one phase and the second line to the second phase (which contradicts the strategy used for the triclinic symmetry).
Binary powder data sets. V is the cell volume given for both compounds, Δ(2θ) is the absolute error, N is the number of observed lines used for indexing the phase with the highest number of lines, and N imp is the number of allowed unindexed lines. Lattices are denoted as follows: (T) tetragonal, (H) hexagonal, (O) orthorhombic, (M) monoclinic, and (Tr) triclinic. The lattice in bold characters corresponds to the solution found by DICVOL14.
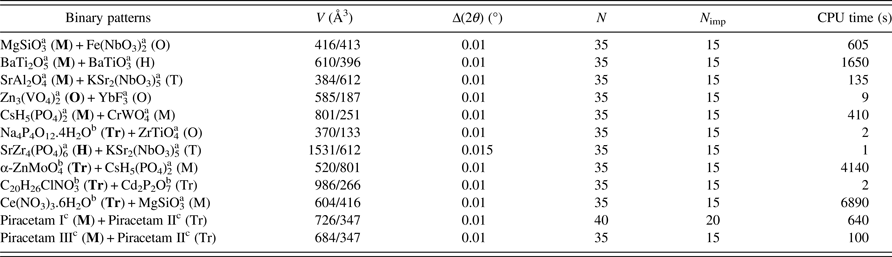
The use of DICVOL14 with binary mixture data sets must be considered with caution. Only in some particular circumstances, for example in the course of solid-state syntheses or mixture of polymorphs, such application could be helpful to indentify the content of the pattern. This is illustrated with the pharmaceutical compound piracetam. In the course of the structure determination study of form I from powder diffraction data (Louër et al., Reference Louër, Louër, Dzyabchenko, Agafonov and Céolin1995) and stability study of piracetam polymorphs (Céolin et al., Reference Céolin, Agafonov, Louër, Dzyabchenko, Toscani and Cense1996), mixtures of polymorphs II and III, on one hand, and I and II, on the other hand, were observed. Powder data of these two binary mixtures were simulated from the powder data of the pure phases collected with a D–S setup, namely form I (monoclinic, PDF entry 54-2432), form II (triclinic, entry 54-1783) and form III (monoclinic, entry 54-1784). The monoclinic cells of form I and form III in mixtures I/II and III/II, respectively, were found with DICVOL14 (Table II). As already noted, this application of DICVOL14 remains marginal. Obviously, the main objective of DICVOL14 is to index single-phase data. It is always desirable to identify spurious lines, for example with the help of search/match methods for phase identification (for a review, see Langford and Louër, Reference Langford and Louër1996) or other appropriate technique, e.g. temperature- or time-dependent X-ray powder diffraction in the cases of Advil tablet (Boultif and Louër, Reference Boultif and Louër2004) and piracetam (Céolin et al., Reference Céolin, Agafonov, Louër, Dzyabchenko, Toscani and Cense1996).
V. CONCLUSION
The new version DICVOL14 of the program for indexing powder diffraction patterns with the dichotomy algorithm is the successor of DICVOL04. Some improvements and optimizations have been introduced, particularly for the study of triclinic phases, generally the most difficult case to solve with the dichotomy algorithm. It must be noted that the major contribution to the program series was done in DICVOL04, which remains the base reference. With our long experience from hundreds of patterns, including many cases for which indexing opened the door to subsequent ab initio structure determination, it appeared useful to introduce in a new version some facilities and to comment the use of some control parameters.
ACKNOWLEDGEMENTS
The authors thank Dr. Robert Papoular (IRAMIS/Léon Brillouin Laboratory, CEA/CEN-Saclay, France) for providing the powder diffraction data of tetracaine hydrochloride and for helpful discussions, and Dr Thierry Roisnel (Centre de Diffractométrie X, Institut des Sciences Chimiques, Université de Rennes 1, France) for his assistance for the web site.



