


1. Introduction
The value of a share is determined, in theory, by the expected dividends and other cash payments which the share provides, and by the discount rate or rates at which the expected payments are discounted. The discount rate is given by the risk-free interest rate plus a risk premium. If the view of ‘the market’ changes about one or more of these price-determining variables, the share price should change. The main aim of this paper is to explain how variation in the price-determining variables ‘translates into’ variation in fundamental value.
An important application of our analysis lies in the study of stock market volatility. It is widely believed that there are periods when actual stock market value deviates substantially from its fundamental value, resulting in increased market volatility. In other words, much of the observed market volatility is thought to be a result of ‘irrational’ valuations, i.e. valuations affected by behavioural factors that do not appear in standard finance models of asset value. The claim that prices are excessively volatile can be expressed as a claim that prices vary over time by more than is justified by variation in the price-determining variables. The analysis will therefore help readers to form a better-grounded view as to whether markets are indeed excessively volatile.
The original debate on volatility was prompted by Shiller's (Reference Shiller1981) finding that stock market value varies over time much more than does the present value of subsequent dividends, assuming perfect foresight for dividends and interest rates. Campbell & Shiller (Reference Campbell and Shiller1988) allow forecasts of the real interest rate and real dividend growth rate to vary over time, and they use vector autoregression (VAR) to arrive at these forecasts. The risk premium, the expected return on equity less the risk-free interest rate, is assumed to be constant. They conclude that changes in the forecasts are insufficient to explain the observed volatility of US market values. Shiller & Beltratti (Reference Shiller and Beltratti1992) present similar evidence using UK data. This evidence raised the question as to whether the ‘excess’ volatility thus identified can reasonably be explained by changes in the expected risk premium, or whether the excess volatility is better seen as evidence for changes in investor sentiment that cannot fully be explained by changes in the variables that affect value (Cochrane, Reference Cochrane1991).
Subsequent research has questioned whether changes in forecasts of cash flows to equity and of discount rates are too small to explain the observed market volatility. Lettau & Ludvigson (Reference Lettau and Ludvigson2005) find that ‘changing forecasts of stock market dividend growth do make an important contribution to fluctuations in the post-War U.S. stock market’ (p. 585), though their evidence is consistent with the existence of excess volatility. Ackert & Smith (Reference Ackert and Smith1993) present evidence that, when share repurchases and cash payments resulting from acquisitions are added to dividends, the volatility of observed market values is not excessive, even assuming a constant discount rate. Larrain & Yogo (Reference Larrain and Yogo2008) compare the variation in dividend yield, in which the cash flows are given by dividends, and payout yield, in which cash flows are given by dividends plus repurchases less cash raised via share issues. Assuming an infinite future horizon, all of the variation in either measure of yield has to be explained by changes in forecast cash flows and discount rates. Using VAR forecasts, they find that 83% of the variation in dividend yield is explained by variation in the discount rate (their Table 9), consistent with excess volatility of market values. But, in contrast, 84% of the variation in payout yield is explained by variation in forecast payout growth, and changes in equity repurchase and issuance are ‘highly predictable’ (p. 220). So there is less support for the excess-volatility view, if yield is measured as payout yield instead of dividend yield. Chen & Zhao (Reference Chen and Zhao2009) show that the variation in forecast discount rates is very sensitive to the specification of the VAR forecasting model. The conclusion about the relative importance of variation in discount rates or future cash flows in explaining the variation in equity returns is also very sensitive to the VAR specification.
Actuarial analysis in recent decades has focused on the use of stochastic modelling techniques. The pioneering work of Wilkie (Reference Wilkie1986) presents a model in which the predicted natural log of the dividend yield for a given date is given by the mean of the log of the yield, plus 0.6 of the deviation of the observed yield one year ago from the mean value of the yield during the sample period, plus 1.35 of the log of inflation during the previous year, plus a random term which is modelled as an autoregressive process. This model has been subsequently refined and updated, as presented in Wilkie (Reference Wilkie1995) and Wilkie et al. (Reference Wilkie, Sahin, Cairns and Kleinow2010). Other actuarial models for simulating future economic and investment conditions in the UK are compared and discussed in Lee & Wilkie (Reference Lee and Wilkie2000).
For all the debate about the extent of excess volatility, the finance literature leaves readers with little understanding of how much variation in the forecast price-determining variables there has been, and how much variation is required to justify the observed volatility of market values. This is because most of these studies estimate the notional market values justified by price-determining variables from the Campbell & Shiller (Reference Campbell and Shiller1988) version of the dividend-growth model, or some variant thereof, combined with a VAR to estimate the year-by-year forecasts of the discount rates and cash flows. The variation over time in the forecasts of discount rates and cash flows, and their impact on the resulting estimate of rational market volatility, are opaque in such studies.
The current paper explores the market volatility justified by changes in price-determining variables in a more accessible manner. In the interests of simplicity and transparency, decomposition of the factors affecting value is based on the standard dividend-growth model. This means it is assumed that, at a given date, the values of the forecast discount rate and dividend growth rate are the same for each future year, and when the forecast discount rate or growth rate changes, the change applies to the forecast rate for every future year.
The paper employs UK data for the period 1921–2008. An advantage of using UK data is that cash flows to investors are almost entirely in the form of dividends, even in recent years. The paper presents base-case year-by-year estimates of the expected real interest rate as at date t, rr,t, and estimates of the expected real growth rate of dividends as at date t, gr,t, and shows how altering the assumed variation in these estimated forecasts affects the implied market volatility. The long-term inflation and real growth expectations are assumed to be rational and homogeneous. However, the risk-premium element is a residual that is inferred given current markets values, dividends, interest rates, and the forecasts of inflation and real growth. The risk premium in the model can reflect both rational and irrational expectations.
Our approach to forecasting is similar to that of papers which estimate the expected risk premium in the past (Blanchard, Reference Blanchard1993; Jagannathan et al., Reference Jagannathan, McGratten and Scherbina2001; Arnott & Bernstein, Reference Arnott and Bernstein2002; Best & Byrne, Reference Best and Byrne2001; Fama & French, Reference Fama and French2002; Ilmanen, Reference Ilmanen2003; Claus & Thomas, Reference Claus and Thomas2001; Vivian, Reference Vivian2007). These papers infer the expected risk premium from some version of the dividend-growth model, using a variety of relatively simple methods to estimate the forecasts of investors, none of which involve a VAR.Footnote 1 Base-case forecasts in this paper are thought to be reasonable, assuming that investors forecast a single future rr,t and gr,t at a given date t. An alternative assumption is that investors forecast different values for rr,t + n and gr,t + n for different future years t + 1, t + 2…, but that changes in these forecast values over time are equivalent to changes in single numbers for rr,t and gr,t.
The approach adopted in this paper is first used to estimate the expected risk premia on equity in the past, and to estimate the contribution to market volatility of changes over time in the expected risk premium. The market values that would have arisen if the expected risk premia were fixed at their estimated mean are then inferred. This enables a comparison to be made between market volatility implied under a fixed expected risk premium and actual volatility. The volatility of the base-case forecasts of rr,t and gr,t are then reduced to show the impact on implied market volatility.
The rational forecasts that should determine market value at any given time cannot be known with certainty, whatever method of estimation is used.Footnote 2 This paper joins others, mentioned above, which argue that estimates of rational volatility are sensitive to the choice of forecasts.Footnote 3 However, the main contribution is the transparent framework within which the forecasts of rr,t and gr,t determine fundamental value. It is hoped that the reader will be left with a much clearer grasp of the relationship between the volatilities of the forecasts and the resulting notional market volatility.
The rest of this paper is organised as follows. Section 2 provides a decomposition of equity and bond returns in terms of changes in the underlying fundamental variables. In section 3, expected dividend growth rates and expected real return rates in the past are estimated. Section 4 gives the results of the empirical analysis and section 5 concludes.
2. Decomposition of equity and bond returns
This section offers a straightforward analysis of the equity and bond returns for a given year in terms of changes in the variables that should affect equity and bond values.
2.1 Equity
The expected nominal equity return as at date t, rt, is estimated by

where Dt is the total dividends paid by listed companies in a given index during the year ending at date t, Pt is the total market capitalisation of the ordinary shares in the index at date t, and gt is the expected value of the annual growth rate of dividends, as at date t. Dividends are assumed to be paid at the end of the calendar year, for simplicity. Our notation uses capitals for actual observable values, and small letters for expected values; a date t is always at the end of a calendar year. For example, for t = 31 December 1989, investors are assumed to know the market capitalisation on that day and the value of dividends paid during 1989, and to have an expectation of the growth rate of dividends in 1990 and each subsequent year.
Return due to unexpected dividend growth in first year
The effect on the equity return of unexpected dividend growth during the next twelve months (i.e. the notional return for the year assuming no change by the end of the year in rt or gt, less the expected return as at date t) is first isolated. It follows from equation (1) that the prospective dividend yield remains the same from one year to the next, so that

and with gt + 1 = gt,

where Gt + 1 is the actual nominal dividend growth rate for the year ending at date t + 1. Thus, to maintain the same yield at t + 1 as at t, the following must hold:

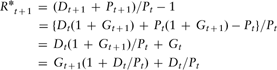
So the actual equity return with rt and gt fixed,  , is
of which the expected return from re-arranging (1) is given by

and the effect on return of unexpected dividend growth during the year starting at date t, R(ΔD)t + 1, is given by

Return due to changes in expected return or expected dividend growth
Consider now the return that is due to a change in rt or gt. Re-arranging (1) again,

So a change in rt or gt, implies a change in yield, and the change in yield can be written as:

From (2), the price at t + 1 with no change in yield must be Pt(1 + Gt + 1). So the return due to a change in yield, or in rt or gt, R{Δ[(r−g)/(1 + g)]}t + 1, can be written as

It follows that (see Appendix 1 for proof):

The return due to a change in rt or gt can also be analysed as the sum of the returns due to changes in the components of rt and gt. Thus,

and

where rFr,t is the expected real interest rate, it is the expected rate of inflation, θt is the inflation risk premium, πt is the expected (equity) risk premium, and gr,t is the expected real growth rate of dividends. The approximate, additive, formula for nominal rates is used for simplicity. Thus,

Using (5), (6) and (8) to express the return due to a change in rt or gt as the sum of the returns due to changes in the components of rt and gt:

The return due to a change in rFr,t, R(ΔrFr)t, for example, can be derived by taking (6) as the starting point. The D/P terms in (6) can be re-expressed in terms of r and g, using (5). Since rFr,t is a component of rt, as shown in (7), it then follows that

The other expressions on the right-hand side of (9) are defined analogously.
Risk premium
All the variables are estimated directly except the expected risk premium, πt. This is calculated as the residual expected return:

rt is estimated via the re-arranged dividend-growth formula in (1), and rF,t is proxied by the yield on undated government bonds. Our methods of estimating rFr,t, it and θt, explained below, ensure that these components sum to give rF,t. Because πt is calculated as the residual expected return, decomposition of the return for a given year is exact: the component returns on the right hand side of (9), which include R(Δπ)t, sum exactly to give the return due to a change in dividend yield in (6), and therefore

Note that a change in the expected rate of inflation, it, does not affect the notional return on equity due to a change in rt or gt. This is because it is included additively in both rt and gt, and therefore cancels out (see equation (8)). The inflation risk premium, however, is a component of the discount rate but not of the expected rate of dividend growth, and so a change in its value affects the notional return for the relevant year. Another point to notice is that the absolute size of the return arising from a given percentage change in one of the variables is negatively related to the dividend yield at date t + 1. That is, the impact on return of a given percentage change in one of the variables is greater when the yield is low.Footnote 4
2.2 Bonds
The return on bonds can be decomposed in a similar manner. The yield on 2.5% consols (undated government bonds) is used as a proxy for rF,t. With undated bonds, the price is given by

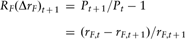
where Y is the annual interest payment, which is fixed in nominal terms. A change in price is caused by a change in the discount rate. It follows from (11) that the return due to a change in the discount rate, RF(ΔrF)t + 1, is given by
The return due to a change in the discount rate can be decomposed as follows:

where RF(ΔrFr)t + 1 = (rFr,t−rFr,t + 1)/rF,t + 1, and analagously for RF(Δi)t + 1 and RF(Δθ)t + 1.
3. Estimation of expected dividend growth rates and real interest rates in the past
UK data are used and the sample period is 1921–2008. Requisite data are available for 1900 onwards, but 1921 is used as the starting point to avoid the period during and shortly after the 1914–18 war, when dividends were extremely volatile, and to ensure that we have at least 15 years of past dividend growth. The data are mostly from the Equity-Gilt Study, produced annually by Barclays Capital, and from Datastream. Details of the data sources and of the returns calculations are shown in Table 1. The forecasts and their volatilities are intended to be plausible and easy to understand.
Data sources and calculation of returns.

1The formula is Gt = [(YtIt)/(Yt −1It −1)−1] where It is the share price index at time t.
Expected real dividend growth rate
A number of variables and combinations of variables were assembled and analysed for their ability to reflect long-term real growth expectations, utilising the fact that a negative correlation between the equity market yield and such expectations should be anticipated. The following proved to be statistically the most significant:

where  is the geometric mean real growth rate of dividends during the 25-year period that starts at date t–15 and ends at date t + 10.Footnote 5 The real growth for a single year is

where Gt is the percentage growth in dividends for year t and It is inflation. The estimate in (13) is a moving average measured over a long period, and so it is normally slow-moving. The combination of 15 years of past growth data, known as at date t, and ten years of forward data, unknown at date t, is meant to capture the idea that investors base their expectations primarily on observed growth in recent years, but with some ability to adjust for changing economic circumstances. The estimates of gr,t in Arnott & Bernstein (Reference Arnott and Bernstein2002) and Ilmanen (Reference Ilmanen2003) are also moving averages. Repurchases and other cash payments to shareholders are ignored.Footnote 6
The above method results in estimates of negative expected real growth for several years in the 1920s, 1940s and 1970s. An expectation of negative real growth indefinitely is thought to be implausible, and an expected real growth rate of 0% pa is therefore set as a minimum. The estimates are below 3.0% pa except for one outlier of 4.3% pa in 1935. This estimate is capped at 3.0% pa. These constraints reduce the variation in gr,t, which reduces the variation in returns that can be ‘explained’ by changes in this variable. The estimates used are shown in figure 1. The mean of gr,t is 0.99%, the standard deviation is 0.81%, and the mean of the absolute values of the changes is 0.32%.
Estimate of expected real dividend growth rate, 1921–2008 (% pa)

Expected real interest rate
For the period 1982–2008, the expected real rate of interest, rFr,t, is given by the yield on 20-year index-linked government bonds, which were introduced in 1981. The index-linked yield provides a good estimate of the expected long-term real interest rate at a given date, although the market was somewhat illiquid in its early years.
The expected rate of inflation, it, is estimated for 1982–2008 as follows. The inflation gap, zt, is calculated as:

The expected rate of inflation is given by zt−θt. The inflation risk premium θt is estimated as 0.2zt. This assumes that there is a positive relation between the inflation risk premium and expected inflation, and there is evidence that such a relation exists (Breedon & Chadha, Reference Breedon and Chadha2003). Evidence to justify an inflation risk premium of up to 20% of the inflation gap is in Shen (Reference Shen1998) and Garcia & Werner (Reference Garcia and Werner2010). The expected rate of inflation in the period 1982–2008 is then given by:

Calculations with no inflation risk premium are also carried out.
For the period 1921–81, expected inflation is estimated from the yield on 2.5% consols. A regression of the yield Yt on future inflation shows that the yield provides quite a good forecast, at least for inflation during the subsequent decade:


where  is the geometric mean rate of inflation for the ten years between t = 0 and t + 10 and the numbers are OLS regression coefficients with t-statistics in brackets beneath. The R 2 is 0.30.
The expected real interest rate for the period 1921–81 is then given by:

where rF,t is the prevailing yield on 2.5% Consols, as above, and zt is taken to be it/0.8, as for the period 1982–2008.
The estimates of the expected real interest rate are shown in figure 2. The rate varies between 0.2% and 4.4% pa. As this seems a reasonable range within which the expected rate could vary, no adjustments are made. The mean of rr,t is 1.56%, the standard deviation is 1.26%, and the mean of the absolute values of the changes is 0.19%. If it is accepted that the yield on index-linked gilts provides a fairly precise estimate of the expected real interest rate at a given time, the evidence from the index-linked market shows that the expected real rate does vary year-by-year. In fact the mean of the absolute values of the changes is 0.30% for 1982–08 from the index-linked market, compared with 0.15% for 1921–81 from the alternative estimates.
Estimate of expected real interest rate, 1921–2008 (% pa)

4. Results
This section presents the analysis for the period 1921–2008, first with an inferred (variable) expected risk premium and then with a fixed expected risk premium. Simulated volatilities under a range of alternative assumptions are then calculated. In particular, estimates of standard deviations of the main real variables are altered. Implications for the standard deviation of fixed-premium returns are assessed, and comparisons made with the standard deviation of actual returns.
4.1 Results with variable expected risk premium
Table 2 shows the results for the case in which the expected risk premium is inferred and varies from year to year, as described above. The results regarding the risk premium are first briefly discussed. The arithmetic mean expected risk premium for 1921–2008 is 3.3%, whereas the ex post risk premium is 4.9%. Taking the 50 years 1950–99, the mean expected risk premium is 3.0%, compared with an ex post risk premium of 9.1% (not shown in the table). Thus the results agree with those of other UK and US studies, cited in the introduction, that estimate the expected risk premium in the past and find that the historic risk premium in the second half of the twentieth century provides an upwardly biased estimate of the expected risk premium.
Results with inferred (variable) expected risk premium.

The returns and risk premia are arithmetic means of annual returns and risk premia for the period 1921–2008. The formulae are explained in section 2.2. The expected return for a year ending at date t is a return expected one year earlier, at date t–1.
The difference of 1.7 percentage points between the ex post (actual) and expected risk premium for 1921–2008 is explained by an actual mean return on equity that is 2.9 percentage points higher than the expected return, partly offset by a return of 1.2% due to change in yield (rF,t). According to the decomposition in this paper, the reasons for the higher-than-expected ex post risk premium are changes in the expected equity premium (+1.2 percentage point contribution to the ex post premium, so the expected premium tended to decline), and unexpected dividend growth (+1.0 point). These factors that increased the ex post premium are partly offset by changes in expected inflation that increased the return on bonds (−0.4 point contribution to the risk premium). The inference of a declining expected risk premium echoes that of previous studies, especially Fama & French (Reference Fama and French2002). But unexpectedly high dividend growth is an important contributor to the unexpectedly high ex post risk premium.
Turning to the results relating to volatility, the expected risk premium for each year has a mean of 3.3% and a standard deviation of 1.8%; the mean of the absolute values of the changes is 0.8%. So it exhibits substantial variation over time. The standard deviation of the returns due to changes in the expected risk premium is 22.7%, which is close to the standard deviation of 23.9% for the actual returns. However, the changes in the expected risk premium contribute nothing to the volatility of the observed returns, because they often dampen down the return that would have arisen had the risk premium not changed. One way of showing this is in figure 3. There are two bars for each year. The first bar is the actual return on equity less the return arising from the change in the expected risk premium: Rt−R(Δπ)t. This difference is the return for the year that would have arisen, had the expected risk premium not changed from its value in the previous year (it is not the same as the return assuming a constant expected risk premium every year). The second bar shows the return that is ascribed to the change in the expected risk premium, R(Δπ)t. The two returns (bars) combined give the actual return, Rt. For clarity, figure 3 shows these results for 1960–2008 only.
Actual equity return less return due to change in expected risk premium (first bar), and return due to change in expected risk premium (second bar) (%), 1960–2008

Figure 3 shows that for the majority of years (61% during 1960–2008; 65% during the full sample period), the return due to a change in the expected risk premium has the opposite sign from the return due to the other variables. Consistent with the visual impression, the correlation coefficient for the series Rt−R(Δπ)t and R(Δπ)t is −0.32. During the four years 1995–98, for example, the equity returns would have been even higher had the expected risk premium not been rising. The major exceptions are the extreme years of 1974 and 1975, when the returns due to changes in the expected risk premia greatly augmented the returns ascribed to other factors.
The reader might feel that a mean of the absolute changes in the inferred risk premium of 0.8% implies implausibly large jumps from one year to the next. The consensus in other research is that, while the expected risk premium probably does change over time, it does so gradually. However, estimates of the changes in expected risk premia in this paper should not be taken too literally. Δπt is calculated as a residual: it is the change in the expected equity return (discount rate) that must have arisen given the actual equity return for the year starting at date t, and given the changes in the other variables that determine the notional return with no change in the risk premium. One possible explanation for the variation in the expected risk premium is that the estimates of rr,t and gr,t are not variable enough: investor expectations regarding these variables change through time by more than have been estimated, causing the inferred risk premium to overstate the actual changes in the expected risk premium. For example, during the extreme year of 1975, the expected risk premium falls from 6.5% at the start of 1975 to 0.6% at the start of 1976. The estimated real interest rate falls from 3.7% to 3.0%. There is no change in the estimated forecast real dividend growth rate, which is zero for both years. The actual risk premium for 1975 is +111.0%, most of which is ‘explained’ by a fall in the expected risk premium. But if the actual fall in the expected real interest rate was greater, or if investors became more optimistic about real dividend growth during 1975, the estimated change in the expected risk premium is exaggerated.
Alternatively, for some years the return ascribed to a change in the expected risk premium could be viewed as having an irrational component, and the apparent changes in the expected risk premium would then be seen as a symptom of irrational pricing, as discussed in the introduction. Whatever the interpretation of the changes in the expected risk premium, the observed volatility for the sample period can be explained without assuming that there were changes in the expected risk premium. This is now shown more directly.
4.2 Results with fixed expected risk premium
This section presents the volatility that would have arisen had the expected risk premium been fixed. The expected risk premium is set at 3.3% every year, which is the arithmetic mean over the sample period that has already been inferred. The values of rFr,t, it, θt and gr,t are unchanged. Using a similar approach to that in section 2.1, the simulated expected return with a fixed premium, Simrt, and the return due to unexpected dividend growth, R(SimΔD)t + 1, are calculated as follows:


where the simulated dividend yield is given by

Note that equations (15), (16) and (17) are similar in form to equations (3), (4) and (5).
The simulated return due to a change in Simrt or gt is given by:

where

and SimR(Δθ)t + 1 and SimR(Δgr)t + 1 are defined analogously. Although the expected risk premium is fixed at 3.3%, so there is no return due to a change in the risk premium, a small balancing term is needed, defined as

The total simulated return is the sum of (15), (16) and (18):

The results are shown in Table 3. The key finding is that the simulated returns with the expected risk premium fixed at 3.3% are at least as volatile as the actual returns.Footnote 7 The standard deviation of the fixed-premium returns is 28.1%, compared with the standard deviation of the actual returns of 23.9%. The standard deviation of the fixed-premium returns would have to be below 16.5% for the fixed-premium returns to be significantly less volatile than the actual returns at the 1% level, using a one-tailed F-test on the ratio of the variances. Table 3 also shows that changes in gr,t are the most important cause of variation in the fixed-premium returns in the full sample.
Results with expected risk premium fixed at 3.3%.

The returns are arithmetic means of annual returns for the period 1921–2008. The equity returns are simulated using a fixed expected risk premium of 3.3% and the returns implied by the actual values of the other variables that affect equity value. The balancing term arises because of the use of a fixed expected premium, and is defined in section 4.2.
The period 1982–2008 is examined separately (although the results are not reported in detail). Estimates of the expected real interest rate are more reliable for this period, and the expected real dividend growth rate is less variable than in earlier years; the mean of the absolute values of Δgr,t is 0.24 for 1982–2008, compared with 0.35 for 1921–81. The average expected risk premium for 1982–2008 is 1.6%, so 1.6% is the fixed risk premium used to calculate the fixed-premium returns. The standard deviation of the actual returns on equity during 1982–2008 is 17.0%; the standard deviation of the fixed-premium returns is 21.0%. So, as for the full sample, the fixed-premium returns are at least as volatile as the actual returns. For 1982–2008 changes in the expected real interest rate are the most important source of variation in the fixed-premium returns.
The fixed-premium returns are related to the actual returns. In 70% of the years in the full sample the two returns have the same sign, and the correlation coefficient for the two series is 0.24 (t = 2.25). These results indicate that the fundamentals that are supposed to affect value in the fixed-premium dividend-discount model do have significant explanatory power. Figure 4 shows the two returns for each year, for 1960–2008.
Actual equity return (first bar) and simulated return with expected risk premium fixed at 3.3% (second bar) (%), 1960–2008

4.3 Simulated volatilities under alternative assumptions
First assume that there is no inflation risk premium. This assumption is made in a number of previous studies such as Blanchard (Reference Blanchard1993) and Ilmanen (Reference Ilmanen2003). For 1921–81, the expected real interest rate is estimated by subtracting the estimate of expected inflation, with no added premium, from the consols yield. For 1982–2008 it is assumed that the entire inflation gap measured via equation (14) represents expected inflation. These adjustments result in a standard deviation of the fixed-premium returns of 22.9%, less than the 28.1% of the base-case fixed-premium returns, but little different from the standard deviation of the actual returns of 23.9%.
An advantage of the analysis in this paper is that the forecasts that determine the predicted changes in equity values are explicit. For predicted volatility of fixed-premium returns to be less than actual volatility, the estimated values of rFr,t and gr,t would have to be less variable than they are in figures 1 and 2. Table 4 shows the volatilities of the fixed-premium returns, with an inflation risk premium, under various assumptions about the volatilities of rFr,t and gr,t. It shows directly how changing the volatilities of the price-determining variables changes the volatility of the resulting notional market returns. Each cell reports the standard deviation of the fixed-premium returns resulting from applying differing values of x in the following formula

where  is the adjusted change in the expected real interest rate for year t used to calculate the fixed-premium returns, av(rFr,t) is the arithmetic mean of rFr,t for the sample period, and a value for x is selected between 1.0 and 0.0. x = 1 means that the year-by-year changes in rFr,t are unaltered; x = 0 means that there is no variation in rFr,t. The same formula is used to vary the volatility of gr,t. The formula results in smaller year-by-year changes in the relevant variable, while preserving its mean value.
Volatilities of simulated fixed-premium equity returns under forecasts of differing variability.

The table shows standard deviations of simulated fixed-premium equity returns, estimated under a range of assumptions about the volatilities of the expected real interest rate, rFr,t, and the expected real growth rate of dividends, gr,t. The assumed changes in rFr,t,  , are calculated from the formula
 , where av(rFr,t) is the arithmetic mean value of rFr,t during the sample period, and x is set at a value between 1 and 0 for each case. The same applies for gr,t. The values of the two variables with x = 1 for each is the base case, reported in detail in Table 3. The values with x = 0 is the case with constant dividend yield.
Table 4 shows the combinations of adjustments needed for the standard deviation of the fixed-premium returns to be less than 16.5%, i.e. significantly less than the standard deviation of the actual returns. For example, if the volatility of gr,t were 0.8 times its actual level, the volatility of rFr,t would need to drop to 0.4 times its actual level for the fixed-premium volatility to fall below 16.5%. If both gr,t and rFr,t were constant, the fixed-premium volatility would be 8.9%. This is the volatility of the returns with a constant yield, most of which is volatility attributed to ‘unexpected’ year-by-year changes in actual dividends paid (see equation 4). Table 4 also shows that the fixed-premium volatility is more sensitive to the volatility of gr,t than of rFr,t. This arises because the year-by-year changes are larger for gr,t than for rFr,t in the full sample. Of course, if the base-case variation in gr,t or rFr,t were felt to be too low, x in equation (20) would exceed one and the fixed-premium volatility would be higher than in the base case.
5. Conclusion
The paper presents a transparent analysis of the impact on fundamental values of year-by-year changes in estimates of the expected real interest rate and the expected real growth rate of dividends. An important application of the analysis is that it helps the reader to appreciate the relationships between the volatility of price-determining variables and the volatility of fundamental values. It is possible to see how variable over time the expected real interest rate and real dividend growth rate need to be in order for the observed market volatility to be justified. It is impossible to gain an understanding of this from previous research, which employs the Campbell-Shiller logarithmic version of the dividend-growth model combined with forecasts of the real interest rate and real dividend growth rate derived from vector autoregression. Risk premia expected in the past can also be inferred, using our analysis.
Estimates of forecasts for rr,t and gr,t in the past are believed to be reasonable. They are derived from simple methods, of the type used by authors who have inferred the risk premium expected in the past. The average of the estimated expected risk premium during the sample period is 3.3%, which is in line with the estimates in previous studies. Changes in expected real interest rate forecasts and expected dividend growth rate forecasts are sufficient to explain the observed volatility of the UK stock market during 1921–2008. This is the case whether the expected risk premium is allowed to vary, or whether market returns which would have arisen had the expected risk premium been fixed are estimated. Readers can, literally, see what the forecasts look like (figures 1 and 2) that produce the results, and judge for themselves whether the forecasts are too volatile. The standard deviation of both the forecasts of rr,t and of gr,t would have to drop by about one-third for the notional market volatility with a fixed-risk premium to be the same as actual market volatility (table 4).
Any forecasting method that produces year-by-year variation in gr,t and rFr,t that is similar to the variation in the estimates in this paper is likely to give similar results regarding volatility. For example, a study that has similar implications regarding volatility is Blanchard (Reference Blanchard1993). His estimates of rFr,t and gr,t appear to fluctuate year-by-year at least as much, although the range of Blanchard's estimates is somewhat greater for the expected real interest rate, and somewhat less for the expected real growth rate. In the light of our UK results in this paper, it is almost certain that Blanchard's estimates of rFr,t and gr,t would be more than sufficient to explain the observed US market volatility.
Using the analysis in this paper, readers can readily calculate the expected risk premium, or the notional volatility of market returns, by inserting their own year-by-year forecasts of rr,t and gr,t.
Appendix 1: Proof of Equation (6)



