Social isolation is considered a condition where a person’s degree of involvement in social life is significantly reduced and s/he experiences a complete or nearly-complete lack of contact with the society. Social networks greatly influence the behavior and attitude of a person. The abundance of resources and relationships in social networks determine the restraints on one’s behavior as well as one’s approach to opportunities. Steptoe et al. (Reference Steptoe, Shankar, Demakakos and Wardle2013) defined loneliness as an individual’s dissatisfaction with the quality and quantity of his/her social relations and connections. Social isolation, on the other hand, was described as a subjective experience or a feeling of insufficient social integration and an absence of social support, which may have significant influences on one’s wellbeing. The concepts of social isolation and loneliness resemble so much that it becomes difficult to differentiate between them. Social isolation refers to the situation where a person avoids having and rearing relationships. It differs from loneliness, which reflects a temporary and involuntary lack of contact with other humans in the world. Loneliness is a subjective condition, where an individual experiences feeling that are negative, which tend to be the product of social isolation (O’Luanaigh et al., Reference O’Luanaigh, O'Connell, Chin, Hamilton, Coen, Walsh, Walsh, Caokley, Cunningham and Lawlor2011). Social isolation could be measured objectively by considering the depth and extent of a person's social circle or social network, i.e., the structure of relationships or how a person is linked within a particular group of individuals.
Older adults constitute a population that is much more vulnerable to the feeling of social isolation. The world as a whole, and industrialized countries, in particular, are moving through a demographic transition to ‘greyer’ societies, a process involving slower population growth and hence a more sustainable global population. A substantial increase in the relative and an absolute number of old persons in the world poses a challenge to fulfill the needs of old adults in areas of biology, social and behavioral science, and medicine (Healy et al., Reference Healy, Clark, Winkler, Gardiner, Brown and Matthews2011). The population of older adults is continuously increasing because of better health and medical facilities and the reduced birth rate. 11% of the world’s population comprises individuals with the age of ≥ 60 years. According to systematic estimation, the number of aged people will be increased to 22% approximately, by 2050. This alarming increase in social issues of older adults has caught the attention of researchers towards concerns like elder abuse and isolation, and studies are being conducted to explore the ways of lessening isolation, minimizing negative emotions, and making those individuals successful agers (Fiske et al., Reference Fiske, Wetherell and Gatz2009). In Pakistani culture, employees in public and private sectors are officially retired from their occupational responsibilities at the age of 60; therefore, years of age serve a reasonable benchmark to differentiate between late adulthood and old age.
Social relationships play a fundamental role in the physical and psychological wellbeing of human beings. Low social contacts may decrease both the physical and mental wellbeing of older adults. Low mobility, reduced economic resources, passing away of colleagues, age fellows and associates are common issues faced by older adults that collectively limit their social connections. Less number of links, lack of companionship, and minimum engagement in social gatherings make them isolated from society (Barth et al., Reference Barth, Schneider and Känel2010).
A nationwide study conducted in Australia reported that primarily focused on older adults concluded that nearly 7% of the population that was above the age of 65 years responded to be severely isolated especially by those who resided alone or are experiencing poor health conditions (Steed et al., Reference Steed, Boldy, Grenade and Iredell2007).
Victor and Bowling’s (Reference Victor and Bowling2012) longitudinal study on an American sample of 999 participants, over the age of 65 years, reported that 9% of older adults experienced severe isolation and 30% of them went through the feelings of loneliness at times. The participants, when followed up after eight years, reported the same prevalence rates. Lui et al. (Reference Lui, Everingham, Warburton, Cuthill and Bartlett2009) reported similar findings of a longitudinal study in the United Kingdom and indicated that 7–8% of older adults felt socially isolated at a time. However, these estimates were predicted to be increased and doubled until 2040. According to research, in the United Kingdom, 180,000 older adults reported that they had not gone to see their friends, neighbors, or other social relations they had, throughout an entire week. It was also concluded that about a million older adults reported staying alone over the festivals like Christmas Day. Other researchers of the United Kingdom reported that about 12% of the population of older adults feel themselves being restricted to their home (Jack, Reference Jack2011).
Pakistan is now categorized as the sixth largest population of the world that is facing aging issues like other nations of the world. Results of a study conducted in different urban areas of Pakistan showed that 88.3% of older adults reported feelings of loneliness. The findings also revealed that the majority of older people who feel loneliness reported different diseases like cardiovascular diseases, diabetes, hypertension, and asthma, etc. (Ahmed et al., Reference Ahmed, Chaudhry, Afzal and Farooq2015).
The insufficiency of the data available for constructs like social isolation and loneliness makes them difficult to measure. Most of the instruments measuring social isolation are lengthy and measure multiple constructs, for instance, Inventory of Socially Supportive Behaviors (Barrera et al., Reference Barrera, Sandler, I and Ramsay1981) is a large inventory comprising of 52 items. Social Connectedness Scale (Lee & Robbins, Reference Lee and Robbins1995) consists of 44 items out of which eight items are negatively scored that may confuse respondents. A few scales used for measuring social isolation are embedded in other instruments e.g., World Health Organization Quality of Life–100 (WHOQOL-100) (The Whoqol Group, 1998) is a 100-item measure that covers six domains (physical, psychological, levels of independence, social relationships, environment, and spirituality) in which quality of social relations is measured by 6 items. Therefore, a brief, precise, and psychometrically sound measure of isolation was needed, and the Friendship Scale (Hawthorne, Reference Hawthorne2006) fulfilled this gap in the existing literature.
The Friendship Scale is a short, 6-item, self-report scale that assesses social isolation on a 5–point Likert scale. The Friendship Scale is preferred to the other measures of isolation because (a) despite its brevity, it covers the major key dimensions of isolation, (b) it is parsimonious and it could be easily incorporated into studies with large instrument batteries, (c) it is self-reported owing to which it is suitable for inclusion in survey instrument batteries, (d) it is user-friendly and easily understandable, which reduces respondents’ resistance, (e) it includes both positive and negative items to avoid acquiescent response bias, (f) item stems are as short as possible, (g) Likert-type response format enabled individuals to get stable estimates of their feelings, thoughts, and experiences in the past 4 weeks.
Social Isolation and Identity Processing
The identity process theory is the latest framework and focuses on cognitive aging models. Its theoretical grounds are based on Erikson’s psychosocial theory and Piaget’s theory of cognitive development. According to this theory, the individual keeps up a dynamic and active equilibrium between the experiences and self through the Piagetian procedures of identity accommodation, identity assimilation, and identity balance. Among these three identity processing styles, identity assimilation is more pertinent to the sample of the present study as Kirk (Reference Kirk2015) observed that identity assimilation becomes more prevalent in older adults. Therefore, identity assimilation was deemed to be the most relevant identity processing style in the present study.
Identity assimilation is attributed to the maintenance of self-affirmation where an individual indulges oneself in preserving self-explanatory schemas. Identity assimilation helps maintain self-consistency by preserving self-defining processes. This process is adapted and utilized often by an individual to secure and hold on to one's self-concept and image, even in the contradicting and dissonant situations or comments regarding self. Individuals who adopt this identity processing style are likely to have rigid and fixed schemas and reject the information that is inconsistent with their already existing ideas (Sneed & Whitbourne, Reference Sneed and Whitbourne2005).
Individuals with a high level of identity assimilation had been assumed to have huge egos because they keep on improving their self-enhancement. According to the previous theoretical history, assimilators don’t approve or consider changes related to their aging because they desire to retain their younger identity. Most of the time, they continue to be engaged in their previous physical and psychological activities that make them more active members of the society by ignoring the inevitable and natural signs and symptoms of physical aging, but in this way, they sometimes harm themselves by indulging in those activities that are not appropriate for their age. Both advantages and disadvantages are related to being an assimilator. On one side, assimilators have an optimistic view of life, they take delight in their accomplishments, and they generally perceive themselves as wholesome. On the opposite, overuse can result in exhaustion and disappointment (Whitbourne & Sneed, Reference Whitbourne and Sneed2004). Therefore, assimilation does not seem to have any definite relationship with isolation.
Identity accommodation is described as a modification in previously built schemas in accordance with the society. The individuals who tend to adopt this process are influenced by new practices and consider their own identities as unclear and doubtful owing to which they are more likely to adapt to the novel experiences. Therefore, this change is the result of a negative assessment of themselves and disapproval from society. However, despite all these modifications in their existing ideas and concepts, they feel isolated from society. Previous studies also showed a positive relationship between accommodation and isolation (Diehl et al., Reference Diehl, Hastings and Stanton2001).
Identity balance is considered the most versatile identity style used by older adults. This style acts as an equalizer between assimilation and accommodation. The older adults who keep a dynamic equilibrium between identity assimilation and accommodation are considered to be wiser, well-adjusted and satisfied with their lives as compared to identity assimilators and identity accommodators. Identity balance users have a tendency to make ideal adjustments to their self-ideas, which grants them to reflect and look at themselves reasonably. The older adults who adopt this style are ready to make modifications in their existing schemas according to the demands of the external world. People who make use of identity-balance scored high on mental wellness, quality of life, and life satisfaction and had a lower score on depression and isolation (Whitbourne & Sneed, Reference Whitbourne and Sneed2004). To sum up, we may conclude that assimilation is not related to isolation whereas identity accommodation seems to have positive and identity balances appear to have negative relationships with social isolation. That is why the present study has only taken identity assimilation style into account for establishing the discriminant validity of the Friendship scale.
Social Isolation and Depression
Depression is one of the most common mental disorders characterized by low mood, lack of interest and joy, reduced energy, feelings of guilt or little self-esteem, deprived sleep or hunger, and reduced attention. The adverse life events of extreme intensity are also observed to induce depression, such as natural disasters, a medical diagnosis of deadly diseases, interpersonal problems in daily life or related to marriage, bullying, or undergoing a severe accident (Malak & Khalifeh, Reference Malak and Khalifeh2018). A study by Dong et al. (Reference Dong, Simon, Odwazny and Gorbien2008) also concluded that depression is a significant risk factor associated with the abuse of older adults and neglect among the Chinese elderly. Ganatra et al. (Reference Ganatra, Zafar, Qidwai and Rozi2008) identified several risk factors for depression among older adults in Pakistan. The results of their study indicated that health problems, financial problems, loneliness, a higher number of daily medications, and inadequately fulfilled spiritual needs were significantly associated with depressive symptoms.
The probability of encountering age-related misfortunes increases as persons grow old. These misfortunes cause hindrance in building and maintaining social relationships, bringing about a higher occurrence of depression and social isolation. Older individuals are likely to report increasing rates of social isolation and depression (Uchino, Reference Uchino2006), which reflect the increased likelihood of mishaps associated with old age. Another study revealed that depression and loneliness are positively related in old age because of experiencing multiple losses (Alpass & Neville, Reference Alpass and Neville2003). Therefore, we hypothesize depression and social isolation will be positively associated.
Loss of Spouse and Isolation
The majority of the literature depicted that the loss of a spouse served as a strong determinant of social isolation. Events like widowhood suggest that bereaved individuals are particularly vulnerable to social isolation. The presence or loss of a life partner or close relationship interacts in different ways with social isolation. The presence of a life partner increased social interaction, and several activities are undertaken as a couple. Isolation occurred as a consequence of the absence of a significant relationship or was a response that accompanied a decreased connection with a loved one (Havens et al., Reference Havens, Hall, Sylvestre and Jivan2004). Findings of another study revealed that adjustment to widowhood is tougher for those individuals who experience warmness and emotional dependence on their partners and who face less amount of conflict in their marital relationship (Carr et al., Reference Carr, House, Kessler, Nesse, Sonnega and Wortman2000). These pieces of evidence lead us to hypothesize that the older adults whose life partners are dead will feel more isolated as compared to their counterparts whose life partners are alive.
The present research comprises of two studies. The study I deals with the translation of the Friendship Scale from the English language to Urdu language and assessment of its psychometric properties. Study II covers the establishment of validity and the tests of measurement invariance of the Friendship Scale across gender.
Study I: Translation and Cross-language Validation of the Friendship Scale
Method
Phase I: Translation of the Scale
This scale is free to use, and formal permission for its translation into the Urdu language was sought from the author. In the first phase, the backward translation procedure was adopted. This procedure was further divided into four steps. The first step was a forward translation, which involved translation from English to the Urdu by following a parallel back-translation procedure. This step was undertaken to create conceptually equivalent translations for the culture of the target language. Three bilingual experts (two assistant professors and one lecturer) who were native speakers of the target language and had fluency in English performed forward translations, emphasizing the conceptual equivalence. During translation, they monitored that the translation and contents associated with semantic features of the original version were maintained.
The second step was the settlement of items for attaining the finest translated items, and the three independent Urdu translated versions (obtained in the first step) were evaluated through a committee approach for assessing the conjectural consistency among items. Three bilingual experts were requested to analyze each item and select one translated version which delivered the best sense of meaning for each item. The committee members made their assessments item-by-item and chose the best translation for each item, which gave us the finalized forward Urdu translation that comprised of best-translated items finalized through the agreement of all bilingual experts.
In the next step, the back translation was performed. This step was planned to determine the theoretical equivalence of the finalized forward translation and the original version of the Friendship Scale. Therefore, three bilingual experts who were unfamiliar with the original version of the scale were approached to translate the Urdu translated version of the Friendship Scale back into English. Thus, three independent English translations of the Urdu translated Friendship Scale were achieved. Finally, the three bilingual expert’s committee (two assistant professors and one lecturer) reviewed and compared the back-translated version of the Friendship Scale with the original version. After the Urdu translation, to ensure the accuracy of the translated scale with the original scale, the final Urdu translated version was sent to the original designer who finally approved the Urdu version.
Phase II: Cross-language Validation
Cross-language validation of the Urdu Friendship Scale was performed by comparing the Urdu translated version with the original English version of the scale on the sample of older adults. The purpose of the cross-language validation is to ensure the structural and empirical equivalence of the Urdu translated version with the original English version.
Sample
The purposive sample of the Study I was recruited from Lahore and Sargodha districts and was comprised of 60 occupationally retired and married older adults with an age of ≥ 60 years (M = 62.07 years, SD = 6.54 years). The sample included 33 men and 27 women; 37 participants were living with their spouses whereas life partners of 23 participants had died. Twenty-one participants belonged to the nuclear family system and 39 participants were living in the joint family system. The sample was randomly categorized into four groups —each group comprised of 15 older adults in test and retest phase.
Instrument
The Friendship Scale (Hawthorne, Reference Hawthorne2006) is a short, 6-item, self-report scale that assesses social isolation. It has demonstrated sound psychometric properties as the concurrent validity of this scale was found to be satisfactory, and its coefficient of internal consistency was also excellent (α = .83; Pedhazur & Schmelkin, Reference Pedhazur and Schmelkin2013). The response format is anchored on a 5-point Likert type rating (almost always = 4 to never = 0), whereas Item 6, 5, and 2 are reverse scored. The scale is scored by summing up the six items and ranges from 0–24. The reliability coefficients for the friendship scale ranged from .70 and .76 for the adult population. In this phase, both the Urdu translated version and the original English version of the Friendship Scale were administered on the sample.
Procedure
This study was designed to assess the validity of the translated versions of the scales which were administrated twice to the four groups of bilingual Pakistani older people in Urdu-Urdu, Urdu-English, English–Urdu and English-English sequence. The tests were administered on the sample in two settings. In the first trial, two groups were given English versions, and two were given Urdu versions of scales. In the second trial, after one week, the same 60 individuals were approached to answer again, but this time, two groups were given similar language version, and the other two groups were given contrary language version. No clear-cut guidelines are available on the most appropriate time interval for the test-test because it depends on the construct being measured, the participants of the study, and the research design. However, an interval of fifteen days is the most common test-retest interval in scientific studies. For older adults, a time interval of fifteen days might become too long owing to the potential issues of their memory and other cognitive systems. Therefore, the present study administered the test twice with an interval of one week. This process was used to identify the point of equivalence or discrepancy between English and Urdu versions of the scale. This empirical equivalence was evaluated by finding the correlations between test and retest phases.
Study II: Validation and Measurement Invariance of the Urdu Friendship Scale
Method
Confirmatory factor analysis was undertaken to confirm the factor structure, and measurement model of the Urdu translated Friendship Scale. In confirmatory factor analysis, measurement hypotheses are tested through examining the estimated parameters, fit indices, and potentially modification indices. For assessing the construct validity of the Friendship Scale, we followed the recommendations of Hair et al. (Reference Hair, Black, Babin and Anderson2010). Convergent validity of the Friendship Scale was measured by assessing the relationship with depression subscale of Depression, Anxiety, and Stress Scale (Lovibond & Lovibond, Reference Lovibond and Lovibond1995). The discriminant validity of the Friendship Scale was also established by finding the relationship between the assimilation subscale of the Identity and Experiences Scale (Whitbourn et al., 2002). For determining the concurrent validity of the Friendship Scale, the mean score of older adults whose spouses had died was compared to that of older adults who were living with their spouses.
Sample
The purposive sample of study II was recruited from Lahore and Sargodha districts and was comprised of 500 occupationally retired and married older adults (average duration of married life = 45.07 years, SD = 9.33) with an age of ≥ 60 years (M = 71.09 years, SD = 7.73 years). The sample included 263 men and 237 women; 256 participants were living with their spouses whereas life partners of 244 participants had died. 113 participants belonged to the nuclear family system and 387 participants were living in the joint family system.
Instrument
The Urdu translated version of the Friendship Scale was used to measure the isolation among the participants. (see Appendix A).
Depression subscale of Anxiety and Stress Scale (Lovibond & Lovibond, Reference Lovibond and Lovibond1995)
The depression subscale of the Urdu version of DASS (Farooqi & Habib, Reference Farooqi and Habib2010) was used in the current study. Respondents were asked to use a 4-point Likert type scale ranging from 0 (did not apply to me at all) to 3 (applied to me very much) to rate the extent to which they experienced each statement over the past week. Internal consistency of DASS was commendable as the Cronbach's alpha ranged from .81 to .91 (Henry & Crawford, Reference Henry and Crawford2005). There are no negatively scored items within the scale.
Assimilation subscale of Identity and Experiences Scale (Whitbourn et al., 2002)
The assimilation subscale of the Urdu version of the Identity and Experiences Scale (Khan & Adil, Reference Khan and Adil2018) was used to measure the assimilation identity processing of older adults. It comprised of 11 items that were measured on a 7-point Likert type scale of 1 = not like me at all to 7 = completely like me. None of the items was reverse scored. The identity assimilation subscale had a good degree of internal consistency (α = .81; Sneed & Whitbourn, Reference Sneed and Whitbourne2003).
Procedure
The older adults were approached personally in their houses and various hospitals. Informed consent was taken from them to fulfill the ethical requirements of the study. Participants were briefly informed about the aim of the research and were given comprehensive guidelines about the response format and the completion of the scales. All participants were humbly requested to identify their feelings openly and honestly. Confidentiality and privacy of their data were ensured, and there was no time restriction for the completion of the scales. The completed questionnaires were personally collected. In the end, all participants were thanked and acknowledged individually for their assistance, cooperation, help, and support. Initially, 610 forms were distributed to collect the data. 550 questionnaires were returned, and 50 questionnaires were excluded from the data due to the random and non-serious responses of the participants. The response rate was .90.
Results
The results of the current study present the psychometric properties, factorial validity, tests of measurement invariance and establishment of the construct validity of the Friendship Scale. The concurrent validity was also measured by comparing the mean score of older adults whose spouses had died with older adults who were living with their spouses.
Cross-language Validation
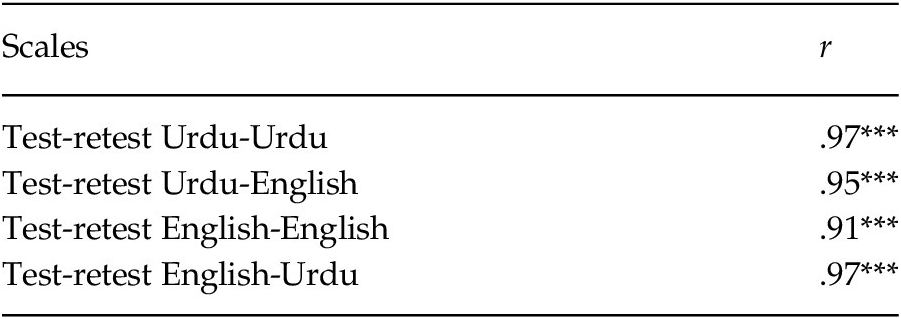
Table 1 depicts the test-retest validation of the English and Urdu versions of the Friendship Scale. The results showed that the values of correlations were very high and positive for all test-retest phases of the Friendship Scale that ensured the empirical equivalence of both versions of the Friendship Scale. All correlations were significant and ranged from .91 to .97.
Correlations between Urdu and English Versions of Friendship Scale (N = 60)

Note. ***p < .001
Factorial Validity of Friendship Scale
CFA was used to confirm the suitability and possibility of the measures for a sample of the study and to confirm the factorial structure of the scale in the Pakistani population. It was also used to ensure whether the constructs have the same structure in Pakistani culture or not. For this purpose, the factor structure of the Friendship Scale was validated through confirmatory factor analysis using AMOS 20. Goodness of Fit Index (GFI), the Normed Fit Index (NFI), the Comparative Fit Index (CFI), the Root Mean Square of Approximation (RMSEA) and the Standardized Root Mean Square Residual (SRMR) were used to test the model fit. The acceptable model fit is indicated by GFI, NFI and CFI > 0.90 and the value of SRMR and RMSEA should be ≤ .08 and ≤ .06, respectively.
The findings of the CFA indicated that the proposed model displayed a very good model fit. The chi-square to df ratio was 0.76, and other indices of model fit also showed an excellent model fit between the model and the data. The values of CFI, NFI, and GFI, were all above .95 and met the criteria of fit indices. The value of RMSEA was .00 with a non-significant p-value (p = .95) with 95 % CI [.001, .05] and the standardized RMR was .01. The factor loading ranged from .48 to .93. The Chi-square test suggested that model demonstrated a good fit to the data (χ2 = 4.5, df = 6, p < .05).
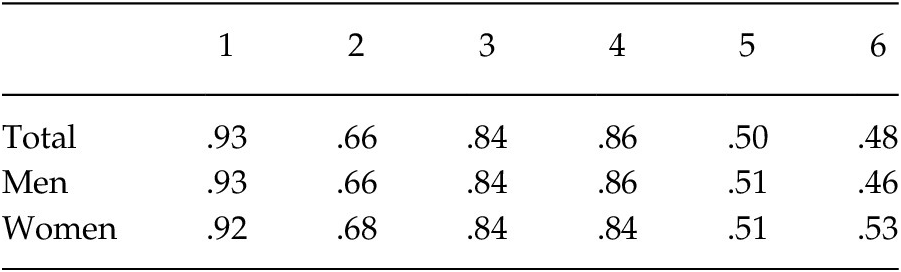
The values in Table 2 show fit indices of the Friendship Scale for the whole sample, the sample of men only, and the sample of women only. The fit indices indicated that the data fitted well to the model in the whole sample as well as its subgroups.
Fit Indices of Measurement Model of Friendship Scale (N = 500)

Note. **p < .01
The values in Table 3 represent the standardized factor loading of all items of the Friendship Scale for the whole sample, the sample of men only, and the sample of women only. The factor loadings of all items on a single latent factor were ≥ .46, which supported the unidimensional structure of the Friendship Scale in the whole sample as well as in the separate groups of men and women.
Standardized Factor Loadings and Fit Indices of Friendship Scale (N = 500)
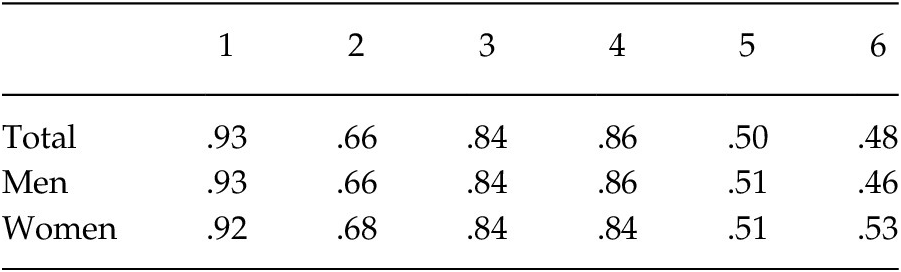
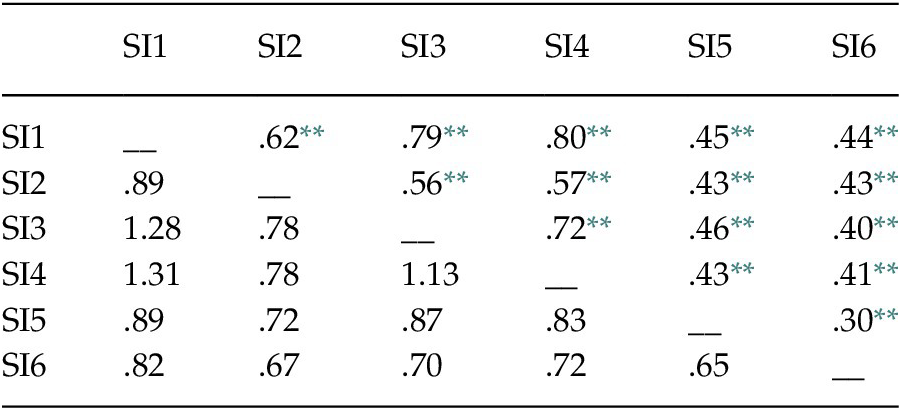
Table 4 displays the correlations and covariance of the Friendship Scale established on the entire sample, and it suggests that all the items were significantly and positively correlated with one another.
Covariance and Correlation Matrices of Urdu Version of Friendship Scale (N= 500)
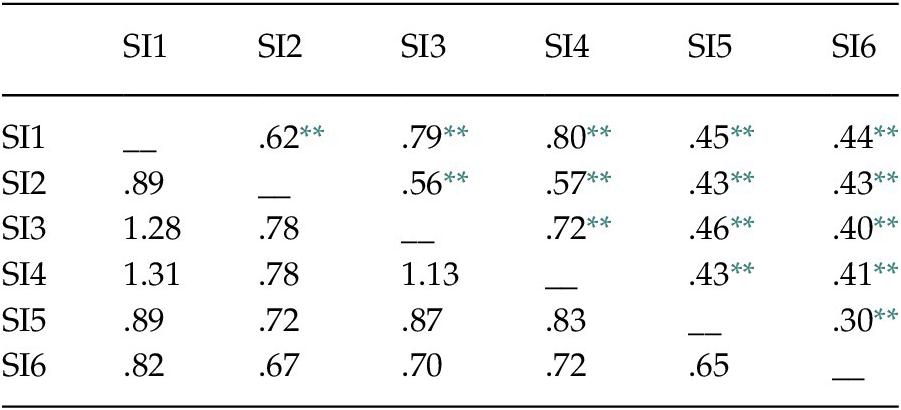
Note. SI = Social Isolation, the covariance matrix is below the diagonal.
** p < .001.
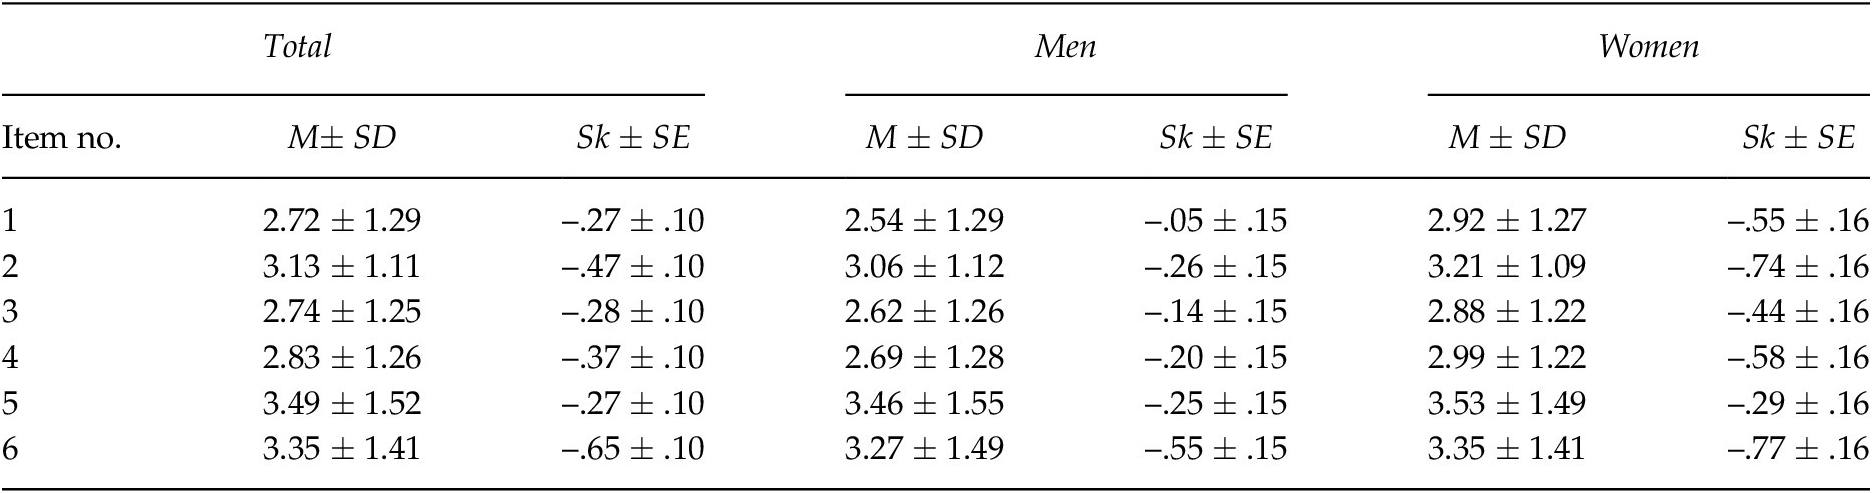
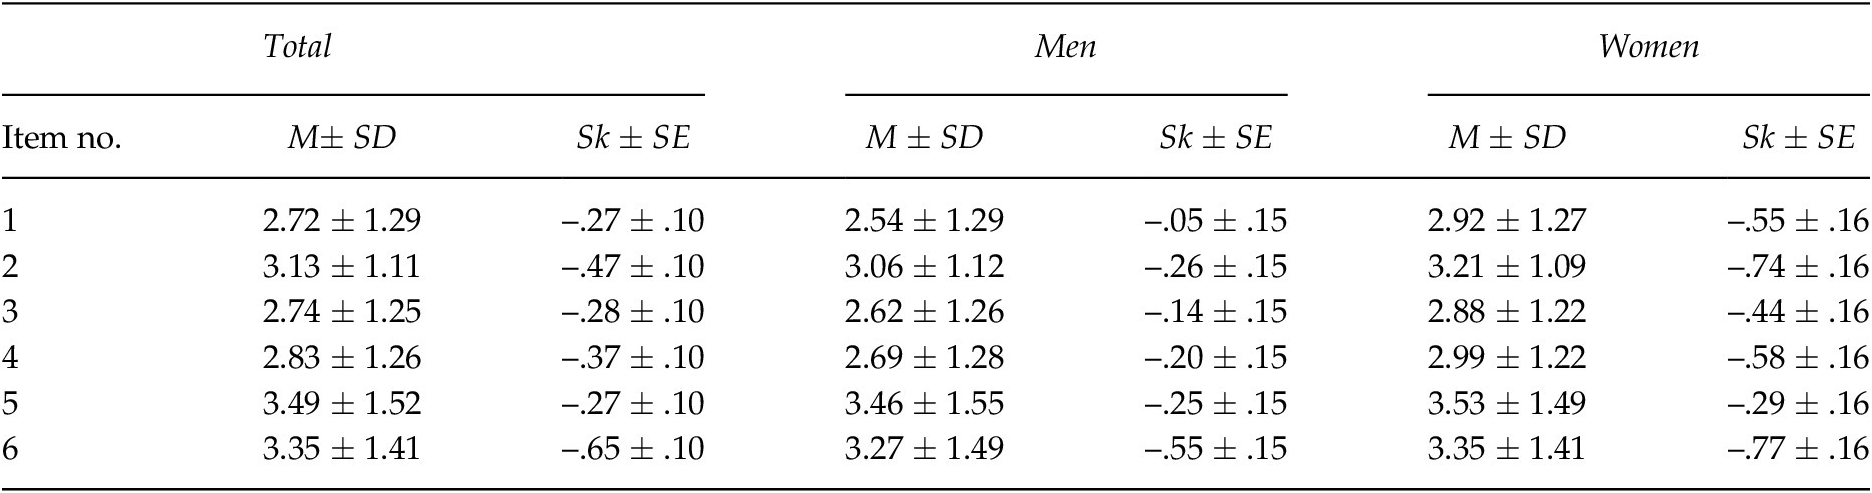
Table 5 displays the descriptive statistics of all items of the Friendship Scale in terms of the entire sample and by gender. Internal consistencies of the scale for the entire sample (α = .86), for the women-sample (α = .87) and the men-sample (α = .85) were quite high. The values of skewness of all items were less than ± 1.96, which indicates that the distribution of the items of the scale is normally distributed.
Descriptive Statistics for Items of Friendship Scale (N = 500)
Measurement Invariance
Table 6 depicts the invariance analysis across gender for the confirmatory factor analysis of the Friendship Scale. The factor structure of the scale was kept the same across both genders for the assessment of configural invariance, i.e., the same factor with the same indicators was specified for both men and women. Results revealed that the data fitted well for both genders, which confirms that the scale was configuraly invariant across the two genders. For the assessment of metric invariance, the factor loadings of the items of the scale were constrained to be equal across men and women. Results showed that the data again fitted well to the model, which provided a strong indication for metric invariance.
Invariance Tests for the Friendship Scale Across Gender (N = 500)

Note. M1 = invariant form model (configural invariance); M2 = invariant loading model (metric invariance); M3 = invariant intercept model (scalar invariance).
Moreover, the comparison of configuraly invariant and metrically invariant models revealed nonsignificant chi-square difference tests and no differences in other measures of fit indices, which indicated that data fitted to both Models 1 and 2 equally well. Finally, the scalar invariance was estimated by constraining the factor loadings as well as the intercepts of the measure to be equal across the two genders. This scalarly invariant model also demonstrated excellent fit to the data. Moreover, the comparison of scalarly invariant models with the configuraly invariant models suggested non-significant chi-square difference tests with no differences in CFI and RMSEA values, which demonstrated full scalar invariance of the Friendship Scale across both genders and revealed that both scalarly invariant models and the configuraly invariant models fitted to the data equally well.
Latent Mean Differences
The women were selected as the reference group, and their latent mean was fixed to zero for estimating the differences in the latent means of men and women on the Friendship Scale. However, the latent mean of the men was estimated. The results revealed that the latent means of men and women did not differ significantly from each other (CR = 1.62, p = .053).
Construct Validity
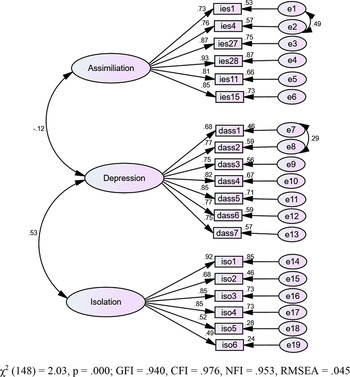
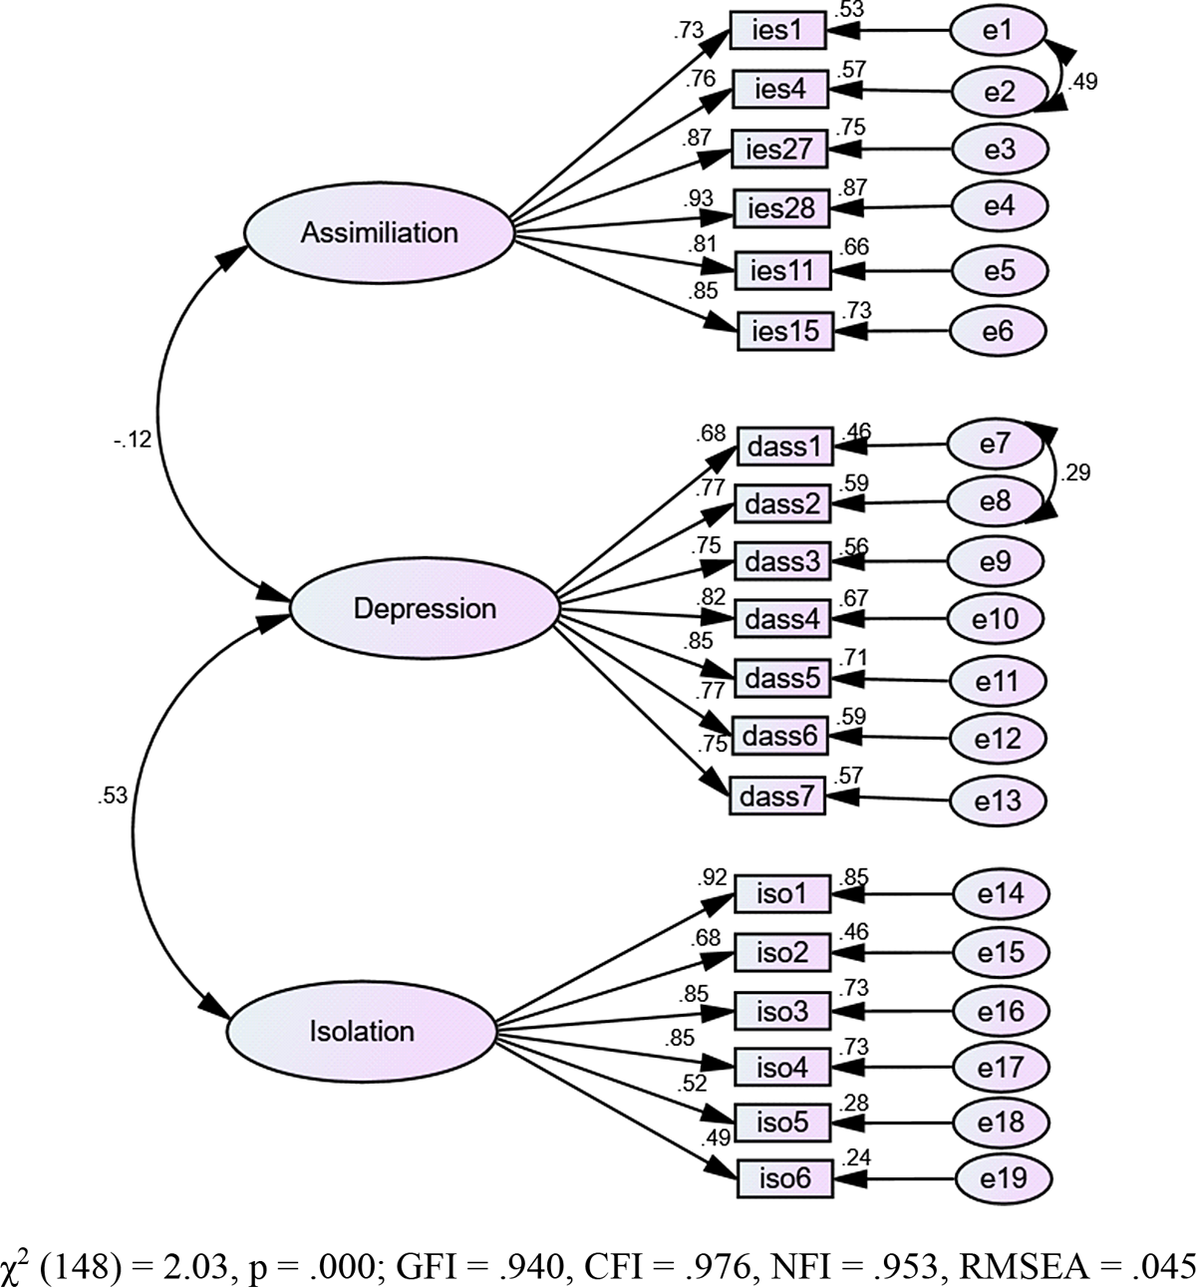
To establish the construct validity of the Friendship Scale, the measurement model of the present study (see Figure 1) was scrutinized in terms of average variance extracted, maximum shared variance, the square root of average variance extracted, and intercorrelations of the latent constructs.
Measurement Model of the Present Study
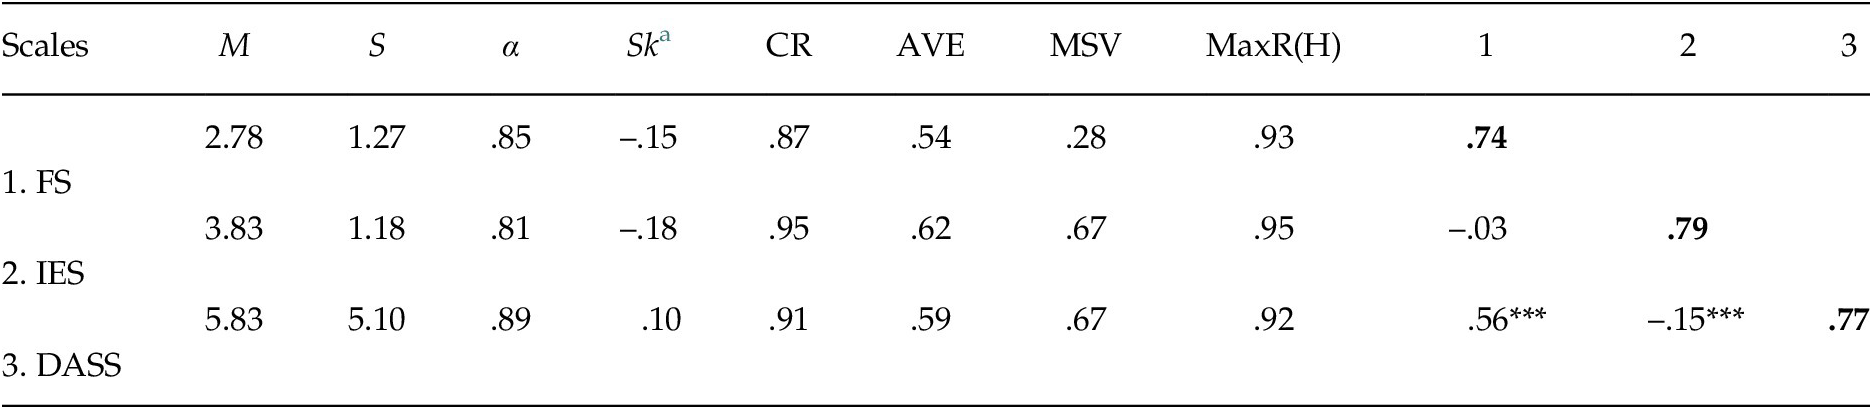
The results depicted in Table 7 suggest that scales used in the present study were highly reliable scales as indicated by composite reliability, McDonald constructs reliability, and alpha coefficients of internal consistency as all three measures were .85 for Friendship Scale, .81 for Identity and Experience Scale and .89 for Depression Anxiety Stress scale respectively. There is no evidence of the restricted range in the scores. The ratio between the values of skewness and its standard error is less than 2 which suggests that the variables were symmetrical in their distribution. To assess the construct validity of the Friendship Scale, we followed the recommendations of Hair et al. (Reference Hair, Black, Babin and Anderson2010). The values of the AVE for the three constructs were .54 for the Friendship Scale, .62 for Identity and Experience Scale and .59 for Depression Anxiety Stress scale respectively, which indicate the convergent validity of the three measures. Moreover, the relationship between the Friendship Scale with the Depression Anxiety and Stress Scale was positive and statistically significant, which provided further evidence for the convergent validity of the Friendship Scale. The discriminant validity of the Friendship Scale was also established by its non-significant relationship with the assimilation subscale of the Identity and Experience Scale. Furthermore, the evidence of discriminant validity was also confirmed by the values of maximum shared variance (MSV), which were less than the values of the average variance extracted (AVE), and the values of the square root of the AVE on the diagonal were greater than the intercorrelations of the constructs.
Descriptive Statistics, Reliability, and Construct Validity of the Friendship Scale (N = 500)
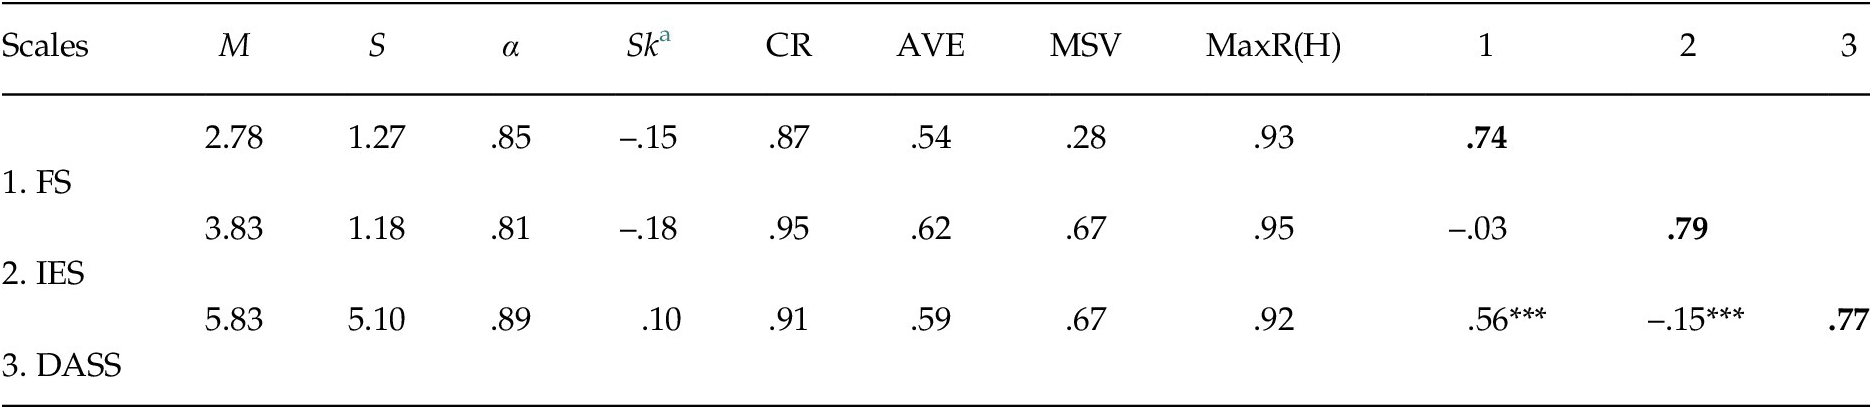
Note. FS = Friendship Scale; IES = Identity and Experience Scale; DASS = Depression Anxiety and Stress Scale; CR = composite reliability; AVE = average variance extracted; MSV = maximum shared variance; MaxR(H) = McDonald construct reliability. The square root of the AVE is shown on the diagonal in bold.
a Standard error of skewness = .11
*** p < .001. ** p < .05.
Concurrent Validity
To establish the concurrent validity of the Friendship Scale, the mean score of older adults whose spouses had died was compared to that of older adults who were living with their spouses. As hypothesized, the older adults whose life partners were dead felt more isolated (M = 2.94, SD = 1.23) as compared to their counterparts whose life partners were alive (M = 2.60, SD = 1.30; t(498) = 2.98, p = .02).
Discussion
Although the Friendship Scale has been used in different cultural contexts in several languages, none of the studies has reported its measurement invariance across the gender. Factor uniformity requires to be statistically confirmed because it is crucial for the comparison and clarification of psychological constructs across the two genders. Vandenberg and Lance's (Reference Vandenberg and Lance2000) guidelines have been followed with different restrictive steps to test the measurement invariance. In the first stage, a test of configural invariance has been conducted to construct a baseline model across both groups. The configural invariance test allowed factor loadings, residuals, and intercepts, to be assessed freely. Establishing a configural invariance test confirms the similarity of the conceptual framework across two different groups. If the data did not provide support for the configural invariance test, the measurement invariance test should be dismissed.
As the factorial structure of the Friendship Scale was fitted well to both men’s and women’s samples, it provided strong empirical support for the configural invariance; therefore, so we could proceed to Stage 2, which involved the assessment of metric invariance. In this model, all factor loadings were restricted to be the same. The metric invariance is considered a weak invariance test whereas the establishment of this test means that varied groups similarly responded to the indicators. The results of the analysis supported the metric invariance of the Friendship Scale since the model with constrained loadings and the model with freely estimated loadings did not significantly differ in terms of their fit to the data.
Stage 3 involved the assessment of the scalar invariance which is followed by factor loading and indicators’ intercepts that were restricted to be the same across both groups. The scalar invariance test is considered a strong invariance test, which suggests that the measurement model has the same scale across the different groups. The results provided strong support for the scalar invariance of the Friendship Scale as the model with constrained factor loadings and intercepts, and the model where these parameters were freely estimated did not significantly differ in terms of their fit to the data. The metric and scalar invariances tests were examined by assessing the change in the χ2, CFI, and RMSEA values. The establishment of this test is required before the latent means can be compared across groups.
The results showed the positive relationship between social isolation and assimilation, which is in accordance with our first hypothesis. Low et al. (Reference Low, Kalfoss and Halvorsrud2015) concluded that despite using the assimilation technique of identity processing, the symptoms of isolation among older adults could not be reduced, which suggests that assimilation identity style and isolation are not related. The results of the correlation between assimilation and depression are negative and significant, which are also in line with our second hypothesis that stated that assimilation and depression are negatively correlated with each other. Sneed and Whitbourne (Reference Sneed and Whitbourne2003) concluded that identity processes styles minimized the depressive symptoms among Norwegian older adults.
Additionally, the Friendship Scale showed the expected positive correlations with depression that confirms the third hypothesis of this research, which suggests an acceptable level of convergent validity. These results are supported by Pinquart and Sorensen (Reference Pinquart and Sörensen2004) who claimed that older adults usually describe depression in terms of isolation they experience in their age.
The results of the t-test showed that older adults whose spouses had died scored higher on isolation as compared to their counterparts who were living with their spouses. These results confirmed our fourth hypothesis and provided evidence for the concurrent validity of the Friendship Scale. Chipperfield and Havens (Reference Chipperfield and Havens2001) also suggested that the loss of a spouse was a strong predictor of isolation among older adults.
The present study was not free of weaknesses. First, this study is conducted only on occupationally retired older adults that limits the generalizability of the study. This study was also based on cross-sectional data; as a result, the changes over time in this construct among the older adults also remained unknown. Second, this study used only self-report measures, and the use of self-report questionnaires might not readily detect genuine emotions and feelings of the significant proportion of older people. The use of longitudinal research design, with a larger and more diverse sample, will enhance the validity of future research. In the current study, the invariance across gender was determined, a similar procedure should be employed to assess invariance across other demographics such as age groups, marital status, family system, the presence/absence of life partner, the source of income and presence of physical or psychological illness.
Besides all these limitations, the results of the study indicated that the Friendship Scale is a reliable and valid instrument for the measurement of isolation across gender. The current research presented the factor invariance of the 6-item version of the Friendship Scale across gender in indigenous culture. Future studies are essential to thoroughly understand the structure and the nature of this construct across different cultures, which may lead to the growth of knowledge by improving the generalizability and application of the Friendship Scale in educational settings as other researchers can use this scale across diverse samples among different cultures.
Old adults are a complete composition of experience, guidance, and wisdom and their insights into the complexities of life could only be capitalized if they are transferred to our younger generations. Unfortunately, the social isolation that the majority of the older adults experience may preclude the effective dissemination of their knowledge and prudence to the new generation. This dissemination of life-long lessons becomes more salient in collectivistic cultures such as those of Pakistan and India, where older adults are part of the joint family system in the form of grandparents. The present study has contributed to the existing literature on the social isolation in the old population by translating a short measure of social isolation into Urdu language and establishing its psychometric properties, which can be used to operationalize social isolation in the Urdu speaking cultures of Pakistan and India. Thus, the Urdu version of the Friendship Scale may open new horizons of empirical investigations of social isolation and its correlates in the older population of the Indian subcontinent.
On the pragmatic side, the findings of the present study could be beneficial for gerontologists and psychologists in many ways. Aging is a critical risk factor for a variety of physical and psychological health issues, and our findings are useful in understanding the psychosocial problems like isolation and the subsequent psychological complications like depression. The most common risk factors of isolation among older adults include mobility issues, functional difficulties, socio-economic dependence, reduced social support, and limited social relationships. Through active coping with these risk factors, the older adults and their families could significantly reduce the chances of social isolation, which in turn may lead to the more functional, happy, and psychologically healthy older population.
Appendix
Urdu Translated Version of the Friendship Scale
ذیل میں کچھ عبارات دی گئی ہیں جن کا تعلق آپ کےاحساسات سے ہے۔ برائے مہربانی ان عبارات کو غور سے پڑھیے اور نیچے دیے گئے پیمانے کو استعمال کرتے
ہوئے بتائیے کہ گزشتہ چار ہفتوں کے دوران آپ نے ایسا کتنی دفعہ محسوس کیا
1۔ تقریباً ہمیشہ 2۔ ذیادہ تر 3۔ نصف اوقات 5۔ کبھی نہیں 4۔ کبھی کبھار