I. INTRODUCTION
Severe plastic deformation (SPD) has been extensively used to enhance thermomechanical properties in bulk materials and surfaces by the grain refinement concomitant with imposition of large plastic strains. SPD methods of equal channel angular pressing (ECAP) and large strain extrusion machining (LSEM) have demonstrated capability to produce ultrafine-grained (UFG) microstructures in many systems including aluminum, copper, magnesium, nickel, steel, tantalum, and titanium alloys. The degree of refinement and the final state of the microstructure in SPD are primarily determined by the interactive effects of underlying deformation variables of strain, strain rate, and temperature. Reference Langdon and Valiev1,Reference Brown, Saldana, Murthy, Mann, Guo, Allard, King, Compton, Trumble and Chandrasekar2 While relationships between controllable ECAP/LSEM process parameters and deformation variables are well established for the case of steady-state deformation fields, the precise conditions that prevail at the initiation of the plastic flow in SPD are not as well understood. Reference Kim3 This stage of deformation represents a condition marked by an evolving deformation field, where strain, strain rate, and temperature vary continuously, affecting the final microstructure and thermomechanical properties of the work material.
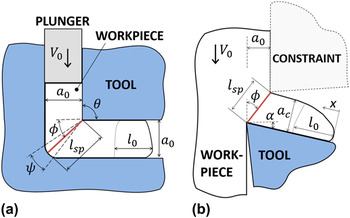
Figure 1(a) shows a typical ECAP configuration, wherein a billet of material is repeatedly passed through a hard die comprised of channels of equivalent cross-section, with billet rotations applied between passes to prescribe the final texture. The number of deformation passes determines the cumulative strain in the extrudate. Figure 1(b) shows an LSEM configuration, wherein a layer of material is removed from the surface of a billet in the form of a chip by a cutting tool. The final chip thickness is controlled by the action of a constraining edge, and the amount of strain imposed in the chip-extrudate is determined by the ratio of the initial (undeformed) and final (deformed) chip thicknesses. While a clear difference between ECAP and LSEM is the multistage nature of the former and the single-stage nature of the latter, the deformation that occurs in both cases is simple shear occurring in a narrow or diffuse zone whose geometry depends on the characteristics of the tooling configuration and work material. Reference Brown, Saldana, Murthy, Mann, Guo, Allard, King, Compton, Trumble and Chandrasekar2,Reference Moscoso4,Reference Segal5 It is instructive to show that the effective strain imposed in the billet in ECAP [Fig. 1(a)] after a single pass is equivalent to that imposed in the chip in LSEM [Fig. 1(b)], where a 0 = a c and α = 0°. Reference Moscoso4,Reference Sevier, Yang, Moscoso and Chandrasekar6 Similarities between ECAP and LSEM have also been shown in resulting microstructures and mechanical properties at equivalent levels of strain. Reference Brown, Saldana, Murthy, Mann, Guo, Allard, King, Compton, Trumble and Chandrasekar2,Reference Saldana, King and Chandrasekar7
(a) ECAP configuration and (b) LSEM configuration. Conventional machining is given by LSEM without the use of a constraint.

For LSEM and ECAP, the deformation field is not fully developed at the initial stages of contact between the die/tool and the workpiece, and a state of transient deformation persists until the deforming material fills the die channels and the resulting strain levels reach the steady state. Reference Kim3,Reference Moscoso4,Reference Sevier, Yang, Moscoso and Chandrasekar6,Reference Stoica, Fielden, McDaniels, Liu, Huang, Liaw, Xu and Langdon8 For ECAP, this transient deformation results in a region of heterogeneous microstructure and properties across the billet end [l 0 in Fig. 1(a)] that has been referred to elsewhere as the less-sheared zone, Reference Jung, Yoon, Jun and Kim9,Reference Yoon, Yoo, Yoon, Kim, Baik and Kim10 the deformation dead zone, Reference Wei, Nagasekhar, Chen, Tick-Hon and Wei11 and the nonuniformly deformed head. Reference Djavanroodi and Ebrahimi12–Reference Basavaraj, Chakkingal and Kumar14 Finite element simulations show that higher friction coefficient and smaller die angles increase the spatial extent of this heterogeneously strained region. Reference Jung, Yoon, Jun and Kim9–Reference Basavaraj, Chakkingal and Kumar14 For both SPD methods, the heterogeneity in microstructure and properties present in these initial regions is undesirable for use of SPD materials in component applications. For ECAP, an oft-used practical approach to mitigate this effect is to crop the billet flat between passes, effectively removing this heterogeneously strained region after every deformation cycle. While this common practice ensures a homogeneous UFG billet for subsequent manufacturing and materials testing, Reference Rosochowski, Olejnik and Richert15–Reference Field, Bradford, Nowell and Lillo17 it also effectively shortens the useable length of the billet stock and thereby has a direct effect on the overall material efficiency of SPD processing methods.
The transient deformation present at the initial stages of contact in ECAP and LSEM is also observed during SPD by chip formation in conventional machining. The deformation in conventional machining is equivalent to that of LSEM (e.g., simple shear) without a constraining edge, as the final chip thickness is instead determined by the intrinsic characteristics of the work material. Reference Moscoso, Shankar, Mann, Compton and Chandrasekar18 The deformation occurring during the initial stages of contact between tool and work in conventional machining has been compared to that which occurs in asymmetric wedge indentation, Reference Madhavan, Chandrasekar and Farris19,Reference Weinmann and Von Turkovich20 where pile up of material occurs at the very start of chip formation and is followed closely by separation and flow of the chip along the tool cutting (or rake) face. As in ECAP and LSEM, the plastic zone is not fully developed during the initial period, and deformation parameters such as magnitudes and distributions of strains, strain rates, and temperatures are time variant; the stresses in the deformation zone and overall forces also show evolution toward the steady state. Reference Weinmann and Von Turkovich20 The initial (incipient) strained region in machining is directly analogous to that which occurs in LSEM and ECAP; this region has been classically referred to as the incipient stage of chip formation. Reference Weinmann and Von Turkovich20,Reference Klamecki21 The characteristics of the incipient strain region have been studied using finite element methods (FEMs), Reference Sevier, Yang, Moscoso and Chandrasekar6,Reference Klamecki21–Reference Lo23 load measurement, Reference Okushima and Hitomi24,Reference Oguri, Fujii, Yamaguchi and Kato25 and metallography. Reference Weinmann and Von Turkovich20
While the above SPD studies have provided some indication of its overall characteristics and evolution, a comprehensive, process-oriented framework for understanding the incipient strain region in terms of controllable process parameters has yet to be developed. The objective of the present study is to characterize the deformation in this region using several methods including particle image velocimetry (PIV), hardness mapping, and load measurement so as to facilitate a framework for describing the length of the incipient strain region as a function of controllable machining variables. Controlled machining tests were conducted in a model material—copper—and controllable variables of rake angle and undeformed chip thickness were adjusted to establish their effects on the transition to a steady-state deformation zone. These results are then generalized to determine the characteristics of material efficiency relevant to SPD configurations of ECAP and LSEM.
II. DEFORMATION FIELD IN MACHINING
Figure 1(b) shows a schematic of orthogonal machining at a constant speed (V
0), undeformed chip thickness (a
0), and rake angle (α). Chip formation occurs by concentrated shear in a plane that extends from the cutting edge to the free surface of the workpiece, set at a shear angle (
 $\phi$
) with respect to the cutting velocity. The deformation causes the chip to flow at speed (V
c) along the rake face of the tool with a deformed chip thickness (a
c). Deformation parameters of effective strain (ε), shear angle, and shear plane length (l
sp) can be determined using Eqs. (1)–(3),
Reference Moscoso, Shankar, Mann, Compton and Chandrasekar18,Reference Shaw26
 $${\bar \varepsilon } = {1 \over {\sqrt 3 }}\left( {{{\rm{\lambda }} \over {\cos \left( {\rm{\alpha }} \right)}} + {1 \over {{\rm{\lambda }}\cos \left( {\rm{\alpha }} \right)}} - 2\tan \left( {\rm{\alpha }} \right)} \right)\quad ,$$
 $$\tan \left( \phi \right) = {{\cos \left( {\rm{\alpha }} \right)} \mathord{\left/ {\vphantom {{\cos \left( {\rm{\alpha }} \right)} {\left( {{\rm{\lambda }} - \sin \left( {\rm{\alpha }} \right)} \right)}}} \right. \kern-\nulldelimiterspace} {\left( {{\rm{\lambda }} - \sin \left( {\rm{\alpha }} \right)} \right)}}\quad ,$$
 $${l_{{\rm{sp}}}} = {a_0}/{\rm{sin}}(\phi )\quad ,$$
where λ is the chip thickness ratio given by either a c/a 0 or V 0/V c. Equations (1)–(3) describe the deformation that prevails under steady-state conditions, wherein the undeformed chip thickness and overall deformation field are fully developed. However, these relationships are not sufficient to describe the cases, wherein the deformation field evolves over time, such as that which occurs at the initial stages of contact between tool and workpiece, denoted here as the incipient strain region having length l 0 in Fig. 1(b). For this case, various experimental methods are capable of providing instantaneous and high-resolution measurement of the deformation zone. These methods can be applied either in situ or post-mortem, and each has unique capabilities in terms of sensitivity and resolution for measuring deformation parameters (e.g., strain, strain rate, temperature).
In situ characterization of the deformation field with image correlation-based methods (e.g., digital image correlation (DIC), PIV) has been extensively used for field tracking of gaseous and/or solid flows.
Reference Adrian and Westerweel27–Reference Lee, Hwang, Shankar, Chandrasekar and Compton29
DIC/PIV has been applied to machining of several materials to elucidate the underlying mechanics.
Reference Calistes, Swaminathan, Murthy, Huang, Saldana, Shankar and Chandrasekar28–Reference Guo, Saldana, Compton and Chandrasekar30
In these tracking methods, incremental displacements (u, v) in an imaged region are obtained by statistical cross-correlation of successive imaging frames. From the incremental displacements, the state of the deformation is assessed in terms of strain rate and strain tensorial quantities that describe important characteristics of the strain path and history. The strain rate tensor (
 ${{\dot \varepsilon }_{xx}},{{\dot \varepsilon }_{yy}},{{\dot \varepsilon }_{xy}}$
) and effective strain rate (
 ${\dot \bar \varepsilon }$
) can be calculated according to Eqs. (4) and (5), respectively. Further, the effective strain (
 ${\bar \varepsilon }$
) at a point can be determined by integrating over the strain rate history, as in Eq. (6).
 $${{\dot \varepsilon }_{xx}} = \dot \partial u/\partial x,\quad {{\dot \varepsilon }_{yy}} = \dot \partial \nu /\partial y,\quad {\dot \gamma } = 2{{\dot \varepsilon }_{xy}} = \dot \partial \nu /\partial x + \dot \partial u/\partial y\quad ,$$
 $${\dot \bar \varepsilon } = \sqrt {{4 \over 9}\left( {{1 \over 2}\left[ {{{({{{\dot \varepsilon }}_{xx}} - {{{\dot \varepsilon }}_{yy}})}^2} + {{{\dot \varepsilon }}_{xx}}^2 + {{{\dot \varepsilon }}_{yy}}^2} \right] + {3 \over 4}{{{\dot \gamma }}^2}} \right)} \quad ,$$
 $${\bar \varepsilon } = \int {\dot \bar \varepsilon }\; {\rm{d}}t\quad .$$
In addition to PIV, load measurement also can be used to assess deformation effects in situ. Although instantaneous load data does not enable field-type measurements, it does provide aggregate response data that may be used to inform on characteristics of the overall deformation zone, such as evolution of the overall field to steady state.
Post-mortem measurement of the deformation field is possible through the evaluation of strain-dependent characteristics of strength and microstructure. For strain-hardening materials, local variation in strength and/or hardness enables indirect visualization of the cumulative deformation in the material. Controlled deformation experiments can be used to establish empirical relationships between strain and hardness in the form
 ${\rm{HV}} = C_1 {\bar \varepsilon }^n + C_2$
, where
 ${\rm{HV}}$
is the Vickers hardness,
 ${\bar \varepsilon }$
is the effective strain, and C
1, C
2, and n are constants.
Reference Sonmez and Demir31,Reference Chaudhri32
These empirical relationships can then be used together with nano- or micro-hardness maps to develop comparable strain contours. The hardness mapping approach is advantageous in that the obtained deformation fields have been found to be more accurate than those of other methods. Further, as hardening in many materials is nonlinear at low strains and small-scale impressions can be made with nano-indentation, the hardness mapping approach may be inherently more sensitive than direct methods such as PIV. A second post-mortem technique for deformation visualization involves monitoring of strain-dependent microstructure transformations such as white layer formation
Reference Shaw26
and recrystallization.
Reference Hanemann and Schrader33
In this approach, the degree of microstructure transformation and the transformation rate are strongly correlated with the amount of strain due to the associated defect activity. Disadvantages of such an approach are limited material system compatibility and the inability to directly obtain temporal deformation information (e.g., strain rate).
III. EXPERIMENTAL
A series of plane strain cutting experiments were conducted using pure copper (Grade 110) as a model system. The workpieces were annealed at 680 °C for 12 h in an air furnace, followed by machining into billets (12 mm × 38.1 mm × 5.1 mm) and plates (25.4 mm × 25.4 mm × 3.2 mm). The Vickers hardness of the copper bulk was 62 ± 2 kg/mm2. The deformation configuration was a plane-strain cutting configuration with various incident tool angles (rake angles): α = [30°, 15°, 5°]. The undeformed chip thickness was also varied: a 0 = [100, 150, 200, 250, 500, 750 μm]. A uniaxial testing machine (Instron Model 5866, Norwood, MA) was used to facilitate experiments at undeformed chip thicknesses in excess of 200 μm, while a custom-built servo-controlled linear motion stage was used to achieve the lower undeformed chip thicknesses. The deformation speed was set constant at V 0 = 0.3 mm/s in both configurations. The cutting tool was an alloy steel with hardness greater than 43HRC, and the rake/flank faces were ground sharp (radius ∼0.020 mm). The tool relief angle was constant at 1°. A plane strain condition was established by loading a tempered glass plate in contact with the workpiece on the imaging plane.
The deformation was monitored in situ using high-speed imaging and load measurement. For the imaging, a high-speed camera (Kodak Motion Corder Analyzer, Model SR-Ultra, Eastman Kodak Company, Rochester, NY) was mounted to a stereomicroscope (Nikon Model SMZ-2T, Nikon Corporation, Tokyo, Japan) capable of producing a range of magnifications. The field of view was approximately 2.3 mm × 2.5 mm, and the image size was 480 px × 512 px, yielding an effective pixel resolution of approximately 5 μm. To facilitate image correlation, micro-sized markers were introduced onto the imaged work faces using bead blasting. Imaging was not used at undeformed chip thicknesses smaller than 250 μm due to constraints of the imaging equipment. Cutting load was captured for all conditions using a built-in dynamometry. The effects of the deformation were also measured post-mortem through characterization of local material strength via hardness. Samples were mounted in an air-curing epoxy (Allied EpoxyMount, Allied High Tech Products, Rancho Dominguez, CA) and polished to mirror finish using a polishing machine (Struers Rotopol-22, Cleveland, OH). Vickers hardness was measured using a Leco MHT 200 tester with a load of 25 g. The error tolerance in indent placement was 2.5 μm. The distance between the centers of two adjacent indentations was set larger than 3 times the indentation size. To visualize microstructure, copper chips were etched using 25 mL NH4OH, 25 mL H2O, and 8 mL H2O2.
IV. RESULTS
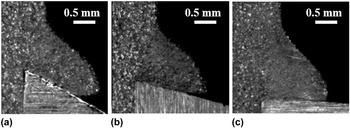
Optical images representative of the chip formation for different rake angles (α = 30°, 15°, 5°) are shown in Fig. 2 for a constant undeformed chip thickness of a
0 = 500 μm. Under each condition, the chip progressively thickened along its length and stabilized after some threshold length was traversed. The stable chip thickness corresponds to a constant or steady strain value according to Eq. (1). As rake angle decreased from left to right in Fig. 2, the steady-state chip thickness increased due to the greater amount of shear deformation at smaller rake angles. The steady-state chip thickness was used to evaluate the corresponding steady-state strain [Eq. (1)] and is reported in Table I with the associated shear angle [Eq. (2)] for each condition. From the table, the effects of the cutting parameters on deformation in the chip are clear; the steady strain increased from
 $\epsilon \ \sim \,0.89$
to
 $\varepsilon \,\sim \,1.86$
as rake angle decreased from α = 30° to α = 5°. The undeformed chip thickness did not have a distinct effect on the steady-state strain, shear angle, and chip ratio, as each exhibited low variance for the experimental conditions.
Representative high-speed optical images of the cutting process at a 0 = 500 μm with (a) α = 30°, (b) α = 15°, and (c) α = 5°.

Experimental deformation conditions and measured deformation parameters.

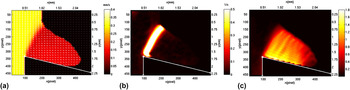
Table I provides an understanding of the steady strain as a function of rake angle and undeformed chip thickness; however, the evolution of strain within the chip during the initial stages of deformation cannot be elucidated from these measurements. Image correlation in PIV was used on high-speed images of the deformation to map the strain fields in chip formation. Figure 3(a) shows a representative example of a velocity field measured in machining of the copper at α = 15° and a
0 = 500 μm. The velocity field gives indication of the incremental material displacements in the deformation field. The work velocity was measured to be steady at V
0 ∼ 0.3 mm/s and chip velocity was also relatively constant at V
c ∼ 0.15 mm/s. A sharp change in the orientation of local material displacement is clear in the region, wherein the separation of the chip from the workpiece occurs. Spatial differentiation of the velocity field yields the strain rate field in Fig. 3(b), which can be used to identify regions where incremental strains are accumulated in the deformation field. In Fig. 3(b), a band of finite width of ∼0.180 mm can be identified as the shear zone with a maximum strain rate value of
 $\dot \varepsilon \, \sim\,0.5/{\rm{s}}$
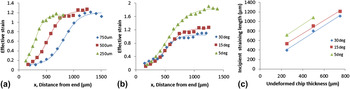
. The corresponding strain field for this condition is given in Fig. 3(c). From the strain field, it is clear that the strain values evolved along the length of the chip from a low value to a relatively steady value. This evolution is reported in a strain profile in Fig. 4(a) as a function of distance from the chip end [e.g., x in Fig. 1(b)]. The strain values were obtained along a contour parallel to and 150 μm away from the chip rake face. The strain profile clearly follows a sigmoidal curvature, as the strain rises rapidly after the start of chip formation and tapers at larger distances from the chip end. For this cutting condition, the strain evolved from near-zero to
 $\varepsilon \,\sim\,1.25$
along the chip length.
(a) Velocity, (b) strain rate, and (c) strain field for a 0 = 500 μm and α = 15°.

(a) Strain profile for α = 15°, (b) strain profile for a 0 = 500 μm, and (c) linear fit of length of incipient strain region versus undeformed chip thickness using PIV method.

The effect of undeformed chip thickness on the strain profile for a constant rake angle of α = 15° is also evident in Fig. 4(a). From the figure, as undeformed chip thickness increased, the curves shifted but maintained similar slopes and plateau values. Increased undeformed chip thickness effectively delayed the onset of steady strain to larger distances from the chip end, suggesting that a larger incipient strain region prevails at larger undeformed chip thickness. The effect of rake angle on the strain profile was investigated at constant undeformed chip thickness and is shown in Fig. 4(b) for a 0 = 500 μm at several rake angles. As rake angle decreased, the curves shifted to higher threshold strains and longer incipient strain regions. The plateau in the strain profiles obtained using the PIV method can be compared to the estimate for the deformation strain in the steady-state chip according to Eq. (1). To accomplish this, the velocity field for each condition was used to obtain the velocity ratio (V 0/V c), which is equivalent to the chip thickness ratio (a c/a 0). The theoretical strain values were calculated and are listed in Table I. From Fig. 4(b), the plateaus of the PIV-obtained strain profiles are close to the corresponding theoretical values, with differences smaller than 10%. These observations further establish the reliability of the PIV results.
To derive a standard method for evaluating the length of the incipient strain region [l
0 in Fig. 1], a fit of the experimental data was established. Strain profiles, e.g. Figs. 4(a) and 4(b), can be approximated by a logistic function that is used to model sigmoidal behavior in growth. The general form is
 ${\bar \varepsilon } = a + b{\left( {1 + {e^{c + dx}}} \right)^{ - 1}}$
, where a, b, c, and d are constants, x is the distance from chip end, and
 ${\bar \varepsilon }$
is the effective strain. The least squares fits and the experimental data for the conditions at α = 15° and a
0 = 500 μm are plotted in Figs. 4(a) and 4(b). The results for the model fits were all high (R
2 > 0.98). The extent of the incipient strain region [l
0 in Fig. 1] was identified as that corresponding to 95% of the maximum strain imposed. These are plotted in Fig. 4(c) for the experimental conditions investigated using PIV. From the results, it is clear that the length of the incipient strain region increases with undeformed chip thickness and decreasing rake angle. Further, a clear linear trend is seen for conditions of constant rake angle. The linear fits of the data are provided in Table II.
Length of the incipient strain region (
 ${l_0}$
) versus undeformed chip thickness (
 ${a_0}$
) using PIV, hardness mapping, load measurement, and an average of these measures.

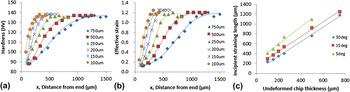
The evolution of micro-hardness as a function of distance was investigated for the range of experimental conditions. Figure 5(a) shows the hardness profile for α = 15° and the range of undeformed chip thicknesses investigated. At a given undeformed chip thickness, hardness increases with distance from a low value of H ∼ 90 kg/mm2 to a saturation at H ∼ 135 kg/mm2 after some threshold length. The evolution of hardness is useful as it provides indirect evidence of gradient in the strain levels in the chip, similar to that observed in the PIV. A strain-based understanding of this evolution can come from hardness measurements based on empirical relations that establish correlation between strain and hardness. One such relation between effective strain and hardness in annealed pure copper was established through controlled compression tests
Reference Chaudhri32
and is given by
 $H = 132{{\bar \varepsilon }^{0.1968}}$
, where H is hardness and
 ${\bar \varepsilon }$
is the effective strain. Figure 5(b) shows the conversion of the hardness values in Fig. 5(a) to effective strain according to this empirical relationship. It is clear that the effective strains, which increase from near-zero to
 $\varepsilon \,\sim\,1.22$
, are quite similar to the PIV-based strain measurements, which range up to
 $\varepsilon \,\sim\,1.25$
in Fig. 4. The hardness-converted strain profiles for α = 15° were fitted to the same expression used for the PIV data; these are shown with the converted data in Fig. 5(b). From the figure, it is clear that the fits describe the trend well. To determine the length of the incipient strain region, an identical threshold was applied (e.g., 95% of the maximum value). The lengths of the incipient strain regions for all experimental conditions are shown in Fig. 5(c), and linear trends are again observed at constant rake angle. From these results, it is clear that the length of the incipient strain region increases with undeformed chip thickness. The corresponding fits are provided in Table II.
(a) Hardness profile for α = 15°, (b) hardness-converted strain profile for α = 15°, and (c) linear fit of the length of the incipient strain region versus undeformed chip thickness using hardness method.

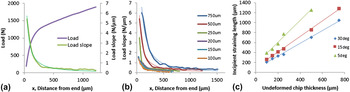
The cutting load was recorded for all experimental conditions. The load data corresponding to α = 15° and a
0 = 500 μm are shown in Fig. 6(a), together with the slope of the loading curve as a function of distance. It is clear that the slope of the loading curve decreases rapidly with increasing distance along the chip. This behavior can be fitted with a power function given by k = a(x + b)
c
, where a, b, and c are constants,
 $x$
is the distance from the chip end, and
 $k$
is the slope of the loading curve. The loading curve slopes and their fits for the remaining experimental conditions at α = 15° are shown in Fig. 6(b). To identify the incipient loading of the tool, 95% of the maximum rate of change was used (e.g., k ∼ 0.25 N/μm) as the threshold. A summary of these measurements for the entire range of experimental conditions is provided in Fig. 6(c), which shows linear dependence of the length of incipient loading as a function of undeformed chip thickness for multiple rake angles. The fits corresponding to these linear relationships are provided in Table II.
(a) Load profile and loading slope curve for α = 15° and a 0 = 500 μm, (b) loading slope curves for α = 15°, and (c) linear fit of the length of the incipient strain region versus undeformed chip thickness using the load method.

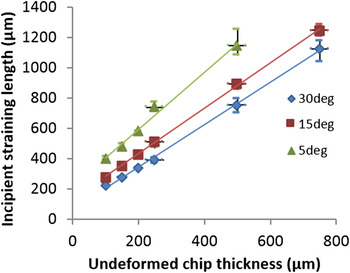
It is clear that the PIV, hardness, and load methods provide similar results in terms of the measurement of the length of the incipient strain region. The average of the measurements (
 $\overline {{l_0}} )$
is plotted as a function of undeformed chip thickness and rake angle in Fig. 7. From the figure, the relationship between undeformed chip thickness and the length of the incipient strain region is linear and the corresponding fits are provided in Table II. From these observations, the incipient strain region ranges in length from 1.4 to 1.9 times the undeformed chip thickness, with an offset that also increases with decreasing rake angle. This behavior is consistent with the previously reported characteristics of strain and stress fields based on FEM simulations of chip formation.
Reference Sevier, Yang, Moscoso and Chandrasekar6,Reference Klamecki21–Reference Okushima and Hitomi24,Reference Rosa, Kolednik, Martins and Atkins34,Reference Potdar and Zehnder35
For example, Ref. Reference Rosa, Kolednik, Martins and Atkins34 presented a distortion field for the machining of copper at α = 10°, a
0 = 1.0 mm, and λ = 2.7. This field contained an incipient strain region of l
0 ∼ 1.9 mm, which is in the range of that expected from Table II (1.6–2.0 mm). While the characteristics and evolution of the incipient strain region obtained in the present study are consistent with that of simulation by other researchers, additional corroboration is provided with the clear agreement in measurements across multiple in situ and post-mortem-based measurement methods (e.g., PIV, hardness, load).
Average length of the incipient strain region (l 0) versus undeformed chip thickness (a 0) with error bars for the range of experimental conditions.

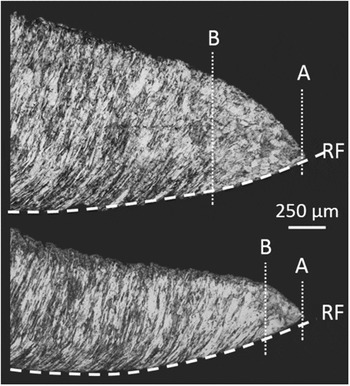
The microstructures of samples machined at α = 15° and undeformed chip thicknesses of a 0 = 750 μm and a 0 = 250 μm are shown in the top and bottom of Fig. 8, respectively. In both cases, the microstructure varied with distance along the chip. Closer to the chip ends (line A), the original microcrystalline grain structure was undistorted, consistent with the measurements of low straining and low hardening in these regions. The coarse grain structure can be compared with that of regions further along the chip length, where the microstructure was dominated by flow lines and the grain structure was not optically resolved. Flow lines are characteristic indicators of substantial straining and the positions at which they first occur along the rake face (line RF) of the chips are marked in Fig. 8 (line B). From the micrographs, the evolution of microstructure (e.g., distance from A to B) was clearly sensitive to the undeformed chip thickness, as the smaller chip exhibited a substantially shorter transition zone. This is supportive of the notion that the extent of the incipient strain region is strongly influenced by undeformed chip thickness, as suggested by the PIV, hardness, and load measurements.
Evolution of microstructure from distorted microcrystalline grains to flow lines for a 0 = 750 μm (top) and a 0 = 250 μm (bottom) with α = 15°. The rake face of the chip marked as line RF, the chip end marked as line A, and the position of the first observable flow line marked as line B.

V. DISCUSSION
A. Incipient straining in chip formation
A process-oriented framework for describing the extent of the incipient strain region in terms of controllable process parameters can be elucidated from the summary data in Table II and the plots of Fig. 7. First, the slopes of the linear fits describing the relationship between length of the incipient strain region and undeformed chip thickness are positive. That is, the extent of the incipient strain region increases linearly with undeformed chip thickness for a given rake angle. Further, the slopes of the empirical relationships in Table II are greater than unity and increase as rake angle decreases, thus the extent of the incipient strain region is always larger than the undeformed chip thickness. A second observation is that rake angle affects the offset between the curves in Fig. 7; more positive rake angles result in shorter incipient strain regions for equivalent undeformed chip thicknesses. In addition to differences in offset between curves, rake angle also affects the y-axis intercepts in Fig. 7. A similar phenomenon has been observed when considering the relationship between cutting force and undeformed chip thickness in orthogonal machining, Reference Shaw26 where a nonzero force is estimated for effective cutting depths approaching zero. The nonzero “plowing” force is often attributed to the relative importance of local geometry of the cutting edge at small undeformed chip thicknesses, under which conditions it is better described as rounded and cannot be assumed to be perfectly sharp. It is plausible that the cutting edge geometry also has a similar effect on extrapolation of incipient straining behavior to small undeformed chip thicknesses, as in the present study. While these observations and the empirical relationships derived herein provide a sufficient basis for estimating the extent of the incipient strain region in machining of copper, it is useful to consider the effects of undeformed chip thickness and rake angle on the underlying mechanics of deformation. Specifically, it is useful to relate the length of the incipient strain region (l 0) to deformation variables more directly comparable across other deformation configurations (e.g., ECAP, LSEM, rolling).
Recall that the steady primary deformation zone in orthogonal cutting is a shear plane oriented at angle
 $\phi$
with respect to the cutting direction and extending from the immediate vicinity of the cutting edge to the free surface of the chip. Primary deformation variables that are determined by the above machining parameters are strain, shear angle, and shear plane length. From Eqs. (1) and (2) and Table I, the first two of these variables are primarily affected by rake angle, as more positive rake angles yield lower strains and larger shear angles. The effects of undeformed chip thickness on these two deformation variables are marginal. In contrast, shear plane length [Eq. (3)] is directly affected by both rake angle and undeformed chip thickness. The shear plane length (l
sp) is plotted against the average length of the incipient strain region (
 $\overline {{l_0}} )$
in Fig. 9. A clear linear trend exists between the length of the shear plane and the length of the incipient strain region across the conditions investigated, which included multiple rake angles and undeformed chip thicknesses. Equation (7) (in μm) provides an empirical linear fit of this data (R
2 = 0.9846) to predict the length of the incipient strain region given the shear plane length.
 $$\overline {l_0 } {\rm{}} = 0.684l_{{\rm{sp}}} + 127.98\quad .$$
Relationship of the length of the incipient strain region (l
0) to shear plane length (
 ${l_{{\rm{sp}}}}$
) for the range of experimental conditions.

An understanding of the effects of controllable process variables (e.g., rake angle, undeformed chip thickness) on the shear plane length provides further insight on their effects on the length of the incipient strain region. For example, shear plane length is directly proportional to undeformed chip thickness [Eq. (3)]. It follows that undeformed chip thickness should also be linearly related to the length of the incipient strain region, as is observed in Fig. 7. Second, shear plane length is inversely proportional to
 ${\rm{sin}}(\phi )$
, such that more negative shear angles result in increasingly longer shear plane lengths. This nonlinearity explains the variation in slope for the relationships in Fig. 7, where the length of the incipient strain region exhibited greater sensitivity at smaller rake angles. For example, given an arbitrary variation in undeformed chip thickness ∆a
0, the resulting change in shear plane length is
 ${\rm{\Delta }}{l_{{\rm{sp}}}} = {\rm{\Delta }}{a_0}/{\rm{sin}}\phi$
. The variational quantity
 ${\rm{\Delta }}{l_{{\rm{sp}}}}$
is larger for small values of
 ${\rm{sin}}\phi$
(at constant ∆a
0), which directly corresponds to deformation at smaller rake angles.
B. Deformation field in ECAP and LSEM
The description of the extent of the incipient strain region as a function of general deformation variables (e.g., shear angle, shear plane length) has implications for understanding the heterogeneous deformation that occurs in the processing of grain-refined materials by ECAP and LSEM (Fig. 1). For both configurations, steady-state deformation parameters (e.g., strain, shear angle, shear plane length) are determined a priori by die geometry characteristics, unlike in conventional machining. Determination of these parameters beforehand enables investigation of the incipient strain region in each process by leveraging the empirical relations developed in the present study.
Consider an ECAP process wherein a copper billet of square cross-section (width a
0) is deformed through a die angle of θ with a sharp corner (ψ = 0°) connecting die channels of equivalent cross-section. The billet is passed repeatedly through the die with rotations applied to prescribe final microstructure, properties, and texture. The shear angle in ECAP can be determined according to Eq. (2), due to similarities between the deformation fields of machining and ECAP (e.g., simple shear). For ECAP, the rake angle in Eq. (2) is related to the die angle according to α = θ − 90 and the undeformed billet thickness is equivalent to the deformed billet thickness (a
0 = a
c). In the case of a sharp die corner, this yields a shear angle of
 $\phi = {\rm{\theta }}/2$
Reference Langdon and Valiev1
and a shear plane length given by Eq. (8) such that:
 $${l_{{\rm{sp}}}} = {a_0}{\rm{csc}}({\rm{\theta }}/2)\quad .$$
Utilizing the empirical relationship in Eq. (7), one can estimate the length of the incipient strain region in ECAP as follows. For an ECAP die with
 ${\rm{\theta }} = 90^\circ$
and
 ${\rm{\psi }} = 0^\circ$
, the length of the incipient strain region (in μm) is given by Eqs. (7) and (8) such that
 $l_0 {\rm{}} = n(0.967a_0 + 127.98)$
, where n is the total number of ECAP passes. The validity of this expression can be seen in considering the geometry of deformed copper ECAP billets in Ref. Reference Stoica, Fielden, McDaniels, Liu, Huang, Liaw, Xu and Langdon8, where θ = 90° and a
0 = 10 mm. The expression derived herein estimates the length of the incipient strain region to be l
0 ∼ 9.8 mm, which is similar to the actual length of l
0 ∼ 9.9 mm observed in the ECAP study. Further validation is evident in comparison with FEA results of Ref. Reference Basavaraj, Chakkingal and Kumar14, where ECAP billets are deformed over a range of die angles from θ = [90°, 105°, 120°] with a
0 = 20 mm. The present analysis predicts the length of the incipient strain region to be l
0 = [19.1, 17.1, 15.0 mm], which are similar to the actual lengths of l
0 = [19.4, 17.4, 15.8 mm] observed in the experiments.
Similarly, in LSEM, the chip formation process of Fig. 1 is modified such that the exit thickness of the chip is controlled by the action of a constraining edge. The constraint modifies the deformation field such that the chip thickness ratio, strain, and shear angle are determined a priori. Reference Moscoso4 In this case, Eqs. (2) and (3) can be used to estimate the shear plane length. The shear plane length for an LSEM die is given by Eq. (9) such that:
 $${l_{{\rm{sp}}}} = {a_0}{[{\left( {{\rm{\lambda }}/{\rm{cos\alpha }} - {\rm{tan\alpha }}} \right)^2} + 1]^{0.5}}\quad .$$
The length of the incipient strain region in LSEM can then be determined according to Eq. (7). The validity of this expression can be seen in considering the geometry of deformed LSEM billets in Ref. Reference Sevier, Yang, Moscoso and Chandrasekar6, where copper is deformed with α = 0°, a 0 = 0.25 mm, and λ = 3. The expression in Eq. (7) estimates the length of the incipient strain region to be l 0 ∼ 0.67 mm, which is similar to the actual length of l 0 ∼ 0.62 mm observed in the LSEM study.
A primary motivation of both ECAP and LSEM is homogeneous imposition of large plastic strains in billet materials. In this regard, it is worthwhile to consider the length of the incipient strain region as a function of the strain imposed in the billet for each of these processes. Figure 10 shows this relationship for both deformation configurations (a 0 = 10 mm, θ = 90°, ψ = 0°, α = 0°). For ECAP, the shear angle and the shear plane length are constant for each pass. This causes the length of the incipient strain region to also be constant per pass. For this reason, the overall length of inhomogeneous straining is linearly related to the strain imposed in the bulk material [Fig. 10(a)]. In contrast, the relation between strain and the length of the incipient strain region is somewhat more complex in the case of LSEM. In LSEM, the chip thickness ratio can be set to be less than unity (λ < 1) or greater than unity (λ > 1) to effect various levels of strain in a single deformation pass. Reference Moscoso, Shankar, Mann, Compton and Chandrasekar18 Consequently, the shear angle and shear plane length vary over a significantly larger range than in ECAP, as determined by the parameter λ in Eq. (9). The relation between the length of the incipient strain region and effective strain is plotted in Fig. 10(b) for LSEM conditions of λ > 1. Although chip thickness ratios of λ < 1 have been demonstrated in select materials, Reference Moscoso4,Reference Sevier, Yang, Moscoso and Chandrasekar6 these ratios can be difficult to achieve in practice due to setup and tooling considerations. Thus, Fig. 10 shows that shorter inhomogeneous deformation lengths are present for ECAP when compared to LSEM at similar levels of strain. This suggests that ECAP is potentially more efficient at homogeneously deforming billet materials to large strains than LSEM.
Length of the incipient strain region (
 ${l_0}$
) as a function of strain for (a) ECAP (a
0 = 10 mm, θ = 90°, ψ = 0°) and (b) LSEM (a
0 = 10 mm, α = 0°).

VI. CONCLUSIONS
The present study investigated the influences of tool rake angle and undeformed chip thickness on the length of the incipient strain region. Plane strain cutting experiments were carried out using copper as a model material, and several methods were applied to measure the length of the incipient strain region, including in situ methods (e.g., PIV, load analysis) and post-mortem methods (hardness mapping, microstructure). From the results, the extent of the incipient strain region increases with increasing undeformed chip thickness and decreasing rake angle. For a specific rake angle, there is a strong linear relationship between the extent of the incipient strain region and the undeformed chip thickness. These results were used to provide insight on the relative material efficiencies of SPD processes that are used to manufacture UFG materials.
ACKNOWLEDGMENTS
The work at The Pennsylvania State University was supported in part by NSF (Grant No. CMMI 1130852) and Third Wave Systems via DOE (Grant No. DE-EE0005762). The work at the Indian Institute of Science was supported in part by DST (Grant No. SR-CE-0057-2010).