I. INTRODUCTION
Nanocrystalline transition metal phosphides have attracted attention across several fields for their magnetic, Reference Brock and Senevirathne1 catalytic, Reference Oyama, Gott, Zhao and Lee2 and electronic properties. Reference Wang, Yang, Zhang, Li and Zhang3 Specifically, copper phosphide (Cu3P) has become relevant as an alternative anode material in lithium-ion batteries. Reference Pfeiffer, Tancret and Brousse4,Reference Stan, Klöpsch, Bhaskar, Li, Passerini and Winter5 A need to develop simple solution-based synthesis methods that also provide tight physical property control is necessary for this technology to become viable. Previously, Cu3P and other metal-phosphides have been synthesized by solid–vapor transport, Reference Villevieille, Robert, Taberna, Bazin, Simon and Monconduit6 solvothermal reactions, Reference Aitken, Ganzha-Hazen and Brock7 yellow/white phosphorus, Reference Xie, Su, Qian, Liu and Qian8,Reference Carenco, Hu, Florea, Ersen, Boissie, Me and Sanchez9 and other solution-based methods that utilize the decomposition of trioctylphosphine (TOP). Reference Park, Koo, Yoon, Hwang, Kang, Park and Hyeon10–Reference De Trizio, Figuerola, Manna, Genovese, George, Brescia, Saghi, Simonutti, Van Huis and Falqui13 Here, we report the synthesis of size tunable Cu3P nanocrystals by the reaction of copper nanocrystals with a novel solution-based phosphorus source: P2S5 in TOP. A hot injection technique was utilized at temperatures between 200 and 300 °C to produce nearly uniform Cu3P nanocrystals.
Extending from Cu3P, copper thiophosphate (Cu3PS4) and copper selenophosphate (Cu3PSe4) have recently been reported as having favorable electronic properties for applications as alternative, earth abundant solar absorption materials. Reference Itthibenchapong, Kokenyesi, Ritenour, Zakharov, Boettcher, Wager and Keszler14–Reference Foster, Jieratum, Kykyneshi, Keszler and Schneider16 These ternary chalcogenides have similar crystal structures to CdTe, Cu(In,Ga)Se2, and Cu2ZnSnSe4, as well as Cu3AsS4, and it is thus logical to pursue the development of simple and inexpensive syntheses of I–V–VI semiconductors for earth abundant and nontoxic next generation solar devices. Reference Balow, Sheets, Abu-Omar and Agrawal17
To date, reported syntheses of Cu3P(S,Se)4 have only been conducted via chemical vapor transport mechanisms. Reference Itthibenchapong, Kokenyesi, Ritenour, Zakharov, Boettcher, Wager and Keszler14,Reference Nitsche and Wild18–Reference Andrae21 In this work, we demonstrate that nanocrystalline Cu3P can be used as a precursor to synthesize copper thiophosphate (Cu3PS4) in the presence of decomposing thiourea (THU). The resulting p-type Cu3PS4 particles have an orthorhombic crystal structure with a wurtzite superstructure, Reference Pfitzner and Reiser22 an optical band gap of 2.36 eV, and a generated stable photoresponse with a current density of 3 μA/cm2 under standard AM 1.5G radiation to demonstrate the proof of concept.
II. EXPERIMENTAL DETAILS
A. Synthesis of Cu3P nanocrystals
A precursor solution containing controlled quantities of P2S5 (99%; Sigma Aldrich, St. Louis, Missouri) and TOP (90%; Sigma Aldrich) was prepared in a round-bottom flask under nitrogen without further purification. This was stirred at 40 °C for 20 min or until the solution turned homogeneously orange. Oleylamine (OLA) (90%; Sigma-Aldrich) was degassed by the freeze–pump–thaw method and stored under inert gas. 10.0 mL OLA was added to 1.5 mmol Cu(acac)2 (Sigma-Aldrich) in a three neck flask under nitrogen and was attached to a standard Schlenk line apparatus and a heating mantle. The copper precursor was heated to reflux under vacuum (120–135 °C), then refilled with argon and evacuated again (repeated 3 times). The Cu–OLA solution was heated rapidly to between 200 and 300 °C, then 4.5 mL of the P2S5–TOP solution was quickly injected via syringe and a timer was started. Due to the temperature drop of 30–40 °C upon injection, the reaction was heated back to the initial injection temperature and held for 30 min. The flask was cooled naturally to room temperature. The standard reaction consisted of a molar ratio of TOP:P2S5:Cu(acac)2 = 10:0.75:1.5 in 10.0 mL OLA.
The Cu3P particles were washed using a 1:1 (v/v) mixture of toluene (99.5%; Macron Chemicals, Center Valley, Pennsylvania) and ethanol (200-proof; Koptec, Radnor, Pennsylvania) followed by centrifugation at 14 krpm for 5 min in a Beckman Coulter Allegra X-22 centrifuge (Brea, California). The supernatants were decanted and the particles were given a total of 3 additional toluene/ethanol washes before final storage in air or ethanol.
B. Conversion of Cu3P to Cu3PS4
Nanocrystals of Cu3P were dried under nitrogen at room temperature and immediately put into a three-neck round-bottom flask with 5 g of THU pellets (99%, Sigma-Aldrich) providing an excess molar quantity of sulfur. 10 mL of 1-octadecene (90%, Sigma-Aldrich) was also added in some experiments at this point, but its presence is not critical for the reaction. The flask was attached to a standard Schlenk line apparatus and evacuated at room temperature. After three cycles of evacuation and refilling with argon, the flask was heated to 180 °C under Argon for 5 h before cooling to room temperature. If 1-octadecene was not used, ethanol was injected into the system at <50 °C to aid in collection of the product. The yellow solid was washed by suspending in ethanol and was centrifuged at 14 krpm for 5 min. After discarding the supernatant, the washing process was repeated at least three times before drying under nitrogen.
III. DISCUSSION
A. In situ copper nanocrystals
Copper nanocrystals were synthesized by heating copper(II) acetylacetonate (Cu(acac)2) in OLA at temperatures above 200 °C as previously observed in the literature. Reference Uk Son, Kyu Park, Park and Hyeon23 Immediately prior to the injection of the phosphorus source, P2S5 in TOP, aliquots of the Cu(acac)2 precursor in OLA were analyzed for comparison with the targeted product, Cu3P. Copper nanocrystals were observed to form round clusters whose average diameter grew from 3.8 ± 0.9 to 15.0 ± 1.8 nm with increasing reaction temperatures from 200 to 300 °C, respectively. The nanocrystals were uniform and phase pure according to transmission electron microscopy (TEM) and x-ray diffraction (XRD) analysis [see Supplementary Material (SM), Fig. S1].
B. In situ phosphorus source
TOP is well known to be a strong reducing agent, stabilizer, and solvent. Reference Chen, Zhang, Zhang and Tan24 Conversely, P2S5 is a strong oxidizing agent and sulfur source. Upon combination of these two species, gas chromatography-mass spectrometry proved that the phosphorus site on TOP acquired sulfur from P2S5, forming trioctylphosphine sulfide (TOPS): a capping agent capable of stabilizing nanocrystals (see SM, Fig. S2). Reference Hou, Zhang, Chen, Fang, Yan, Li and Qi25 Formation of TOPS suggests that phosphorus must be liberated from the P2S5 as the sulfur reacts with TOP. Evidence of elemental phosphorus is observed when the solution of P2S5 in TOP is heated to 50 °C and a red precipitate forms. Analysis of the precipitate using energy dispersive x-ray spectroscopy (EDS) in the scanning electron microscope (SEM) revealed a phosphorus to sulfur ratio of 4.8:1, or 12 times the expected ratio of 0.4:1 as in P2S5. Further evidence of amorphous red phosphorus was obtained when P2S5–TOP was injected into hot OLA (>200 °C) without the presence of copper (otherwise identical conditions to Cu3P syntheses). Amorphous red phosphorus again formed, with no XRD signature (see SM, Fig. S3) and a molar phosphorus to sulfur ratio greater than 100:1 according to SEM–EDS observations.
C. Copper phosphide
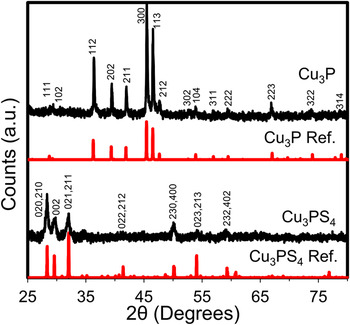
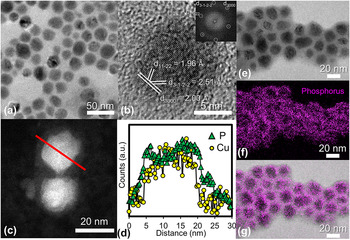
The product which resulted from reacting in situ synthesized copper nanocrystals with the injected solution of TOP and P2S5 was characterized by XRD (Fig. 1), TEM [Figs. 2(a) and 2(b)], and SEM–EDS. The XRD pattern of a standard nanocrystalline Cu3P film (300 °C, Cu:P = 1.5:1) confirmed a hexagonal crystal structure with reference to PDF# 01-071-2261 [P 63 cm (185)]. The lattice parameters (a = 6.9106 Å, c = 7.0927 Å) were derived based on the refinement results using both Maud and PowderCell software.
XRD spectra of Cu3P synthesized from the in situ phosphorous source P2S5 in TOP (Ref. PDF# 01-071-2261). This Cu3P reacts with decomposing THU to synthesize Cu3PS4 and is also shown (Ref. PDF 01-071-3306).

(a) Bright field and (b) high resolution transmission electron microscopy (HRTEM) images of Cu3P nanocrystals synthesized by the hot injection of a P2S5–TOP solution into a solution charged with Cu(acac)2 in OLA. The FFT of (b) is the inset. (c) Annular dark field STEM image of two Cu3P nanocrystals. The solid red line indicates the location of the EELS linescan. (d) STEM EELS linescan showing the precise location of elemental signals for P (green triangles) and Cu (yellow circles) indicating a uniform nanocrystal capped with phosphorus. Note that while the Cu:P ratio is constant within the bulk of the nanoparticle (brightest region), the P signal extends beyond the nanocrystal. (e) Bright field TEM image of Cu3P nanocrystals with (f) the accompanying EFTEM phosphorus map confirming the phosphorus-rich surface. (g) Overlaid EFTEM phosphorus map over the original bright field image.

TEM analysis of the standard product indicated that the mean particle diameters ranged from 6.7 ± 1.5 nm at 200 °C to 20.8 ± 3.3 nm at 300 °C after 30 min (see SM, Figs. S4–S6). Particle diameters were independent of reaction times longer than 5 min across similar temperatures. Particles exhibit interplanar spacings consistent with the literature Reference Olofsson26 and can be seen in Fig. 2(b). Unlike other reports on Cu3P Janus particles, Reference De Trizio, Figuerola, Manna, Genovese, George, Brescia, Saghi, Simonutti, Van Huis and Falqui13 we observe single crystalline nanocrystals through the 200–300 °C temperature range according to high-resolution TEM images.
Analysis of SEM–EDS data for nanocrystals synthesized over various stoichiometric atomic ratios indicated excess phosphorus beyond 3:1 Cu:P. This excess phosphorus was observed to be proportional to the amount of P2S5 injected. Conversely, the ratio of Cu:P was independent of the molar amount of TOP present as long as sufficient TOP was provided to remove the sulfur from P2S5. When insufficient TOP was used, undesired Cu2−x S was readily formed (see SM, Fig. S7). The discrepancy between the XRD pattern showing only one pure phase of Cu3P and SEM–EDS showing excess phosphorus was hypothesized due to excess amorphous red phosphorus, TOP/TOPS as a surface capping ligand, or a combination of the two. To test this hypothesis, scanning transmission electron microscopy (STEM) and electron energy loss spectroscopy (EELS) linescans were used to show the presence of phosphorus throughout the Cu3P nanocrystals and identify any variations in phosphorus present across the nanoparticles as seen in Figs. 2(c) and 2(d). In the STEM EELS linescan, the phosphorus signal was observed to extend beyond the boundary of the copper signal by about 2 nm, while the relative copper and phosphorus signals remained constant across the nanocrystal. Phosphorus mapping using energy-filtered TEM (EFTEM) was used to detect an increase in phosphorus signal near the edges of the particles, confirming the EELS observation [Figs. 2(e)–2(g)]. Thus, uniform Cu3P nanocrystals have been synthesized with a phosphorus rich surface caused by either excess amorphous red phosphorus or TOP/TOPS capping ligands which is consistent with the literature. Reference Mobarok and Buriak27 An elemental map and linescan of Cu3P nanocrystals taken using STEM–EDS further confirm uniformity throughout the particles (see SM, Figs. S8 and S9).
Multiple reports in the literature have indicated that excess phosphorus is required to achieve phase-pure synthesis of Cu3P, though the precise amounts have varied considerably. Reference Aitken, Ganzha-Hazen and Brock7,Reference Olofsson26 For example, Olofsson reported a homogeneous range with Cu:P ratios between 2.73:1 and 2.82:1 while Aitken et al. reported at least a 1:1 ratio for pure phase Cu3P. Aitken also claims that the off-stoichiometry in Cu3P may either be excess amorphous phosphorus, intrinsic copper vacancies, or a combination there of. De Trizio et al. recently confirmed that copper vacancies are thermodynamically favored in this system. Reference De Trizio, Gaspari, Bertoni, Kriegel, Moretti, Scotognella, Maserati, Zhang, Messina, Prato, Marras, Cavalli and Manna28 We observe that an initial Cu:P ratio of 2.75:1 or greater will result in a copper phase (Fig. 3). At ratios of 2.6:1 and below, only Cu3P peaks are observed and are found to increase in intensity, accompanied by a slight shift in the peak position [Fig. 3(a)]. Although the precise Cu:P ratios determined by SEM–EDS varied slightly across experiments, the trend depicts a linear relationship between the amount of phosphorus injected and the final amount of phosphorus observed in the product, as depicted in Fig. 3(b). Therefore excess phosphorus is needed to obtain phase pure Cu3P. Notably, the excess phosphorus remains on the outside of the nanocrystal. Efforts to selectively etch the surface phosphorus were unsuccessful.
(a) XRD scans showing the presence of Cu metal (PDF# 4-836) with Cu3P at Cu:P ratios above 2.75:1 and phase-pure Cu3P at ratios of 2.6:1 and below. (b) Final Cu:P ratios obtained by SEM–EDS are found to be dependent on the initial concentration of P2S5 in TOP, indicating that excess phosphorus is needed to obtain pure phase Cu3P.

To illustrate the versatility of P2S5 in TOP as an in situ phosphorus source, InP nanoparticles have also been synthesized in a similar method to that of Cu3P. Experimental details and evidence are provided in the SM (Fig. S10).
D. Cu3PS4
The decomposition of THU in the presence of Cu3P enables the conversion of Cu3P to Cu3PS4. The decomposition of THU has been shown to occur in two main steps: the isomerization of THU to ammonium thiocyanate followed by decomposition into several gaseous products including ammonia, hydrogen cyanide, isothiocyanic acid, ammonium cyanamide, and most importantly the sulfide gasses/vapors: hydrogen sulfide and carbon disulfide. Reference Wang, Gao and Wang29,Reference Timchenko, Novozhilov and Slepysheva30 The reaction of sulfur-containing species produced from the decomposition of THU with Cu3P can occur with or without a solvent present at 180 °C. When selecting a solvent, reactions between the solvent and decomposition products were avoided. For example, 1-octadecene proved unreactive and supportive of the conversion reaction while OLA formed organic-sulfur complexes without forming Cu3PS4.
The XRD pattern obtained from a film that was drop cast onto a quartz substrate indicated the formation of the orthorhombic crystal structure of Cu3PS4 (Fig. 1). The XRD pattern indicates the presence of only a single phase, with lattice parameters of a = 7.2620 Å, b = 6.3050 Å, and c = 6.0366 Å. SEM–EDS data before and after the reaction with THU show an increase in sulfur content from Cu:P:S (normal to 3.0 Cu) of 3.0:1.8:0.3 to 3.0:2.6:4.5 (see SM Figs. S11 and S12). The excess phosphorus from the initial formation of Cu3P is seen to be present in Cu3PS4 coinciding with a large increase in the amount of sulfur present. Nonstoichiometric ratios may also be the result of copper vacancies similar to that which is hypothesized in Cu3P. Reference Aitken, Ganzha-Hazen and Brock7 Because the EDS was taken for a large area of sample, a more detailed analysis of the individual particles was conducted using TEM techniques.
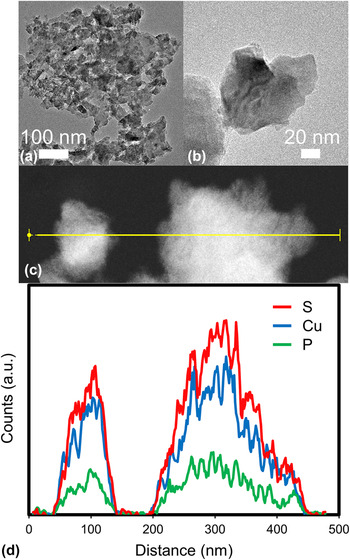
Synthesis without an additional reaction medium such as 1-octadecene (using only melted THU as the solvent and reactant) produced clusters with tube-like pores (see SM, Fig. S11). This indicates a diffusion related mechanism such as the Kirkendall effect which is contributing to the formation of Cu3PS4. Synthesis in 1-octadecene produced larger, solid aggregates which were analyzed by TEM [Figs. 4(a) and 4(b)] and STEM–EDS [Figs. 4(c) and 4(d)]. Aggregates consisted of smaller particles that were not uniform in shape, but were usually <200 nm. The results of the STEM–EDS analysis showed a uniform distribution of Cu, P, and S throughout the particles, confirming that the particles do not have a core–shell structure nor do they have a phosphorus or sulfur rich surface. The counts of characteristic x-ray photons corresponding to Cu, P, and S are expected and observed to increase with thickness of the specimen. Despite the relative noise in the scan, constant ratios of elemental signals across the particles show that the particles are uniform (see SM, Fig. S14). Qualitative atomic ratios across the particles are in agreement with the expected 3:1:4 ratio of Cu:P:S.
(a and b) Bright field TEM image of Cu3PS4 particles synthesized from the reaction of Cu3P in 1-octadecene with decomposing THU. (c and d) STEM–EDS linescan of Cu3PS4 showing a uniform atomic composition qualitatively approaching the desired 3:1:4 Cu:P:S ratio. Data represented is a 5-point moving average.

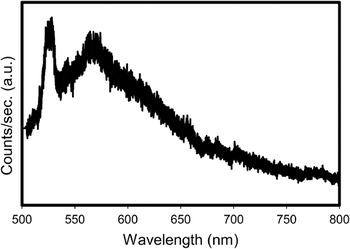
The effective optical band gap of the Cu3PS4 synthesized from THU without 1-octadecene was determined by photoluminescence (PL) to be 2.36 eV (525 nm) and is consistent with its yellow color. This peak matches the optical band gap which matches what we would expect from radiative recombination. The sharpness of PL peaks tends to increase with particle size. Reference Unold, Gütay, Abou-Ras, Kirchartz and Rau31 Given that some larger particles of Cu3PS4 could be present in the analyzed sample, the distribution of particle sizes causes a larger distribution of PL signals. Particularly, large crystalline particles likely contribute to the sharpness of the peak at 525 nm in Fig. 5. Our result is also consistent with the previously reported Reference Marzik, Hsieh, Dwight and Wold19 and verified Reference Foster, Jieratum, Kykyneshi, Keszler and Schneider16 band gap of 2.38 eV. A wide photoresponse is also observed at a lower energy level centered at 2.19 eV (566 nm). This is potentially caused by a distribution of defect states within the band gap, by the effect of nonuniform particle size distribution, or luminescence of amorphous red phosphorus. The synthesized Cu3PS4 was verified as p-type through hot point probe measurements.
PL spectrum of Cu3PS4 showing the peak photoresponses at 2.36 eV (525 nm) and 2.19 eV (566 nm) near the theoretical optical band gap of 2.38 eV (521 nm).

E. Cu3PS4 photoresponse
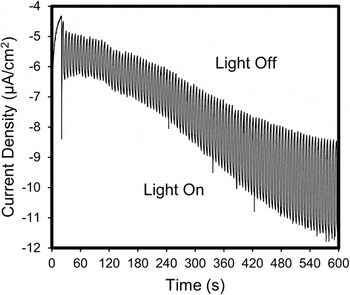
To demonstrate the application of Cu3PS4 as a potential earth abundant solar absorption material, a photoresponse was recorded via photoelectrochemical (PEC) measurements. Cu3PS4 photoelectrodes were fabricated by drop casting the Cu3PS4 particles suspended in ethanol on an indium doped tin oxide (ITO) substrate and dried in air. The photoelectrodes were then heated in a nitrogen atmosphere for 10 min at 200 °C to help adhere the nanoparticles to the substrate. Photocurrent performance was evaluated in 0.5 M Na2S (pH 12.0 with HCl) electrolyte with chopped full film illumination through the back of the ITO substrate with solar simulated AM 1.5G light (100 mW/cm2). Figure 6 shows the light and dark performance of the Cu3PS4 photoelectrodes. At a bias of −1.15 V versus Ag/AgCl (4 M KCl), the generated cathodic photocurrent increases to a current density of 3 µA/cm2 after 600 s. The increasing dark current over time is attributed to the changing equilibrium of the redox couple (S2−/S n 2−) in the electrolyte upon illumination. The photocurrent is stable for 10 min of light/dark cycles without observable photocorrosion. The increased negative current generated when the photoelectrode is illuminated is representative of p-type conductivity. Thus, the Cu3PS4 particles produce a stable photoresponse demonstrating its applicability as a solar absorber. An appropriate n-type material is currently being sought for application as a solar device.
PEC data collected from back illuminating Cu3PS4 on ITO coated soda-lime glass using Na2S (0.5 M, pH 12.0 with HCl) as the electrolyte with an applied bias of −1.15 V versus Ag/AgCl (4 M KCl). As the electrolyte equilibrates, the current density stabilizes to 3 µA/cm2 after 600 s.

Based on the aforementioned observations, a generalized reaction pathway for the synthesis of Cu3PS4 from solution-based precursors is proposed in Scheme 1. The initial reaction of P2S5 with TOP induces the formation of TOPS and liberates phosphorus. Sudden introduction of P2S5–TOP into copper nanocrystals in hot OLA immediately reduces the red phosphorus and induces the reaction between copper and phosphorus. THU acts as a sulfur source when heated in the presence of Cu3P, leading to the formation of Cu3PS4.
Synthesis of Cu3P and Cu3PS4.

IV. CONCLUSIONS
We have presented the solution-based synthesis of Cu3PS4 from Cu3P utilizing an in situ synthesis of amorphous red phosphorus from P2S5 and TOP in one pot, followed by sulfurization via the thermal decomposition of THU. We have shown that Cu3P can be synthesized at temperatures between 200 and 300 °C with no copper impurities present. The Cu3P nanocrystals have an increased concentration of phosphorus on their surface, which is caused largely by unreacted amorphous red phosphorus which accounts for the off-stoichiometries routinely observed in EDS analysis. By reacting Cu3P with sulfur from thermally decomposing THU, we have synthesized Cu3PS4 in a solution-based process. The effective optical band gap of p-type Cu3PS4 has been experimentally determined to be 2.36 eV, and a photogenerated current density of 3 μA/cm2 was observed via PEC measurements, thus showing the potential application of this material as a photoabsorber. The presented synthesis mechanism demonstrates the synthesis and application of one solution-based metal–phosphorus–sulfide alternative energy material, and creates the possibility for further understanding similar earth abundant alternative energy materials.
Supplementary Material
To view supplementary material for this article, please visit http://dx.doi.org/jmr.2015.333.
ACKNOWLEDGMENTS
The authors would like to give special thanks to Karl Wood for his mass spectrometry assistance, and James Meyer for his experimental assistance. This work was supported by the National Science Foundation's Solar Economy IGERT Grant No. 0903670. E.A.S. acknowledges support from the U.S. DOE Office of Science Facility at Brookhaven National Laboratory under Contract No. DE-SC0012704.