
I. INTRODUCTION
Functionally graded materials (FGMs) are a class of materials in which the chemistry or microstructure varies as a function of position within a component, resulting in location-specific material properties that are difficult to obtain using traditional manufacturing processes. Methods for producing metallic FGMs reported in the literature include ultrasonic welding,Reference Domack and Baughman1 fusion welding,Reference Suryakumar, Somashekara and Fujii2 layer/disk remelting,Reference Shen, Pan, Cuiuri, Roberts and Li3 and powder metallurgy.Reference Nemat-Alla4 Directed energy deposition (DED) additive manufacturing (AM) may also be used to fabricate metallic FGMs.Reference Hofmann, Roberts, Otis, Kolodziejska, Dillon, Suh, Shapiro, Liu and Borgonia5–Reference Bobbio, Otis, Borgonia, Dillon, Shapiro, Liu and Beese7 DED AM uses a heat source to create a melt pool in a substrate and deposited layers and delivers either powder or wire feedstock into the melt pool. In powder-based DED AM, multiple powder hoppers, filled with different powder feedstock, can be used, and the relative fractions of these powders delivered to the melt pool can be changed by a few volume percent per layer. DED is ideal for fabricating FGMs as these incremental changes can be used to tailor the chemistry of the component as a function of position.
The present study investigates an FGM that grades from V to Invar 36 (henceforth referred to as Invar). V strengthens ferronickel alloysReference Koptseva, Golubchik, Yu, Chukin and Medvedeva8; thus, it could be used to produce an FGM with graded strength. Additionally, a successful FGM between V and Invar could be incorporated as an intermediate gradient within a Ti–6Al–4V to Invar FGM since a linear gradient between these latter two alloys results in extensive cracking.Reference Bobbio, Otis, Borgonia, Dillon, Shapiro, Liu and Beese7 Grading from Ti–6Al–4V to Invar would be ideal for applications in which the high strength to weight ratio of Ti–6Al–4V9 could be used for light-weighting components in which the near-zero coefficient of thermal expansion of InvarReference Roy, Agrawal and McKinstry10 is needed for dimensional accuracy and stability during temperature excursions. This system may prove useful for the aerospace industry where parts not only undergo extreme temperature changes but also require dimensional accuracy. For example, the low CTE of Invar is exploited in high precision optical mirror substrates and telescope technology.Reference Roy, Agrawal and McKinstry10 Linearly grading between Ti–6Al–4V and Invar using DED AM results in catastrophic cracking due to the formation of Fe–Ti intermetallic phases.Reference Bobbio, Otis, Borgonia, Dillon, Shapiro, Liu and Beese7 However, an FGM grading linearly from V to Ti–6Al–4V has been successfully fabricated using DED AM.Reference Hofmann, Roberts, Otis, Kolodziejska, Dillon, Suh, Shapiro, Liu and Borgonia5 Additionally, it has been shown that V can be used as an intermediate layer between Ti–6Al–4V and 316L stainless steel in laser welding, with no undesirable phases.Reference Tomashchuk, Grevey and Sallamand11 Therefore, V is proposed as an intermediate material between terminal alloys Ti–6Al–4V and Invar to avoid the formation of Fe–Ti intermetallics in the gradient zone.
The present study analyzes an FGM graded from 100 vol% V to 100 vol% Invar fabricated through DED AM, with the aim of analyzing the phases that form in the transition from V to Invar. A successfully fabricated FGM between these components would prove that V can be used as an intermediary material in the Ti–6Al–4V to Invar FGM system. If the linear grading resulted in an unsuccessful FGM, the results from both experimental and computational analyses would indicate the compositions that lead to failure, which could be used for subsequent gradient path design. In the present work, the chemical composition, phase composition, and mechanical properties were experimentally characterized and compared to computational thermodynamic predictions to determine the viability of this linear gradient path.
II. EXPERIMENTAL
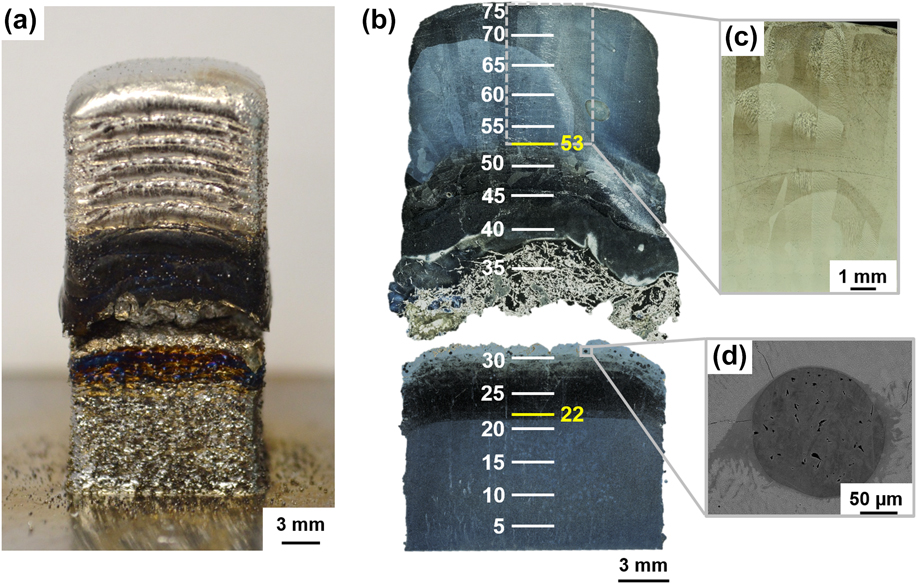
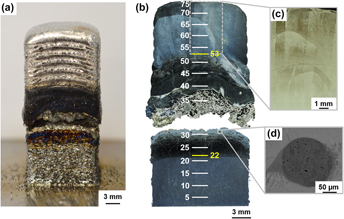
FGM samples grading from V to Invar were fabricated using a DED AM system (RPM 557 Laser Deposition System; RPM Innovations, Inc., Rapid City, South Dakota) using a YAG laser with a laser power of 900 W and a scanning speed of 12.7 mm/s. Square posts with a footprint of 1 cm × 1 cm were deposited onto a Ti baseplate, using a layer height of 0.38 mm, a hatch width of 0.58 mm, and a hatch angle of 90°. Deposition was performed in an Ar atmosphere to avoid oxidation. V and pre-alloyed Invar powders were used. The V powder was sieved to a mesh size of −60/+325, resulting in particles ranging between 45 and 250 μm, while the Invar powder was sieved to a mesh size of −80/+325, resulting in particles ranging between 44 and 177 μm. First, 21 layers of pure V were deposited. Next, the gradient region was deposited, in which the volume of V was decreased by 3 vol% per layer and replaced with 3 vol% of Invar for 32 layers until the transition from 100 vol% V to 100 vol% Invar was complete at layer 53. Finally, 22 layers of pure Invar were deposited, resulting in a final height of approximately 28.5 mm. A photograph of the sample is given in Fig. 1(a).
Images of the V to Invar FGM sample. (a) Photograph of the fabricated sample before removal from the substrate. (b) Optical macrograph of the cross section of the sample with layer numbers indicated, where the gradient region spans layers 22 through 53. (c) Optical micrograph of elongated grains in the 100% Invar region. (d) SEM backscattered electron image of an unmelted V powder particle with some internal porosity.

The sample cracked during fabrication. The post was removed from the baseplate and both the upper and lower portions of the sample were sectioned in the vertical build direction using wire electrical discharge machining. One half of each portion was mounted and polished using standard metallographic techniques, with a final polish on a vibratory polisher using a 0.05 μm silica suspension. The sample was then etched using Kroll’s reagent (2 vol% hydrofluoric acid and 3 vol% nitric acid in water)Reference Carroll, Palmer and Beese12,Reference Vander Voort13 for ten seconds. An optical macrograph of the mounted, polished, and etched sample is shown in Fig. 1(b).
The microstructure, chemical composition, phase composition, and mechanical properties were characterized as a function of location within the FGM. The grain morphology was observed using a scanning electron microscope (SEM; FEI Quanta 200, ThermoFisher Scientific, Waltham, Massachusetts). Energy dispersive X-ray spectroscopy (EDS) was performed using the same system, combined with a silicon drift detector (Oxford X-act PentaFET Precision, Oxford Instruments, Abingdon, United Kingdom), to analyze the chemical composition of the sample. Global phase analysis was performed via X-ray diffraction (XRD) using a Bragg-Brentano-type diffractometer (Panalytical Empyrean, Malvern Panalytical, Malvern, United Kingdom) with a Cu Kα X-ray source operated at 45 kV and 40 mA (λ = 1.54 Å). Local phase analysis was performed using electron backscatter diffraction (EBSD; Oxford Nordlys Max2, Oxford Instruments, Abingdon, United Kingdom). Finally, the microhardness was measured through the gradient region using a Vickers indenter (Leco MHT200, Leco Corporation, Saint Joseph, Michigan) with a load of 300 g and a 15 s dwell time.
To predict the equilibrium phase relations of the system, a computational study of the phases was performed using the CALculation of PHAse Diagrams (CALPHAD) technique.Reference Kaufman and Bernstein14–Reference Liu and Wang18 This approach can be used to predict the phase formation throughout the gradient zone using the Gibbs energies of stable and metastable phases with multicomponent sublattice models parameterized in terms of the compound energy formalism.Reference Carroll, Otis, Borgonia, Suh, Dillon, Shapiro, Hofmann, Liu and Beese6,Reference Bobbio, Otis, Borgonia, Dillon, Shapiro, Liu and Beese7,Reference Hofmann, Kolodziejska, Roberts, Otis, Dillon, Suh, Liu and Borgonia19 The computational predictions provide a first approximation of the phase relationship within an FGM, but they do not always capture all the phases or the relative phase fractions accurately. During AM, the material initially undergoes rapid solidification, which results in non-equilibrium solidification conditions, and then is exposed to heating and cooling thermal cycles with the addition of layers. However, thermodynamic calculations are performed at equilibrium. Therefore, it is important to do these equilibrium calculations at multiple temperatures to predict phase formation during fabrication.Reference Hofmann, Roberts, Otis, Kolodziejska, Dillon, Suh, Shapiro, Liu and Borgonia5,Reference Hofmann, Kolodziejska, Roberts, Otis, Dillon, Suh, Liu and Borgonia19,Reference Bobbio, Bocklund, Otis, Borgonia, Dillon, Shapiro, McEnerney, Liu and Beese20 For this system, an Fe–Ni–V databaseReference Zhao, Yang, Lu, Guo, Wang and Liu21 was used to predict the equilibrium phase relations using Thermo-Calc (Thermo-Calc Software AB, Solna, Sweden).Reference Andersson, Helander, Höglund, Shi and Sundman22 The equilibrium phase fraction and compositions throughout the gradient region were compared to experimental results.
III. RESULTS AND DISCUSSION
A. Elemental composition and microstructural analysis
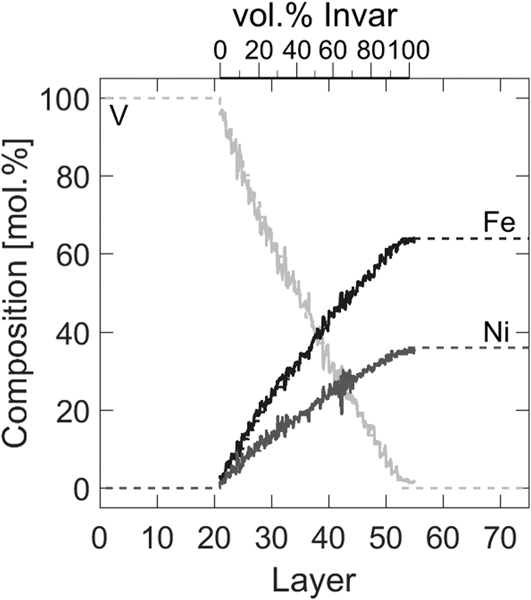
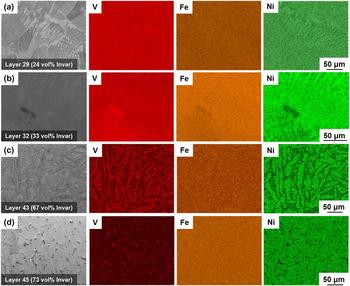
EDS line scans confirmed that the as-deposited composition of the FGM matched with the planned composition, as shown in Fig. 2. While fluctuations in composition of approximately 2–4 mol% were observed throughout the gradient, these primarily can be attributed to noise in the data. However, large fluctuations of approximately 11 mol% in the Ni and V contents were observed in the region between 67 and 73 vol% Invar (layers 40 through 45). These fluctuations corresponded to the presence of multiple phases that formed during solidification, as shown in the EDS maps in Fig. 3(c).
Experimentally measured (symbols) and planned (dashed lines) elemental composition as a function of volume fraction of Invar and layer number.

SEM images and EDS maps of four different compositions within the gradient: (a) layer 29 in which small areas of phase segregation are observed, (b) layer 32, which directly preceded the catastrophic crack, (c) layer 43, which contains a V-rich matrix with Ni-rich particles, and (d) layer 45, in which the matrix shifts from being V-rich to Ni-rich.

Small-scale cracks extended vertically across the gradient region from 18 to 33 vol% Invar. The cracking in these layers preceded the catastrophic crack that occurred at 33 vol% Invar. Extensive macroscopic cracking was observed in layers above this catastrophic crack, between compositions of 39–45 vol% Invar, as can be seen in Fig. 1(b).
The pure V region of the FGM contained unmelted V powder particles, with some of these particles containing small amounts of internal pores, as shown in Fig. 1(d). However, the overall porosity of pure V region of the FGM was calculated to be under 0.05% from SEM images of the corresponding region.
Additional SEM images and the corresponding EDS composition maps for four representative layers within the gradient region are shown in Fig. 3. At Invar fractions ranging from 27 to 33 vol% (layers 30 through 32), there are small areas of high V concentration, as shown in Figs. 3(a) and 3(b). From an Invar fraction of 67 vol% to one of 73 vol% [from layer 43 to 45, Figs. 3(c) and 3(d)], the microstructure transitioned from a V-rich matrix with Ni-rich particles to a Ni-rich matrix with V-rich particles.
B. Phase composition analysis: experiments and computation
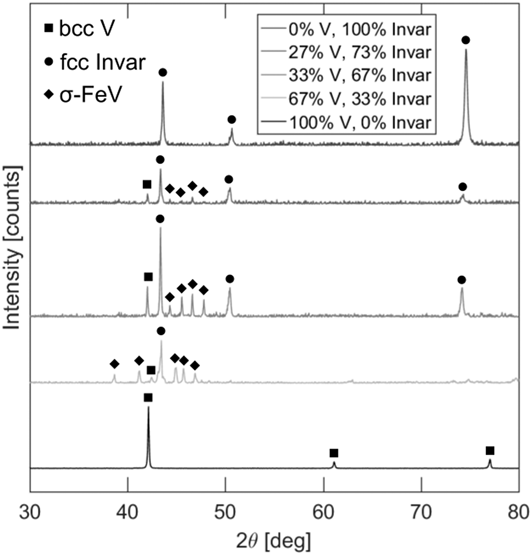
Global phase analysis of the 100 vol% V and 100 vol% Invar regions using XRD indicated the presence of only the bcc V and fcc Invar phases, respectively, as shown in Fig. 4. XRD analysis in the gradient indicated the formation of the σ-FeV phase between Invar fractions of 33 to 73 vol% (layers 32 through 45). No other phases were identified.
XRD patterns for pure V, pure Invar, and three layers within the gradient zone (with amounts of V and Invar given in volume fraction). The three phases present throughout the gradient are marked with symbols.

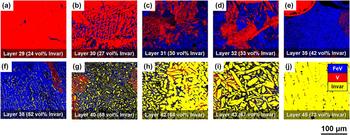
The results of local phase analysis performed using EBSD are shown in Fig. 5 and Table I. Figure 5(b) shows that σ-FeV began to form at 27 vol% Invar. The amount of the σ-FeV phase increased with each layer, reaching a peak at an Invar fraction of 52 vol% (layer 38) as shown in Fig. 5(f). In this region, fcc Invar began to appear in small amounts and continued to increase with the increasing addition of Invar [layer 45, Figs. 5(g–j)]. The bcc V phase appears, in decreasing amounts, throughout the entire gradient region as V is replaced by Invar.
EBSD phase map showing the gradient from primarily pure bcc V to a mixture of phases including σ-FeV, to pure fcc Invar in the FGM. These regions include (a) layer 29, (b) layer 30, (c) layer 31, (d) layer 32, (e) layer 35, (f) layer 38, (g) layer 40, (h) layer 42, (i) layer 43, and (j) layer 45.

Area fraction of the three phases present in the FGM for the ten layers presented in the EBSD phase maps in Fig. 5. The areas whose crystal structure could not be resolved are given by the zero solution fraction.

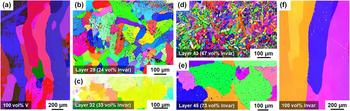
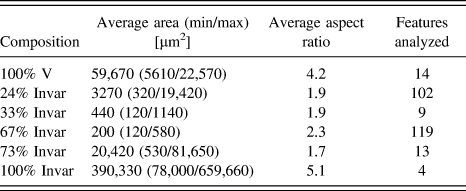
Analysis of the grain or particle size within both the 100% V and 100% Invar regions, as well as at selected compositions within the gradient zone, was performed using EBSD. The resulting inverse pole figure (IPF) maps and the corresponding quantitative results are given in Fig. 6 and Table II, respectively. The sizes and aspect ratios of grains in the 100% V and 100% Invar regions differ from those of the grains or particles in the gradient zone. The terminal metal regions contained large elongated grains. In the 100% V region of the sample, the grains spanned multiple layers, which is shown in Fig. 6(a) as an IPF map. The gradual addition of Invar results in finer features, primarily, the fine precipitates of the σ-FeV phase as shown in Figs. 6(b) and 6(c). Acicular fcc Invar particles are present at a composition of 67 vol% Invar, as shown in Fig. 6(d). These fcc particles coarsen into larger equiaxed grains at a composition of 73 vol% Invar, as shown in Fig. 6(e). The 100% Invar portion of the FGM contains elongated grains that spanned the entire 22 layers of the pure Invar region as shown in Figs. 6(f) and 1(c).
IPF maps showing the changes in feature size throughout the FGM including (a) 100 vol% V, (b) 24 vol% Invar (layer 29), (c) 33 vol% Invar (layer 32), (d) 67 vol% Invar (layer 43), (e) 73 vol% Invar (layer 45), and (f) 100 vol% Invar.

Two-dimensional area analysis of grains or particles in the gradient zone and base metals, including the average area, the average aspect ratio, and the number of features analyzed.

Thermodynamic calculations were used to predict the phases as a function of Invar fraction and compared with the experimental results. The melting temperature of V is 2183 KReference Smith23 and the solidus temperature of Invar is 1698 K.Reference Davis24 The isopleth for the Fe–Ni–V system in Fig. 7(a) shows that the liquidus temperature falls to approximately 1566 K, and a three-phase region that spans different compositions depending on temperature extending down to approximately 1350 K. This would indicate that a temperature below 1350 K should most accurately capture the phase compositions observed experimentally in the sample throughout the gradient zone. Therefore, a temperature of 1300 K was selected for computational analysis. The isothermal ternary phase diagram at 1300 K is given in Fig. 7(b). This shows that the linear gradient path for this FGM system passes through three extended solution phases with increasing Invar content.
Thermodynamic modeling of the system included modeling (a) the isopleth of the Fe–Ni–V system ranging from 300 to 2000 K from Invar, with the ratio of Fe/Ni kept at 64/36, to pure V as a function of the mole fraction of Invar; the lines in this plot are the zero phase fraction lines of the indicated phases; (b) the Fe–Ni–V isothermal phase diagram at 1300 K with the start and end of the gradient path marked; and (c) the computationally predicted phase fractions at 1300 K of the bcc, fcc, and σ-FeV phases as a function of Invar content.

The predicted phase fractions as a function of Invar fraction are given in Fig. 7(c). Initially, the bcc V phase is the only phase present until approximately 0.35 mol fraction (layer 32, 33 vol%) of Invar. Between 0.35 and 0.6 mol fraction of Invar (layers 32–38, 33–52 vol%), the FGM is predicted to be 100% σ. This location matches where σ was observed using EBSD; however, the experimental results indicate that 100% σ was never reached, and rather, the bcc V phase was still present as observed in Figs. 5(e) and 5(f). By an Invar fraction content of 0.75 mol fraction (layer 45, 73 vol%), calculations predict that the only phase present is fcc. However, experimentally, small particles, on the order of a few tens of microns in size, of bcc V and σ-FeV were found here. These discrepancies are a result of the fact that the system may not reach equilibrium during rapid solidification; therefore, the system may not complete the phase transformations to the equilibrium phases, resulting in differences in the amounts of phases seen experimentally and predicted by thermodynamic calculations.
While the volume fractions and locations of phases are not in complete agreement in experiments and computations, all experimentally found phases were computationally predicted to be present within the gradient. This indicates that the current Fe–Ni–V database modeled by Zhao et al.Reference Zhao, Yang, Lu, Guo, Wang and Liu21 is a suitable representation of the compositions probed in this V to Invar FGM. From the experimental observations, the σ phase was the only significant deterrent to a successful build; thus, avoiding this phase could potentially result in a crack-free V to Invar FGM. As shown in Fig. 7(b), the σ phase is present across the entire Fe–V to Ni–V composition space between pure V and Invar. The isopleth given in Fig. 7(a) predicts that the σ phase will be stable over all temperatures that could practically describe the nonequilibrium V to Invar FGM. Therefore, there is no conceivable gradient pathway that will allow for the joining of V directly to Invar. To join V to Invar, an intermediate layer could be introduced to act as a buffer between V and both Fe and Ni, preventing σ phase formation.
When analyzing the isopleth of the system to determine an appropriate temperature for the ternary phase diagram, an additional phase at low temperatures was observed. Figure 7(a) shows the A15 phase, an intermetallic phase with a stoichiometric composition of Ni2V7. This phase forms at low temperatures and therefore, due to the rapid solidification of the AM process, it did not form in the FGM. Intermetallic phase formation is generally slow at low temperatures. For example, the Ni2Cr phase in a Ni–Cr–Mo alloy takes several hundred hours to form.Reference Turchi, Kaufman and Liu25
C. Microhardness analysis
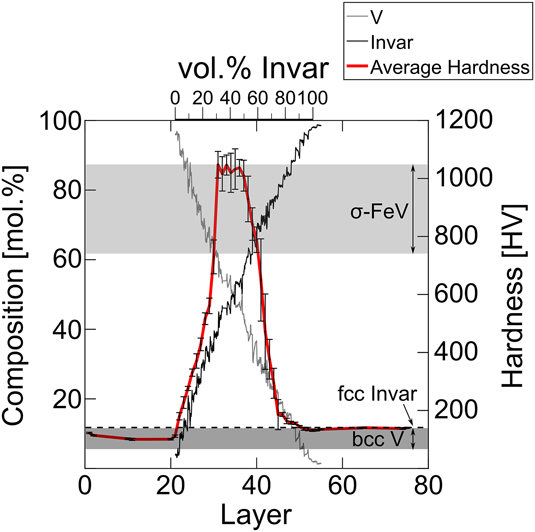
The Vickers hardness as a function of vertical position within the sample is given in Fig. 8. The average hardness values of the pure V and Invar regions of the sample were 109 ± 2.3 HV and 138 ± 1.6 HV, respectively. Within the gradient region, the hardness did not follow a rule-of-mixtures trend between the hardness values of the two terminal metals. Instead, the hardness increased significantly in the gradient region. This region of high hardness correlates with the presence of the intermetallic σ phase, whose hardness ranges from 740 to 1050 HV.Reference Ustinovshikov, Pushkarev and Sapegina26–Reference Seki, Hagiwara and Suzuki28
Microhardness and composition as a function of volume fraction of Invar and layer number. The thick line indicates the average hardness throughout the sample. Hardness values from the literature for VReference Samsonov29–Reference Satou, Abe and Kayano31 (dark gray shading), additively manufactured InvarReference Bobbio, Otis, Borgonia, Dillon, Shapiro, Liu and Beese7 (dashed line), and the σ-FeV phaseReference Ustinovshikov, Pushkarev and Sapegina26 (light gray shading), are shown on the graph.

IV. SUMMARY AND CONCLUSION
In the present paper, a V to Invar FGM fabricated by DED AM was analyzed experimentally and computationally. The local microstructure, elemental composition, phase composition, and mechanical properties were characterized as a function of location. The primary findings of this study are as follows:
(1) Linearly grading, in increments of 3 vol%, from V to Invar resulted in both microscopic and macroscopic cracking in the gradient zone, between compositions of 18–52 vol% Invar.
(2) Using XRD and EBSD to experimentally identify phases, it was determined that σ-FeV was the majority phase at compositions from 27 to 52 vol% Invar. The formation of this brittle phase correlated with an increase in hardness and the catastrophic cracking that occurred at the 33 vol% Invar composition.
(3) The σ phase was the only secondary phase experimentally observed or computationally predicted at the specified analysis temperature. The computational calculations accurately predicted the compositions at which the changes in phase composition occurred within the gradient region, but due to the nonequilibrium process of fabricating the FGM, the predicted volume fractions differed from experimental values. However, the Fe–Ni–V database used was still suitable for analyzing this FGM system.
(4) The σ phase is isolated to specific compositions, which have been identified in this study. The presence of the σ phase proves a linear gradient between V and Invar to be nonviable as a structural FGM. It is still possible to consider V as an intermediate element to grade from Ti–6Al–4V to Invar if another intermediate is introduced between V and Invar.
ACKNOWLEDGMENTS
LDB was supported by an NDSEG Fellowship. BB was supported by an NSF National Research Trainee Fellowship under grant DGE-1449785. Part of the research described in this paper was carried out at the Jet Propulsion Laboratory, California Institute of Technology, under a contract with the National Aeronautics and Space Administration.